| Category | Format | Size |
|---|---|---|
| Beijing Normal University Edition Seventh Grade Mathematics Volume 2 | pptx | 6 MB |

"Relationships between variables represented by images" PPT courseware 4 on the relationship between variables
Description
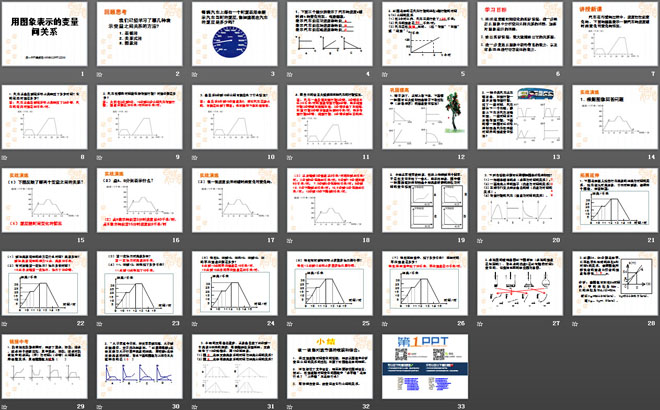
"Relationships between variables represented by images" PPT courseware 4 on the relationship between variables
1. The following three figures respectively show the change of the car's speed v with time t. According to the images:
Which means the car is moving at a constant speed is _____
It means ______ that the car is accelerating
It means that the car is slowing down ______
2. The figure shows the relationship between the distance s traveled by the car and the driving time t (h).
(1) Within 2 hours, the car traveled a total of _____ kilometers;
(2)The speed of the car is _____ kilometers/hour;
(3)The car is moving on ______. (Fill in "constant speed", "acceleration" or "deceleration")
learning target
1. Through the actual situation of speed changing with time, further experience the process of analyzing the relationship between variables from the image, and deepen the understanding of image representation.
2. Give an actual situation and be able to roughly depict its relationship diagram.
3. Further develop the ability to obtain information from images and the ability to express language in an organized manner.
Teach a new lesson
When a car is driving, its speed often changes. The graph below shows the speed of a car as a function of time.
1. How much time elapsed from the start of the car to its final stop? What's its top speed?
Answer: A total of 24 minutes passed from the start to the final stop of the car. The top speed of the car is 90 kilometers per hour.
2. During which time periods does the car maintain a constant speed? What are the speeds per hour?
Answer: The car is traveling at a constant speed from about 2 minutes to 6 minutes, and from 18 minutes to 22 minutes. The speed is 30 kilometers/hour and 90 kilometers/hour respectively.
3. What might have happened between 8 and 10 minutes after departure?
Answer: The speed is 0 from 8 minutes to 10 minutes after departure, so the car is stationary. It may be that it meets a friend; it may also stop to refuel, etc.
Expand and extend
1. The picture below shows the relationship between the distance and time of a person riding a bicycle from home. The cyclist leaves home at nine o'clock and returns home at fifteen o'clock. Based on this picture, answer the question:
(1) When will you arrive at the farthest place from home? How far is it from home?
Arrive at the farthest place from home at 12 o'clock, 30 kilometers away from home.
(2) When does the first break start? How long is the break?
The first break started at 10:30 and lasted for 30 minutes.
2. The glass container into which the water drops enter is as shown in the figure below (the speed of the water droplets is the same). Then how does the height h of the water change with time t? Please select the matching diagram and container.
3. If OA and BA represent the relationship between the distance s and time t of the movement of two students A and B respectively, judge based on the image that the speed of the faster student is _______m per second faster than the speed of the slower student.
summary
Tell us what you gained and experienced from this course.
1. Through the situation of speed changing with time, experience the process of analyzing the relationship between variables from the image, and deepen the understanding of image representation.
2. Not only understand the written language, but also the graphic language. For example: What do "horizontal lines" represent in a graph of velocity versus time? What does the "rising line" mean?
3. Clarify the independent variables, dependent variables and the relationship between them.
Keywords: teaching courseware on the relationship between variables, teaching courseware on the relationship between variables represented by images, Beijing Normal University edition seventh grade mathematics volume 2 PPT courseware, seventh grade mathematics slide courseware download, relationship between variables PPT courseware download , PPT courseware download of the relationship between variables represented by images, in .ppt format
For more information about the PPT courseware "Relationships Between Variables Represented with Graphics" PPT Courseware, please click on the Relationships Between Variables PPT Relation Between Variables Represented with Graphics PPT tag.
"Relationships between variables represented by images" PPT courseware 3 on the relationship between variables:
"Relationships between variables represented by images" PPT courseware on the relationship between variables 3 Review and reflection: How many methods have we learned to express the relationship between variables? 1. List method The following table lists the small profits but quick turnover of a store. Situation, the original price of a certain product is 450 yuan, as...
"Relationships between variables represented by images" PPT courseware 2 on the relationship between variables:
"Relationships between variables represented by images" PPT courseware on the relationship between variables 2 Review and thinking: How many methods have we learned to express the relationship between variables? 1. List method The following table lists the small profits but quick turnover of a store Situation, the original price of a certain product is 450 yuan, as...
"Relationships between variables represented by images" PPT courseware on the relationship between variables:
"Relationships between variables represented by images" PPT courseware on the relationship between variables Learning objectives 1. Understand the correspondence between two variables and initially form the idea of functions. 2. Understand the meaning of the points on the image based on the specific situation. 3. Development comes from images..
File Info
Update Time: 2024-07-06
This template belongs to Mathematics courseware Beijing Normal University Edition Seventh Grade Mathematics Volume 2 industry PPT template
"Relationships between variables represented by images" PPT courseware 4 on the relationship between variables Simple campus recruitment activity planning plan summary enterprise and institution recruitment publicity lecture PPT template is a general PPT template for business post competition provided by the manuscript PPT, simple campus recruitment activity planning plan summary enterprise and institution recruitment promotion Lecture PPT template, you can edit and modify the text and pictures in the source file by downloading the source file. If you want more exquisite business PPT templates, you can come to grid resource. Doug resource PPT, massive PPT template slide material download, we only make high-quality PPT templates!
Tips: If you open the template and feel that it is not suitable for all your needs, you can search for related content "Relationships between variables represented by images" PPT courseware 4 on the relationship between variables is enough.
How to use the Windows system template
Directly decompress the file and use it with office or wps
How to use the Mac system template
Directly decompress the file and use it Office or wps can be used
Related reading
For more detailed PPT-related tutorials and font tutorials, you can view: Click to see
How to create a high-quality technological sense PPT? 4 ways to share the bottom of the box
Notice
Do not download in WeChat, Zhihu, QQ, built-in browsers, please use mobile browsers to download! If you are a mobile phone user, please download it on your computer!
1. The manuscript PPT is only for study and reference, please delete it 24 hours after downloading.
2. If the resource involves your legitimate rights and interests, delete it immediately.
3. Contact information: service@daogebangong.com
"Relationships between variables represented by images" PPT courseware 4 on the relationship between variables, due to usage restrictions, it is only for personal study and reference use. For commercial use, please go to the relevant official website for authorization.
(Personal non-commercial use refers to the use of this font to complete the display of personal works, including but not limited to the design of personal papers, resumes, etc.)
Preview
Related Search: