
| Category | Format | Size |
|---|---|---|
| Jiangsu Education Edition Fifth Grade Mathematics Volume 1 | pptx | 6 MB |

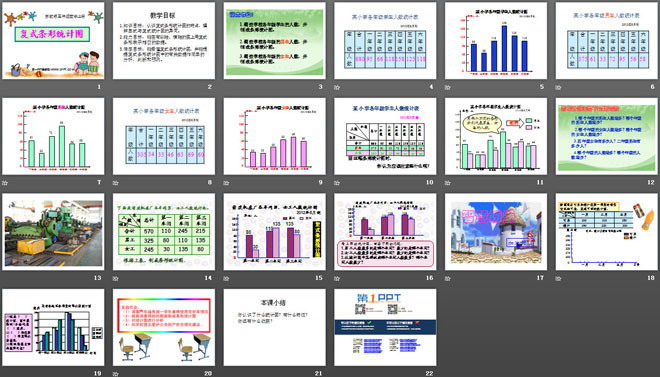
"Complex Bar Chart" statistical table and bar chart PPT courseware
Description
"Complex Bar Chart" statistical table and bar chart PPT courseware
teaching objectives
1. Knowledge objectives: Understand the characteristics of compound bar charts, and understand the similarities and differences between single and compound bar charts.
2. Ability goal: be able to use compound bars to represent corresponding data on graphs with vertical and horizontal axes.
3. Emotional goal: be able to understand compound bar charts and make simple analysis, judgment and prediction based on the relevant data in the compound bar charts.
Investigation work:
1. Survey the number of students in each grade of the school and make a bar chart.
2. Survey the number of boys in each grade of the school and make a bar chart.
3. Survey the number of girls in each grade of the school and make a bar chart.
Look at the statistical chart above and answer the following questions:
1. Which workshop has the largest number of male workers? Which workshop is the least?
2. Which workshop has the largest number of female workers? Which workshop is the least?
3. How to find out which workshop has the largest number of people from the statistical chart? Which workshop has the smallest number of people?
Summary of this lesson
What statistical charts do you know? What are the characteristics? What else have you gained?
Keywords: Statistical table and bar chart courseware, compound bar chart courseware, Jiangsu Education Edition fifth grade mathematics volume PPT courseware download, fifth grade mathematics slide courseware download, statistical table and bar graph PPT courseware download, compound Bar chart PPT courseware download, .PPT format;
For more information about the PPT courseware "Complex Bar Statistics Table and Bar Statistics Chart", please click the Compound Bar Statistics Chart PPT Statistics Table and Bar Statistics Chart PPT tab.
"Complex Bar Chart" Data Representation and Analysis PPT Teaching Courseware:
"Complex Bar Chart" Data Representation and Analysis PPT Teaching Courseware Part One: Learning Objectives 1. Through the pitching game, understand the compound bar chart and understand the characteristics of the compound bar chart. 2. Able to obtain as much information as possible from statistical charts and experience...
"Complex Bar Chart" Data Representation and Analysis PPT Download:
"Complex Bar Statistical Chart" Data Representation and Analysis PPT Download Part One Content: Scenario Introduction In physical education class, the teacher organized students to conduct shooting training, but the students encountered difficulties at the beginning of the practice. Some students shot with one hand. , some students use their hands...
"Complex Bar Chart" Data Representation and Analysis PPT:
"Complex Bar Chart" Data Representation and Analysis PPT Part One: Learning Objectives 1. Understand the compound bar chart and understand the characteristics of the compound bar chart. (Key points) 2. Be able to use the information in the compound bar chart to solve problems, and be able to draw complex...
File Info
Update Time: 2024-07-06
This template belongs to Mathematics courseware Jiangsu Education Edition Fifth Grade Mathematics Volume 1 industry PPT template
"Complex Bar Chart" statistical table and bar chart PPT courseware Simple campus recruitment activity planning plan summary enterprise and institution recruitment publicity lecture PPT template is a general PPT template for business post competition provided by the manuscript PPT, simple campus recruitment activity planning plan summary enterprise and institution recruitment promotion Lecture PPT template, you can edit and modify the text and pictures in the source file by downloading the source file. If you want more exquisite business PPT templates, you can come to grid resource. Doug resource PPT, massive PPT template slide material download, we only make high-quality PPT templates!
Tips: If you open the template and feel that it is not suitable for all your needs, you can search for related content "Complex Bar Chart" statistical table and bar chart PPT courseware is enough.
How to use the Windows system template
Directly decompress the file and use it with office or wps
How to use the Mac system template
Directly decompress the file and use it Office or wps can be used
Related reading
For more detailed PPT-related tutorials and font tutorials, you can view: Click to see
How to create a high-quality technological sense PPT? 4 ways to share the bottom of the box
Notice
Do not download in WeChat, Zhihu, QQ, built-in browsers, please use mobile browsers to download! If you are a mobile phone user, please download it on your computer!
1. The manuscript PPT is only for study and reference, please delete it 24 hours after downloading.
2. If the resource involves your legitimate rights and interests, delete it immediately.
3. Contact information: service@daogebangong.com
"Complex Bar Chart" statistical table and bar chart PPT courseware, due to usage restrictions, it is only for personal study and reference use. For commercial use, please go to the relevant official website for authorization.
(Personal non-commercial use refers to the use of this font to complete the display of personal works, including but not limited to the design of personal papers, resumes, etc.)
Preview
Related Search: