| Category | Format | Size |
|---|---|---|
| Beijing Normal University Edition Seventh Grade Mathematics Volume 1 | pptx | 6 MB |

"Selection of Statistical Charts" Data Collection and Organization PPT Download (Lesson 2)
Description
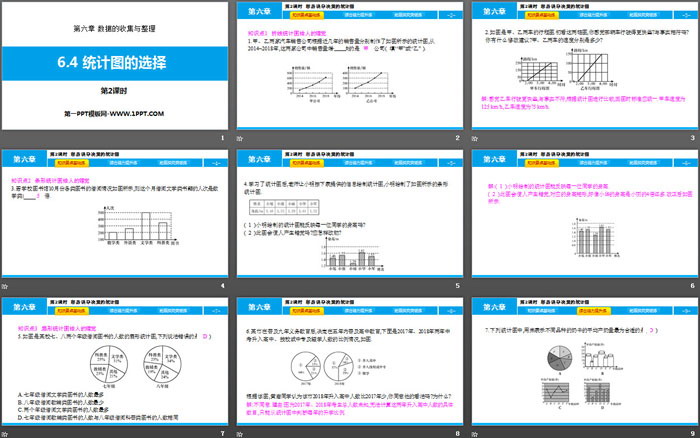
"Selection of Statistical Charts" Data Collection and Organization PPT Download (Lesson 2)
Part One Content: Basic Knowledge Key Points
Knowledge point 1: The illusion given by the line chart
1. Two automobile sales companies A and B have respectively produced the statistical charts as shown in the figure based on their sales in recent years. From 2014 to 2018, the sales volume of these two companies has grown faster than that of company A (fill in "A" or "B" ).
2. The picture shows the itinerary of two cars A and B. At first glance, which car do you think is traveling faster? Is it consistent with the facts? Do you have any suggestions for modification? What are the speeds of cars A and B? What are the differences?
Solution: It feels like car B is driving faster, which is inconsistent with the facts. Compare according to the statistical chart. The standards should be unified when drawing the graph. The speed of car A is 125 km/h, and the speed of car B is 75 km/h.
Knowledge point 2: The illusion given by bar graphs
3. If the borrowing situation of various books in the school library in October is as shown in the figure, the number of people borrowing literature books this month is 2.5 times that of mathematics books.
4. After learning the statistical graph, the teacher asked Xiao Ming to draw a statistical graph according to the information provided in the table. Xiao Ming drew a bar graph as shown in the figure.
(1) Can the statistical graph drawn by Xiao Ming reflect the height of each student?
(2) Will this picture give people an illusion? How should it be modified?
Selection of statistical charts PPT, part 2: improvement of comprehensive capabilities
7. Among the following statistical charts, the most appropriate one to represent the average milk production of different breeds of cows is (D)
8. The picture below shows the statistical chart of the annual expenditures of two households, A and B.
(1) From the chart, we can see intuitively that family A’s food expenditure is 3 times that of education expenditure, which is actually 5/3 times;
(2) Intuitively looking at the percentage of education expenditures of two families in the total annual expenditures, the larger family is "B", which is actually "the same size";
(3) In order to more clearly reflect Family A’s annual expenditures, the bar chart should be modified as follows: The values on the vertical axis representing the annual expenditures will start from 0.
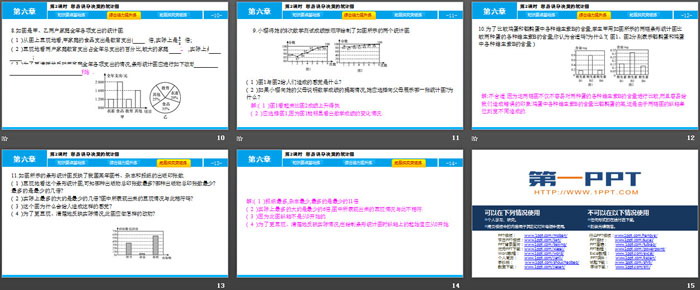
9. Sakura drew two statistical graphs of her eight math test scores in order as shown in the figure.
(1) What feeling do people get from Figure 1 and Figure 2?
(2) If Sakura explains the improvement in math scores to her parents, which statistical chart should she choose to show to her parents? Why?
Selection of statistical charts PPT, the third part: expansion, exploration and breakthrough
11. The bar chart shown in the figure reflects the number of copies of books, magazines and newspapers published in my country in a certain year.
(1) Looking at this bar chart intuitively, can we know which publication has the largest number of printed sheets? Which publication has the smallest total number of printed sheets? How many times is the largest number the smallest?
(2) How many times is the largest number actually the smallest number? Does the intuitive situation shown in the picture match this?
(3) Why does this picture give people such a feeling?
(4) In order to reflect the actual situation more intuitively and clearly, what changes should be made to this picture?
Solution: (1) There are the most newspapers and the least magazines. The most newspapers are 11 times the least.
(2) In fact, the largest one is about 6 times the smallest one, and the intuitive situation shown in the picture is not consistent with this.
(3) Because the vertical axis of this figure does not start from 0.
(4) In order to reflect the actual situation more intuitively and clearly, the starting value on the vertical axis should start from 0 when drawing a bar chart.
Keywords: Beijing Normal University Edition seventh-grade mathematics PPT courseware free download, selection of statistical graphs PPT download, data collection and organization PPT download, .PPT format;
For more information about the PPT courseware "Selection of Statistical Charts, Collection and Sorting of Data", please click on the PPT tab of "Selection of Statistical Charts, Collection and Sorting of Data".
"Selection of Statistical Charts" Data Collection and Organization PPT Download (Lesson 1):
"Selection of Statistical Charts" Data Collection and Arrangement PPT Download (Lesson 1) Part One: Knowledge Points Basic Knowledge Points 1 Bar Chart and Line Chart 1. The picture below shows a domestic brand mobile phone store this year 8~ December high-definition large-screen mobile phone sales line statistics...
"Selection of Statistical Charts" Data collection and organization PPT download:
"Selection of Statistical Charts" Data Collection and Arrangement PPT Download Part One Content: Learning Objectives 1. Understand the characteristics of different statistical charts, and be able to select appropriate statistical charts based on actual problems. (Key Points) 2. Be able to obtain effective results from statistical charts Information, correct decision-making. (Difficulty...
"Selection of Statistical Charts" Data Collection and Organization PPT (Lesson 2):
"Selection of Statistical Charts" Data Collection and Arrangement PPT (Lesson 2) Part One Content: Learning Objectives 1. Through specific problem situations, let students feel some misleading that some artificial data and its representation may cause, and improve Students’ understanding of data,...
File Info
Update Time: 2024-07-11
This template belongs to Mathematics courseware Beijing Normal University Edition Seventh Grade Mathematics Volume 1 industry PPT template
"Selection of Statistical Charts" Data Collection and Organization PPT Download (Lesson 2) Simple campus recruitment activity planning plan summary enterprise and institution recruitment publicity lecture PPT template is a general PPT template for business post competition provided by the manuscript PPT, simple campus recruitment activity planning plan summary enterprise and institution recruitment promotion Lecture PPT template, you can edit and modify the text and pictures in the source file by downloading the source file. If you want more exquisite business PPT templates, you can come to grid resource. Doug resource PPT, massive PPT template slide material download, we only make high-quality PPT templates!
Tips: If you open the template and feel that it is not suitable for all your needs, you can search for related content "Selection of Statistical Charts" Data Collection and Organization PPT Download (Lesson 2) is enough.
How to use the Windows system template
Directly decompress the file and use it with office or wps
How to use the Mac system template
Directly decompress the file and use it Office or wps can be used
Related reading
For more detailed PPT-related tutorials and font tutorials, you can view: Click to see
How to create a high-quality technological sense PPT? 4 ways to share the bottom of the box
Notice
Do not download in WeChat, Zhihu, QQ, built-in browsers, please use mobile browsers to download! If you are a mobile phone user, please download it on your computer!
1. The manuscript PPT is only for study and reference, please delete it 24 hours after downloading.
2. If the resource involves your legitimate rights and interests, delete it immediately.
3. Contact information: service@daogebangong.com
"Selection of Statistical Charts" Data Collection and Organization PPT Download (Lesson 2), due to usage restrictions, it is only for personal study and reference use. For commercial use, please go to the relevant official website for authorization.
(Personal non-commercial use refers to the use of this font to complete the display of personal works, including but not limited to the design of personal papers, resumes, etc.)
Preview
Related Search: