Western Normal University Edition First Grade Mathematics Volume 1
Beijing Normal University Edition Seventh Grade Mathematics Volume 1
People's Education Press First Grade Mathematics Volume 1
People's Education Press Third Grade Mathematics Volume 1
People's Education Press Second Grade Mathematics Volume 1
Beijing Normal University Edition Seventh Grade Mathematics Volume 2
Beijing Normal University Edition Fifth Grade Mathematics Volume 1
Qingdao Edition Seventh Grade Mathematics Volume 1
Hebei Education Edition Third Grade Mathematics Volume 1
Beijing Normal University Edition Eighth Grade Mathematics Volume 1
Hebei Education Edition Seventh Grade Mathematics Volume 2
People's Education High School Mathematics Edition B Compulsory Course 2
Beijing Normal University Edition Fifth Grade Mathematics Volume 2
Hebei Education Edition Fourth Grade Mathematics Volume 2
Qingdao Edition Seventh Grade Mathematics Volume 2
Jiangsu Education Edition Fourth Grade Mathematics Volume 1

| Category | Format | Size |
|---|---|---|
| Beijing Normal University Edition Seventh Grade Mathematics Volume 1 | pptx | 6 MB |

"Representation of Data" Data Collection and Organization PPT Courseware (Lesson 1)
2024-09-28
Copyright statement: This material is compiled and released by the user of Daoge Resources. The copyright belongs to the author. For commercial use, please contact the copyright owner. If there is any infringement, please contact the webmaster to remove the resource.
Download Points: 0.00
Free Download
Upgrade VIP
Favorite
Views: 5035 / Downloads: 865
Description
"Representation of Data" Data Collection and Organization PPT Courseware (Lesson 1)
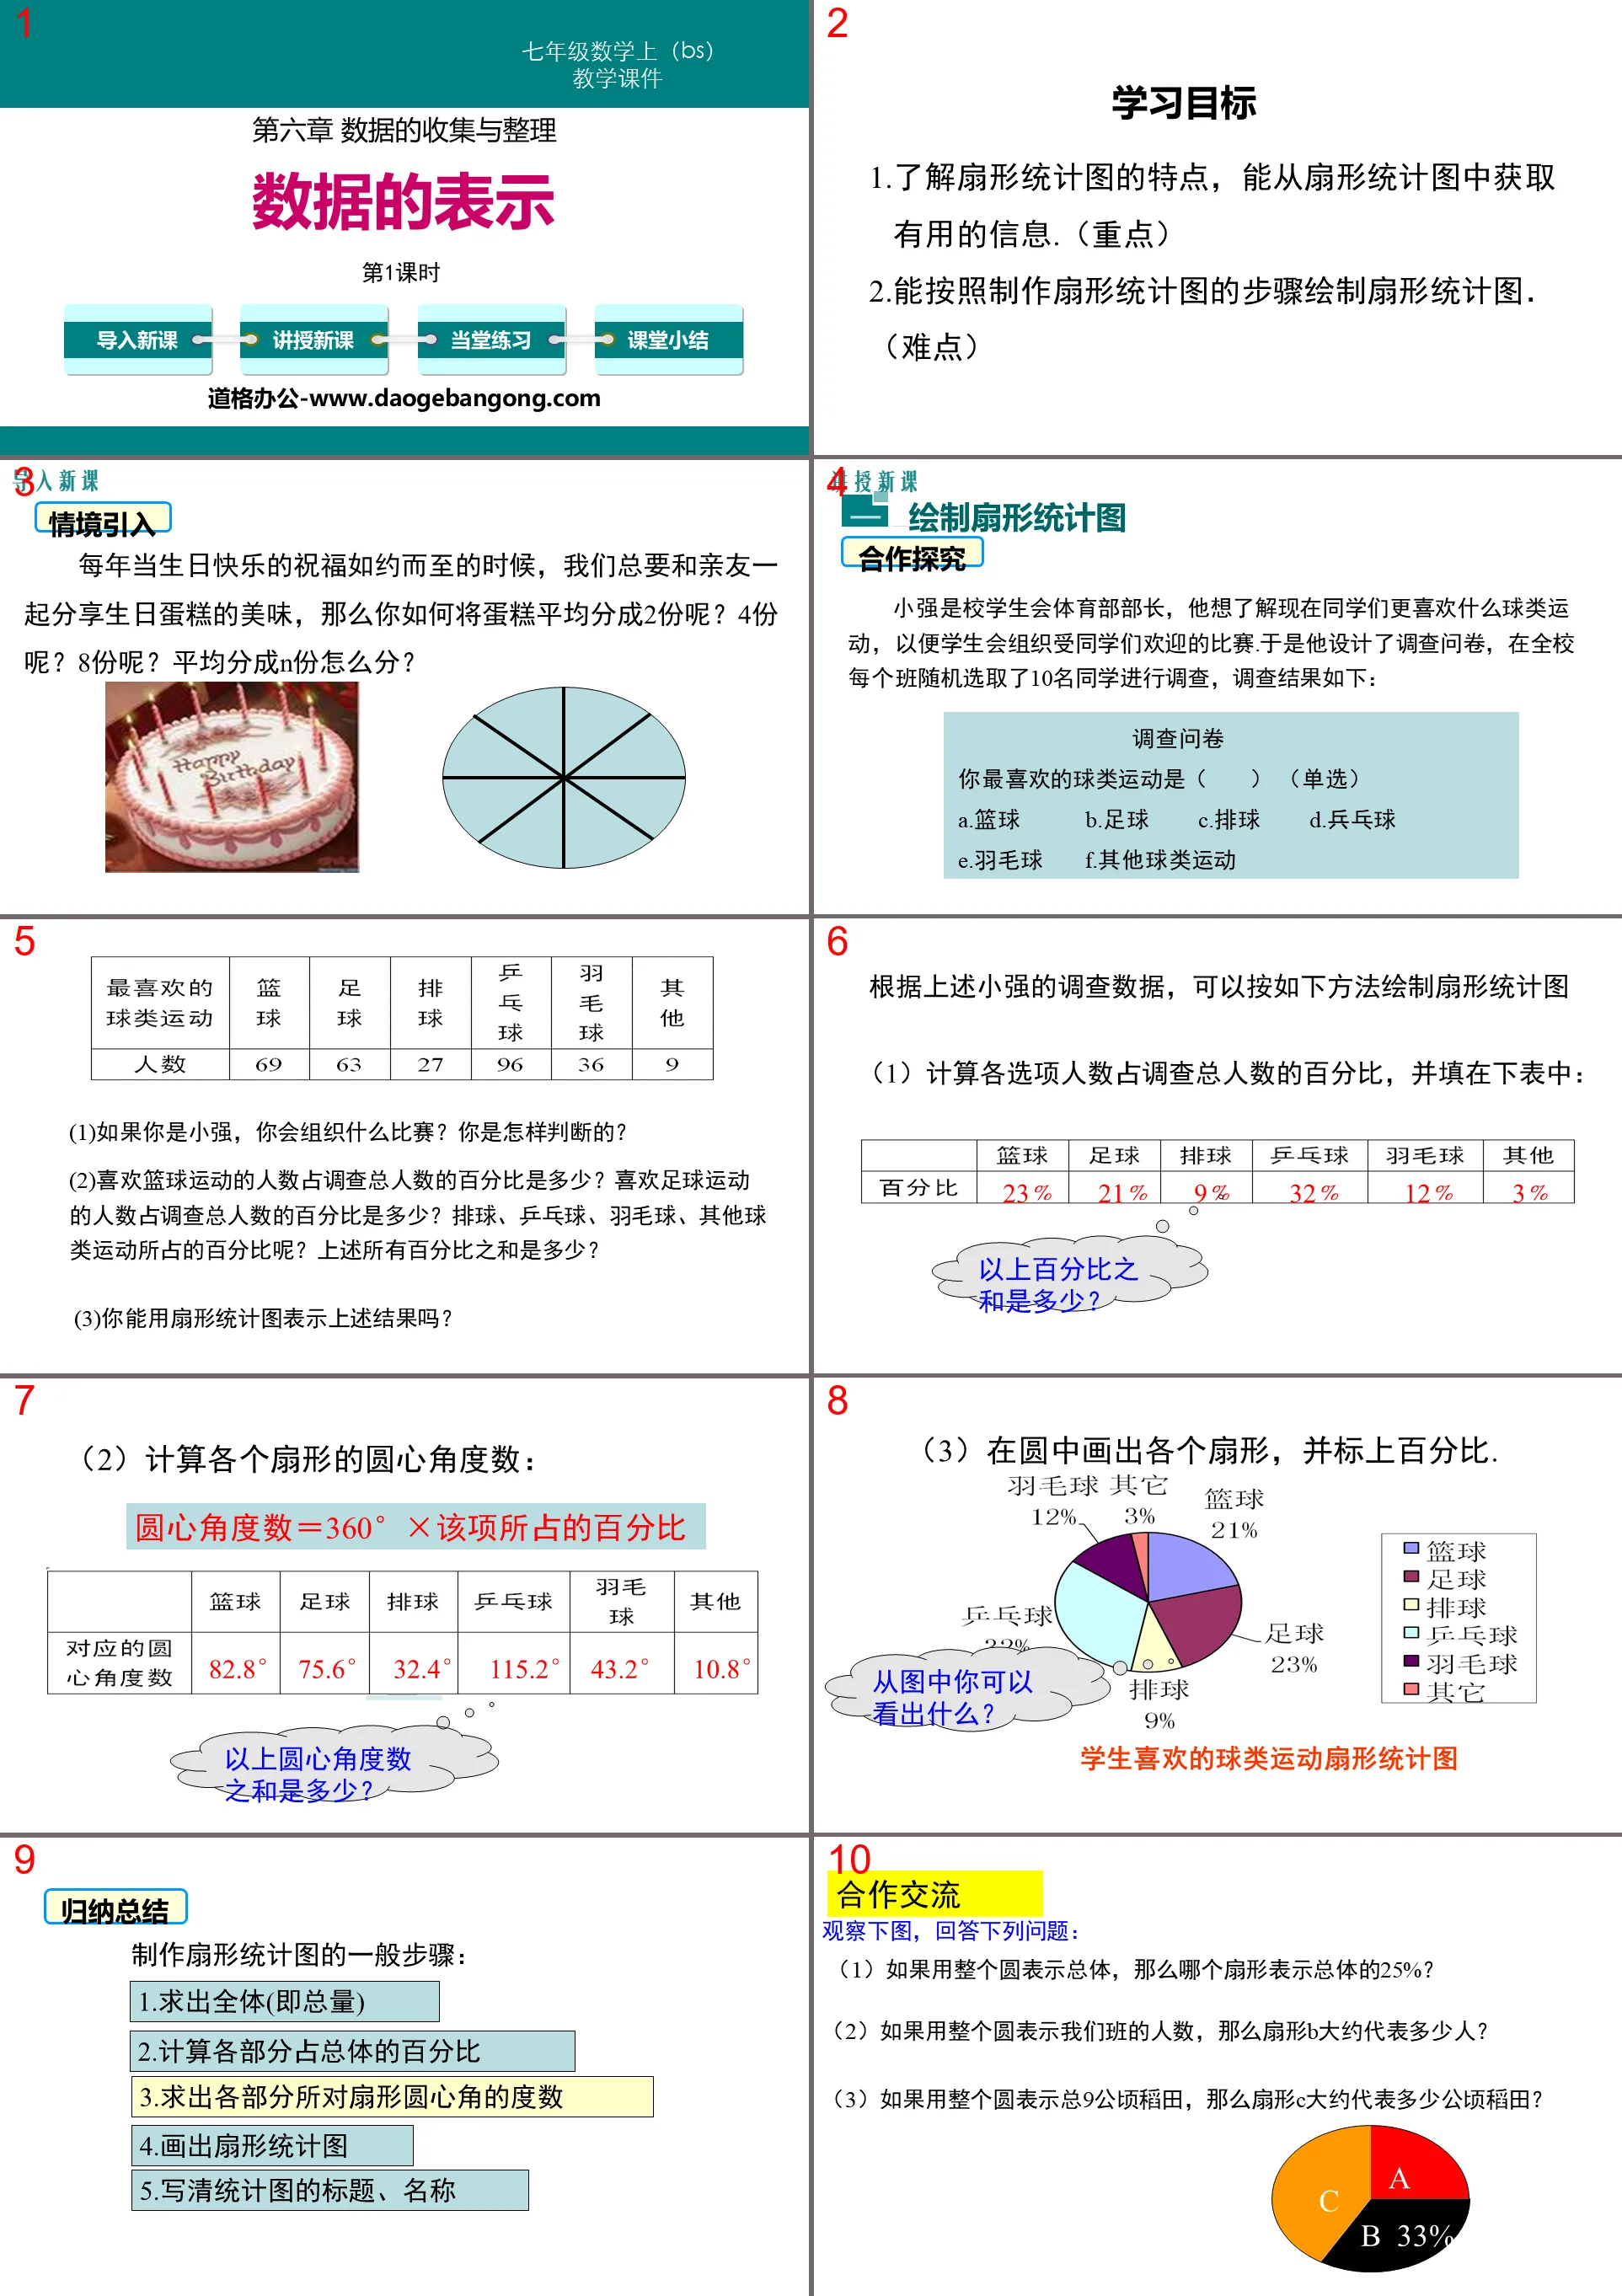
Part One: Learning Objectives
1. Understand the characteristics of fan charts and obtain useful information from fan charts. (Key points)
2. Be able to draw a sector chart according to the steps of making a sector chart. (difficulty)
Data Representation PPT, Part 2 Content: Teaching New Lessons
Draw a fan chart
collaborative inquiry
Xiaoqiang is the director of the sports department of the school's student union. He wants to know what ball sports students prefer now so that the student union can organize competitions that are popular with students. So he designed a questionnaire and randomly selected 10 students from each class in the school to conduct the survey. Investigation, the findings are as follows:
Questionnaire
What is your favorite ball game ( ) (single choice)
A. Basketball B. Football C. Volleyball D. Table tennis
E. Badminton F. Other ball sports
(1) If you were Xiaoqiang, what competition would you organize? How do you judge?
(2) What percentage of people who like basketball account for the total number of people surveyed? What is the percentage of people who like football as a percentage of the total number of people surveyed? What are the percentages of volleyball, table tennis, badminton, and other ball sports? What is the sum of all the above percentages?
(3) Can you express the above results using a fan chart?
In conclusion
General steps for making a fan chart:
1. Find the whole (that is, the total amount)
2. Calculate the percentage of each part to the whole
3. Find the degree of the central angle of the sector corresponding to each part
4. Draw a fan chart
5. Write down the title and name of the statistical chart
Analysis of classic examples
Example 1 The following table is the results of a survey on the love of football among seventh-grade boys in a certain school. Based on the results, a fan-shaped statistical chart is drawn.
[ Analysis Just draw a fan chart and write the title.
Represent data using fan charts
Example 2 The picture shown is a fan chart of the number of students participating in extracurricular activities in Grade 8 (3). If the number of students participating in art classes is 16, then the number of students participating in other activities is _____.
[ Analysis -32%-40%)=4 (people).
In conclusion
(1) The circle represents the whole, and each sector in the circle represents different parts of the whole;
(2) The fan chart not only reflects the proportional relationship between parts and the whole, but also reflects the size relationship between parts.
Data representation PPT, the third part: practice in class
1. As shown in the picture, Xiaohong made a fan-shaped statistical chart of her various consumption situations in May. It can be seen from the picture that ()
A. The percentage of each consumption amount in the total consumption amount
B. The amount of each consumption
C. Total amount spent
D. Increases and decreases in various consumption amounts
2. As shown in the figure is a fan-shaped statistical chart of the world's population. The central angle of the Chinese part is _________.
3. A certain school drew a fan-shaped statistical chart as shown in the figure based on the mathematics scores of the third-grade students who took the high school entrance examination last year. The size of the central angle of the fan-shaped circle representing grade A in the figure is ________.
4. As shown in the figure is a fan-shaped statistical chart of Xiaogang's work and rest time distribution in a day. If Xiaogang wants to adjust his reading time to 2 hours a day, then his reading time needs to be increased by ()
A. 15 minutes b. 48 minutes
C. 60 minutes D. 105 minutes
Data Representation PPT, Part 4: Class Summary
fan chart
Draw a fan chart
1. Find the whole (that is, the total amount)
2. Calculate the percentage of each part to the whole
3. Find the measure of the central angle of the circle
4. Draw a fan chart
5. Write down the title and name of the statistical chart
Represent data using fan charts
The sum of the parts equals the whole
The sum of the central angles of a sector is 360°
The sum of the percentages is 1
Keywords: Free download of Beijing Normal University version of seventh grade mathematics volume 1 PPT courseware, data representation PPT download, data collection and organization PPT download, .PPT format;
For more information about the PPT courseware "Data Collection and Organizing Data Representation", please click the Data Collection and Organizing PPT Data Representation PPT tab.
"Representation of Data" Data collection and organization PPT download (Lesson 2):
"Representation of Data" Data collection and arrangement PPT download (Lesson 2) Part 1: Knowledge points Basic knowledge point 1 Bar chart 1. To understand the main channels through which middle school students obtain information, 50 middle school students were randomly selected for a questionnaire survey The questionnaire is set up A..
"Representation of Data" Data collection and organization PPT download (Lesson 1):
"Representation of Data" Data collection and arrangement PPT download (Lesson 1) Part 1: Knowledge points Basic knowledge point 1 Application of statistical tables 1. The statistics of the number of people entering and exiting the Zhuzhou Exhibition Hall during four time periods on a certain day are as follows: The time period when the number of people in the museum changes the most...
"Representation of Data" Data Collection and Organization PPT Courseware (Lesson 2):
"Representation of Data" Data Collection and Organization PPT Courseware (Lesson 2) Part One Content: Learning Objectives 1. Clarify the steps of making frequency histograms, and be able to draw frequency histograms. (Difficulty) 2. Be able to draw frequency histograms from frequency distribution tables and Obtain relevant information from the frequency histogram and make...
File Info
Update Time: 2024-09-28
This template belongs to Mathematics courseware Beijing Normal University Edition Seventh Grade Mathematics Volume 1 industry PPT template
"Representation of Data" Data Collection and Organization PPT Courseware (Lesson 1) Simple campus recruitment activity planning plan summary enterprise and institution recruitment publicity lecture PPT template is a general PPT template for business post competition provided by the manuscript PPT, simple campus recruitment activity planning plan summary enterprise and institution recruitment promotion Lecture PPT template, you can edit and modify the text and pictures in the source file by downloading the source file. If you want more exquisite business PPT templates, you can come to grid resource. Doug resource PPT, massive PPT template slide material download, we only make high-quality PPT templates!
Tips: If you open the template and feel that it is not suitable for all your needs, you can search for related content "Representation of Data" Data Collection and Organization PPT Courseware (Lesson 1) is enough.
How to use the Windows system template
Directly decompress the file and use it with office or wps
How to use the Mac system template
Directly decompress the file and use it Office or wps can be used
Related reading
For more detailed PPT-related tutorials and font tutorials, you can view: Click to see
How to create a high-quality technological sense PPT? 4 ways to share the bottom of the box
Notice
Do not download in WeChat, Zhihu, QQ, built-in browsers, please use mobile browsers to download! If you are a mobile phone user, please download it on your computer!
1. The manuscript PPT is only for study and reference, please delete it 24 hours after downloading.
2. If the resource involves your legitimate rights and interests, delete it immediately.
3. Contact information: service@daogebangong.com
"Representation of Data" Data Collection and Organization PPT Courseware (Lesson 1), due to usage restrictions, it is only for personal study and reference use. For commercial use, please go to the relevant official website for authorization.
(Personal non-commercial use refers to the use of this font to complete the display of personal works, including but not limited to the design of personal papers, resumes, etc.)
Preview
Related Search:
"Representation of Data" Data Collection and Organization PPT Courseware (Lesson 1)
2024-09-28
Copyright statement: This material is compiled and released by the user of Daoge Resources. The copyright belongs to the author. For commercial use, please contact the copyright owner. If there is any infringement, please contact the webmaster to remove the resource.
Download Points: 0.00
Free Download
Upgrade VIP
Favorite
Views: 5035 / Downloads: 865


