Business Planet Edition 7th Grade Geography Volume 2
Business Planet Edition 7th Grade Geography Volume 1
Business Planet Edition Geography for Grade 8 Volume 1
People's Education Edition Geography for Seventh Grade Volume 2
Shanghai Education Edition Seventh Grade Geography Volume 1
Business Planet Edition Geography for Eighth Grade Volume 2
Hunan Education Edition High School Geography Compulsory Course I
People's Education Edition Geography for Grade 7 Volume 1
Shanghai Education Edition Geography for Sixth Graders Volume 1
People's Education Edition Geography for Eighth Grade Volume 2
Lu Ke version of high school geography compulsory course I
Hunan Education Edition High School Geography Compulsory Course II
People's Education Edition Geography for Grade 8 Volume 1
Shanghai Education Edition Seventh Grade Geography Volume 2
Compulsory Course 1 of High School Geography in China Graphics Edition
Shanghai Education Edition Geography for Sixth Graders Volume 2

| Category | Format | Size |
|---|---|---|
| People's Education Edition Geography for Grade 7 Volume 1 | pptx | 6 MB |

"Changes and Distribution of Temperature" Weather and Climate PPT Courseware 3
2024-10-06
Copyright statement: This material is compiled and released by the user of Daoge Resources. The copyright belongs to the author. For commercial use, please contact the copyright owner. If there is any infringement, please contact the webmaster to remove the resource.
Download Points: 0.00
Free Download
Upgrade VIP
Favorite
Views: 4351 / Downloads: 908
Description
"Changes and Distribution of Temperature" Weather and Climate PPT Courseware 3
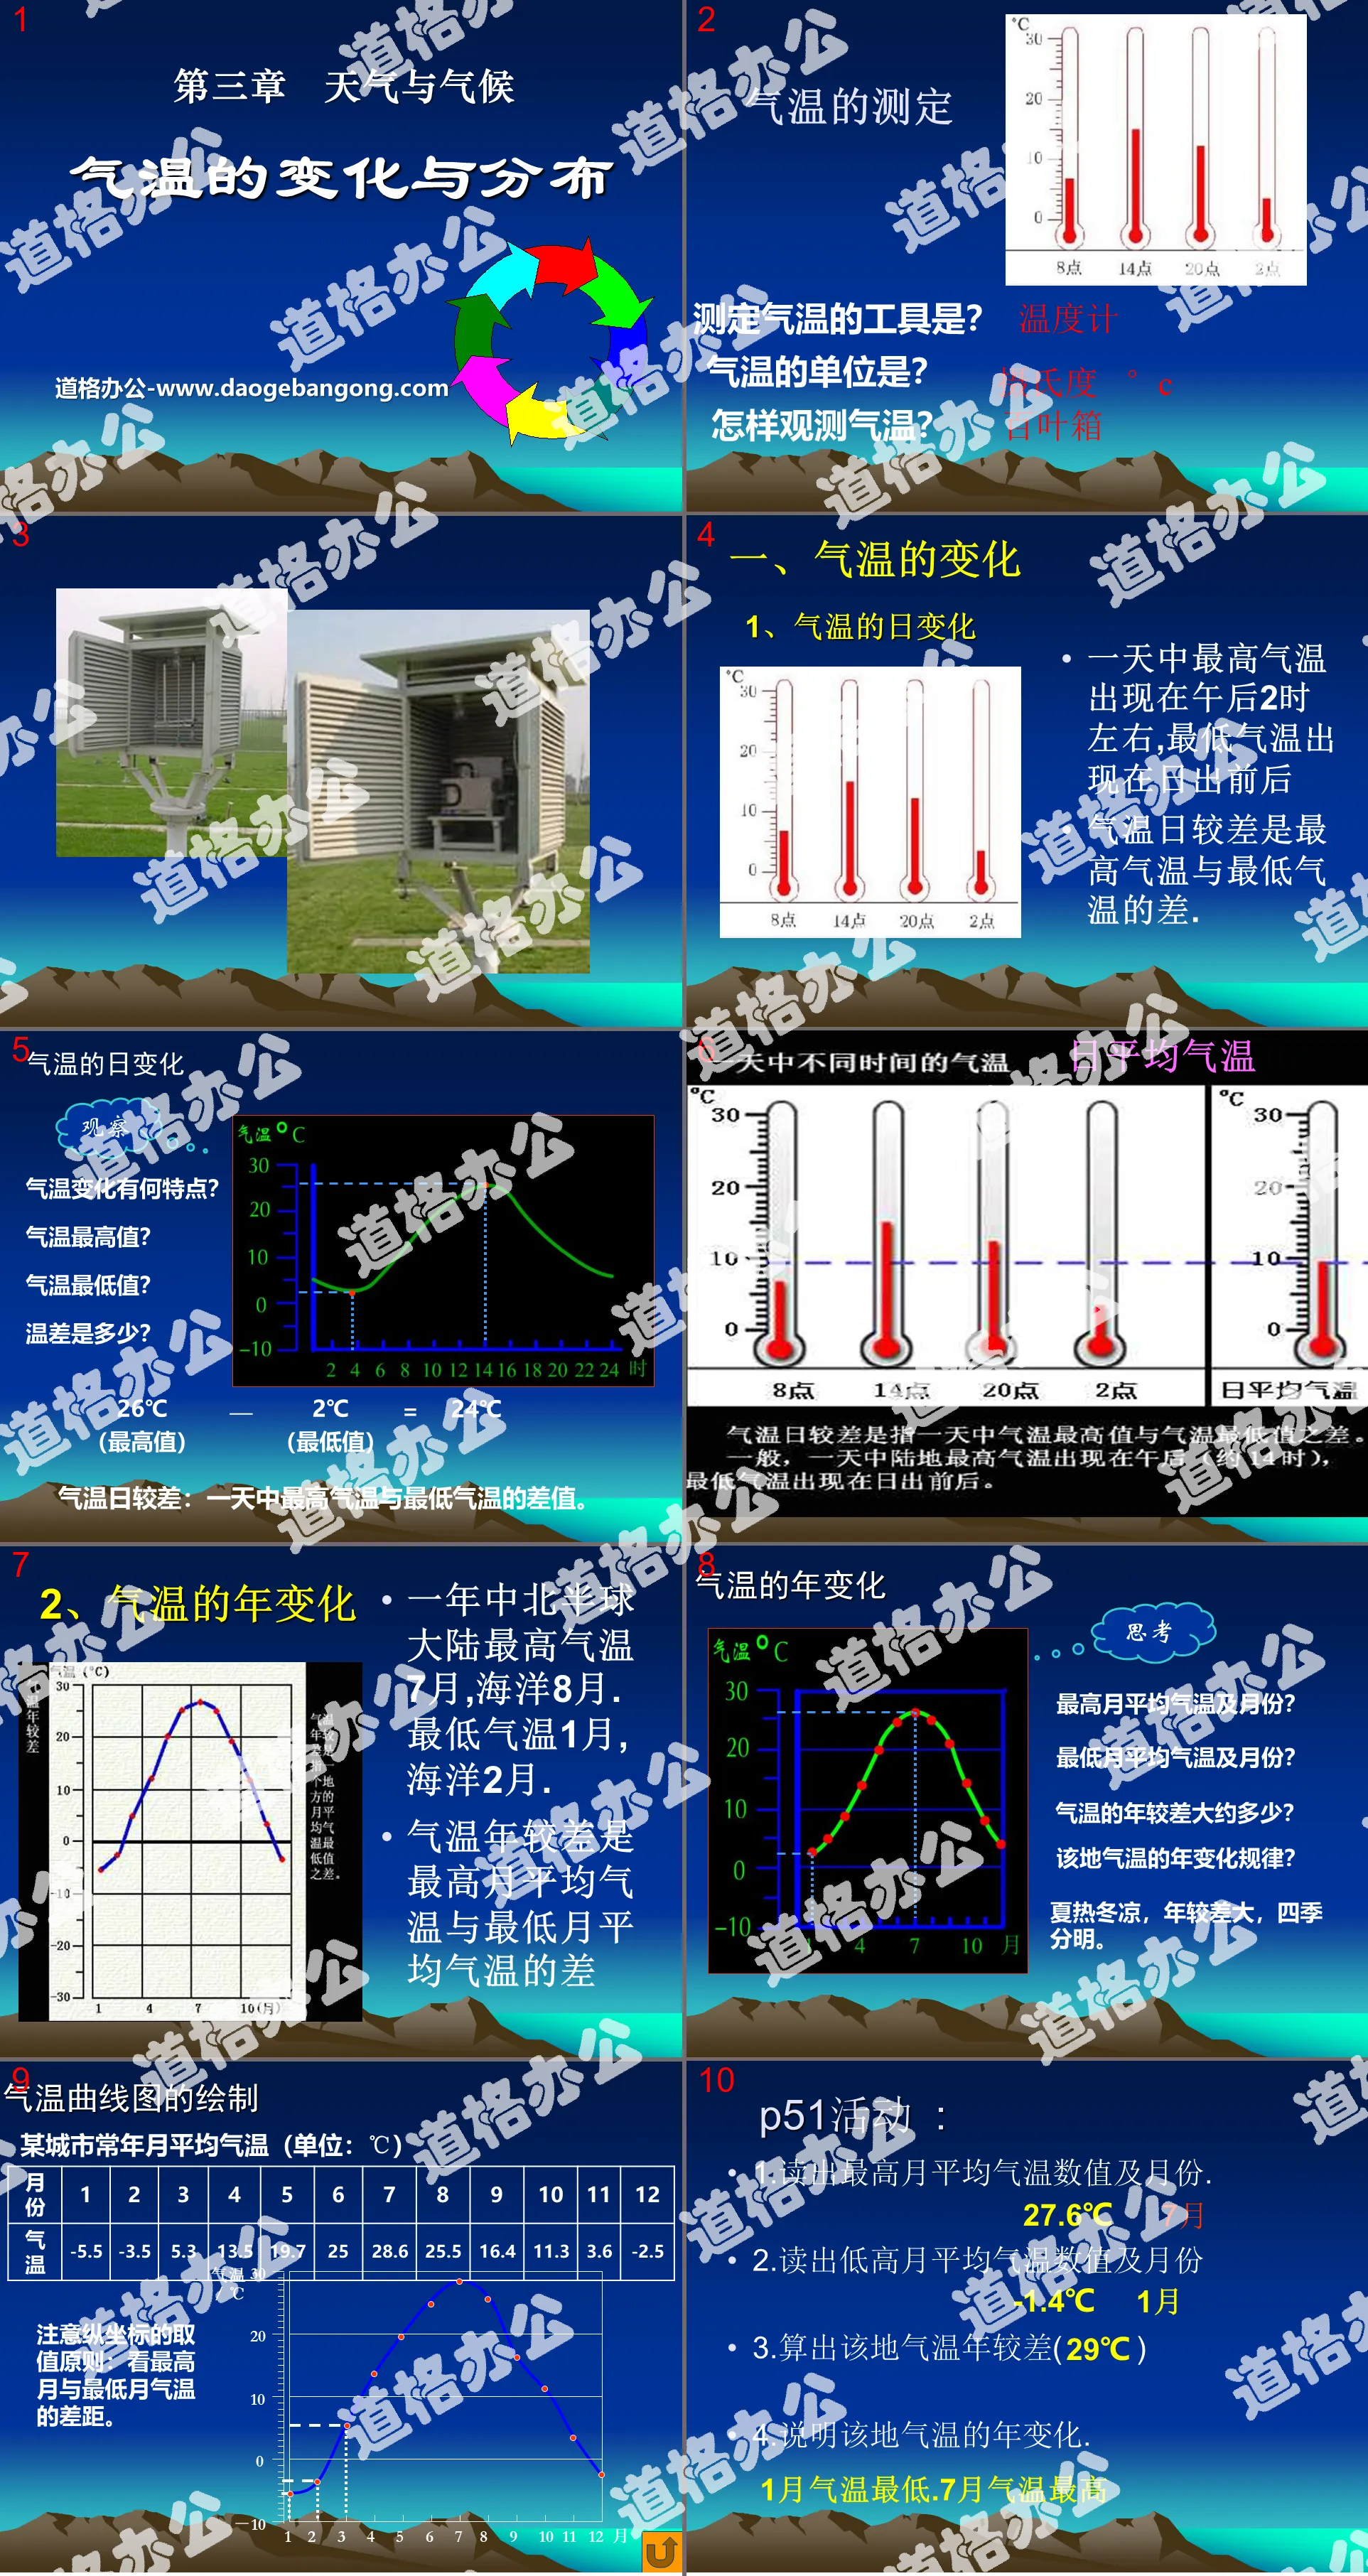
1. Changes in temperature
1. Diurnal changes in temperature
The highest temperature of the day occurs around 2 p.m., and the lowest temperature occurs around sunrise.
The diurnal temperature range is the difference between the highest temperature and the lowest temperature.
Diurnal variation of temperature
Diurnal temperature range: the difference between the highest and lowest temperatures in a day.
2. Annual changes in temperature
In the northern hemisphere, the highest temperature in the continent is in July and in the ocean in August. The lowest temperature is in January and in the ocean in February.
The annual temperature range is the difference between the highest monthly average temperature and the lowest monthly average temperature.
p51 activities:
1. Read the highest monthly average temperature value and month.
2. Read out the low and high monthly average temperature values and the month
3. Calculate the annual temperature range of the place ( )
4. Explain the annual changes in temperature in this place.
2. Distribution of temperature
Isotherm
How are contours defined?
Definition: On a map, a line connecting points with the same temperature at the same time.
Interpretation of isotherms (similar to contours)
Notice:
1. The temperature difference between two adjacent isotherms is equal. (Equivalent distance is the same)
2. The denser the isotherms, the greater the temperature difference; the sparser the isotherms, the smaller the temperature difference.
3. The place where the isotherm is closed is the center of high (low) temperature.
The distribution of temperature is usually represented by an isotherm diagram.
The temperature difference is large in areas with dense isotherms
Where the isotherms are sparse, the temperature difference is small.
Main factors affecting temperature distribution
1. Latitude location: The temperature is high at low latitudes, and the temperature is low at high latitudes
2. Sea and land distribution: The land temperature is high in summer and the ocean temperature is low. In winter, the opposite is true.
3. Topographic factors: high altitudes have low temperatures, low altitudes have high temperatures (the temperature drops by 0.6°C per 100 meters above sea level)
1. How does the temperature change from the equator to the poles? What is the reason for the change?
The temperature gradually decreases from the equator to the poles. The reason for the change is that solar radiation decreases from the equator to the poles.
2. Point out the main latitude ranges where the annual average temperature is higher than 20 degrees Celsius and lower than -10 degrees Celsius.
The annual average temperature above 20℃ is mainly distributed between the North and South Tropic of Cancer
Annual average temperatures below -10°C are mainly distributed within the Arctic and Antarctic Circles
Keywords: Weather and climate teaching courseware, temperature change and distribution teaching courseware, People's Education Edition seventh grade geography PPT courseware download, seventh grade geography slide courseware download, weather and climate PPT courseware download, temperature change and distribution PPT courseware Download, .PPT format;
For more information about the PPT courseware "Weather and Climate Temperature Changes and Distribution", please click the Weather and Climate PPT Temperature Changes and Distribution PPT tab.
"Changes and Distribution of Temperature" Weather and Climate PPT Courseware 6:
"Changes and Distribution of Temperature" Weather and Climate PPT Courseware 6 New course standard requirements: 1. Read the world annual average and January and July average temperature distribution maps, and summarize the characteristics of world temperature distribution. 2. Use temperature data to draw a temperature curve and tell how the temperature changes over time..
"Changes and Distribution of Temperature" Weather and Climate PPT Courseware 5:
"Changes and Distribution of Temperature" Weather and Climate PPT Courseware 5 Riddle Quiz This is how my weight changes. The answer must be the scale. There is a river on the wall. No waves but wind. It grows when it is hot and falls when it is cold. ... ... ... Determination of air temperature and air temperature Determination..
"Changes and Distribution of Temperature" Weather and Climate PPT Courseware 4:
"Changes and Distribution of Temperature" Weather and Climate PPT Courseware 4 Teaching Objectives 1. Know some basic concepts about temperature, such as daily average temperature, monthly average temperature, annual average temperature, daily temperature variation, annual temperature variation, daily temperature range, annual temperature range, isothermal...
File Info
Update Time: 2024-10-06
This template belongs to Geography courseware People's Education Edition Geography for Grade 7 Volume 1 industry PPT template
"Changes and Distribution of Temperature" Weather and Climate PPT Courseware 3 Simple campus recruitment activity planning plan summary enterprise and institution recruitment publicity lecture PPT template is a general PPT template for business post competition provided by the manuscript PPT, simple campus recruitment activity planning plan summary enterprise and institution recruitment promotion Lecture PPT template, you can edit and modify the text and pictures in the source file by downloading the source file. If you want more exquisite business PPT templates, you can come to grid resource. Doug resource PPT, massive PPT template slide material download, we only make high-quality PPT templates!
Tips: If you open the template and feel that it is not suitable for all your needs, you can search for related content "Changes and Distribution of Temperature" Weather and Climate PPT Courseware 3 is enough.
How to use the Windows system template
Directly decompress the file and use it with office or wps
How to use the Mac system template
Directly decompress the file and use it Office or wps can be used
Related reading
For more detailed PPT-related tutorials and font tutorials, you can view: Click to see
How to create a high-quality technological sense PPT? 4 ways to share the bottom of the box
Notice
Do not download in WeChat, Zhihu, QQ, built-in browsers, please use mobile browsers to download! If you are a mobile phone user, please download it on your computer!
1. The manuscript PPT is only for study and reference, please delete it 24 hours after downloading.
2. If the resource involves your legitimate rights and interests, delete it immediately.
3. Contact information: service@daogebangong.com
"Changes and Distribution of Temperature" Weather and Climate PPT Courseware 3, due to usage restrictions, it is only for personal study and reference use. For commercial use, please go to the relevant official website for authorization.
(Personal non-commercial use refers to the use of this font to complete the display of personal works, including but not limited to the design of personal papers, resumes, etc.)
Preview
Related Search:
"Changes and Distribution of Temperature" Weather and Climate PPT Courseware 3
2024-10-06
Copyright statement: This material is compiled and released by the user of Daoge Resources. The copyright belongs to the author. For commercial use, please contact the copyright owner. If there is any infringement, please contact the webmaster to remove the resource.
Download Points: 0.00
Free Download
Upgrade VIP
Favorite
Views: 4351 / Downloads: 908


