Western Normal University Edition First Grade Mathematics Volume 1
Beijing Normal University Edition Seventh Grade Mathematics Volume 1
People's Education Press First Grade Mathematics Volume 1
People's Education Press Second Grade Mathematics Volume 1
Beijing Normal University Edition Seventh Grade Mathematics Volume 2
People's Education Press Third Grade Mathematics Volume 1
Beijing Normal University Edition Eighth Grade Mathematics Volume 1
Qingdao Edition Seventh Grade Mathematics Volume 1
Hebei Education Edition Third Grade Mathematics Volume 1
Beijing Normal University Edition Fifth Grade Mathematics Volume 1
Hebei Education Edition Seventh Grade Mathematics Volume 2
People's Education Press First Grade Mathematics Volume 2
People's Education High School Mathematics Edition B Compulsory Course 2
Qingdao Edition Seventh Grade Mathematics Volume 2
Hebei Education Edition Fourth Grade Mathematics Volume 2
Beijing Normal University Edition Fifth Grade Mathematics Volume 2

| Category | Format | Size |
|---|---|---|
| Hebei Education Edition Eighth Grade Mathematics Volume 2 | pptx | 6 MB |

"Data Collation and Presentation" PPT
2024-11-05
Copyright statement: This material is compiled and released by the user of Daoge Resources. The copyright belongs to the author. For commercial use, please contact the copyright owner. If there is any infringement, please contact the webmaster to remove the resource.
Download Points: 0.00
Free Download
Upgrade VIP
Favorite
Views: 1358 / Downloads: 732
Description
"Data Collation and Presentation" PPT
Part One: Introduction of New Course
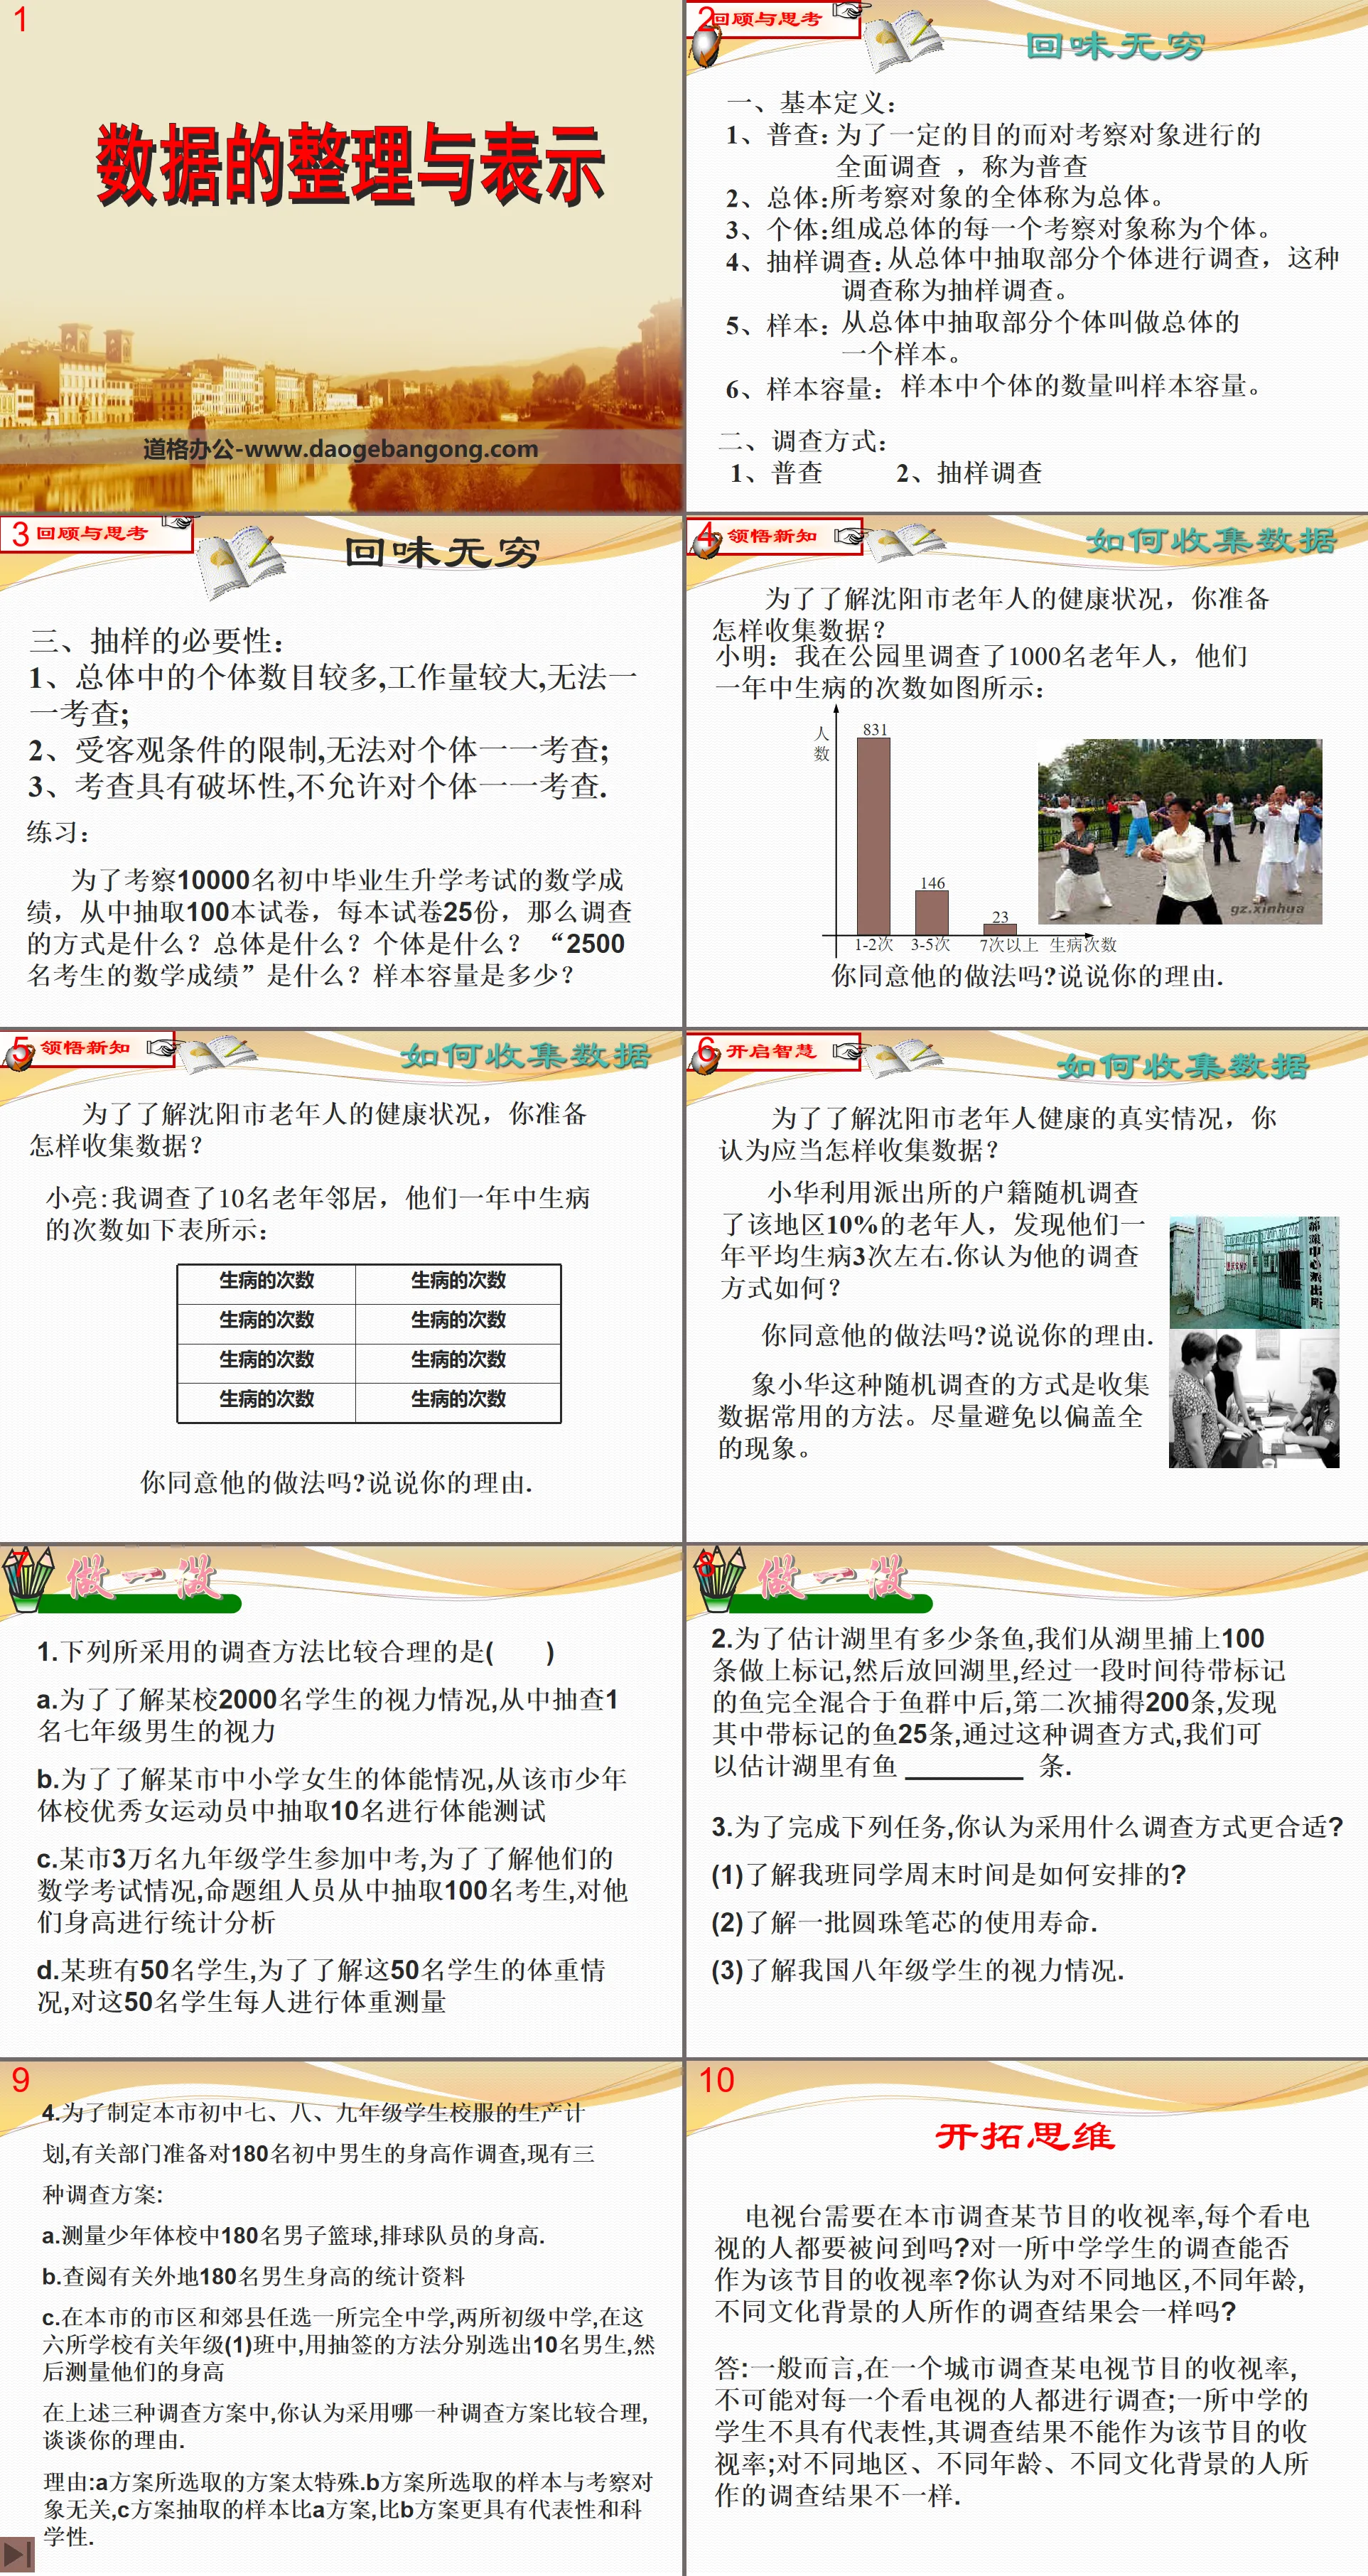
1. Basic definition:
1. Census: A comprehensive survey of inspection objects for a certain purpose is called a census.
2. Overall: The entire object under investigation is called the overall.
3. Individual: Each object of investigation that makes up the population is called an individual.
4. Sampling survey: Selecting some individuals from the population for investigation is called a sampling survey.
5. Sample: Extracting some individuals from the population is called a sample of the population.
6. Sample size: The number of individuals in the sample is called sample size.
2. Investigation method:
1. Census
2. Sample survey
3. Necessity of sampling:
1. The number of individuals in the population is large and the workload is large, making it impossible to examine them one by one;
2. Limited by objective conditions, it is impossible to examine individuals one by one;
3. The examination is destructive and it is not allowed to examine individuals one by one.
Data organization and presentation PPT, part 2 content: Understanding new knowledge
In order to understand the health status of the elderly in Shenyang, how are you going to collect data?
Xiao Ming: I surveyed 1,000 elderly people in the park. The number of times they got sick in a year is as shown in the picture:
Xiaoliang: I surveyed 10 elderly neighbors. The number of times they got sick in a year is as shown in the following table:
Xiaohua used the household registration information from the police station to randomly survey 10% of the elderly in the area and found that they fell ill about three times a year on average. What do you think of his survey method?
Do you agree with what he did? Tell us your reasons.
Random surveys like Xiaohua's are a common method of collecting data. Try to avoid the phenomenon of partial coverage.
Data organization and presentation PPT, the third part: Do it
1. Which of the following investigation methods is more reasonable? ( )
A. In order to understand the vision of 2,000 students in a school, the vision of a seventh-grade boy was randomly checked.
B. In order to understand the physical fitness of primary and secondary school girls in a city, 10 outstanding female athletes from the youth sports school in the city were selected for a physical fitness test.
C. In a certain city, 30,000 ninth-grade students participated in the high school entrance examination. In order to understand their mathematics test performance, the proposition team selected 100 candidates and conducted statistical analysis on their heights.
D. There are 50 students in a certain class. In order to understand the weight of these 50 students, the weight of each of the 50 students is measured.
2. In order to estimate how many fish there are in the lake, we caught 100 fish from the lake, marked them, and then put them back into the lake. After a period of time, the marked fish were completely mixed into the fish school, and the second catch was 200, and 25 tagged fish were found. Through this survey method, we can estimate that there are ________ fish in the lake.
3. In order to complete the following tasks, what investigation method do you think is more appropriate?
(1) Understand how my classmates arrange their weekend time?
(2) Understand the service life of a batch of ballpoint pen refills.
(3) Understand the vision status of eighth grade students in my country.
Data organization and presentation PPT, part 4: data analysis
Can you express the following data?
(1) In the fifth national census in 2000, the survey results on the educational status of our citizens were: for every 1,000 people, about 340 people had a junior high school education, about 111 people had a high school education, and There are about 36 people with university education.
(2) A student runs 1500 meters every day. The seven tests in one stage are: the first three times each took 7 minutes and 30 seconds to complete the distance, the fourth time took 7 minutes, the fifth time took 6 minutes and 48 seconds, the sixth time took 6 minutes and 30 seconds, and the fourth time took 6 minutes and 30 seconds. Seven times took 6 minutes and 18 seconds.
(3) According to the survey, there are 300 students in the ninth grade of a school. 30% of the students go to school on foot, 50% of the students go to school by bus, 15% of the students go to school by bicycle, and the rest use other means of transportation to go to school.
Data organization and presentation PPT, Part 5: Consolidation exercises
1. From 1953 to 2000, my country conducted five censuses. The following table is a statistical table of the national population in previous censuses:
Please create an appropriate statistical graph to represent the above data.
2. A survey was conducted on the types of TV sets in 400 households in a certain community, and a sector diagram was obtained as shown in the figure. Based on the information provided in the figure, answer the following questions:
(1) How many households have two color TV sets?
(2) How many households have only one color TV?
(3) What is the central angle of the sector in the figure showing the proportion of households with only black and white TV sets?
3. The bar chart of the GDP of my country's 11 coastal cities in 2006 is as shown in the figure. Based on the data provided in the figure, find the percentage of Shanghai's GDP in 2006 to the GDP of the 11 coastal cities.
Data organization and presentation PPT, Part 6 content: Class summary
What did we learn today? What did you gain from this lesson?
Keywords: Free download of Hebei Education Edition mathematics PPT courseware for eighth grade volume 2, data organization and presentation PPT download, .PPT format;
For more information about the "Data Collation and Presentation" PPT courseware, please click the "Data Collation and Presentation ppt" tab.
"Data Collation and Representation" PPT courseware:
Contents of the first part of the PPT courseware "Data Collation and Presentation": Classroom Questions Question 1 Since liberation, my country's gross domestic product (GDP) has been on an increasing trend, from only 67.9 billion yuan in 1952 to 114.93 billion yuan in 1962 and 114.93 billion yuan in 1970. It rose to 2252.7 in the year..
File Info
Update Time: 2024-11-05
This template belongs to Mathematics courseware Hebei Education Edition Eighth Grade Mathematics Volume 2 industry PPT template
"Data Collation and Presentation" PPT Simple campus recruitment activity planning plan summary enterprise and institution recruitment publicity lecture PPT template is a general PPT template for business post competition provided by the manuscript PPT, simple campus recruitment activity planning plan summary enterprise and institution recruitment promotion Lecture PPT template, you can edit and modify the text and pictures in the source file by downloading the source file. If you want more exquisite business PPT templates, you can come to grid resource. Doug resource PPT, massive PPT template slide material download, we only make high-quality PPT templates!
Tips: If you open the template and feel that it is not suitable for all your needs, you can search for related content "Data Collation and Presentation" PPT is enough.
How to use the Windows system template
Directly decompress the file and use it with office or wps
How to use the Mac system template
Directly decompress the file and use it Office or wps can be used
Related reading
For more detailed PPT-related tutorials and font tutorials, you can view: Click to see
How to create a high-quality technological sense PPT? 4 ways to share the bottom of the box
Notice
Do not download in WeChat, Zhihu, QQ, built-in browsers, please use mobile browsers to download! If you are a mobile phone user, please download it on your computer!
1. The manuscript PPT is only for study and reference, please delete it 24 hours after downloading.
2. If the resource involves your legitimate rights and interests, delete it immediately.
3. Contact information: service@daogebangong.com
"Data Collation and Presentation" PPT, due to usage restrictions, it is only for personal study and reference use. For commercial use, please go to the relevant official website for authorization.
(Personal non-commercial use refers to the use of this font to complete the display of personal works, including but not limited to the design of personal papers, resumes, etc.)
Preview
Related Search:
"Data Collation and Presentation" PPT
2024-11-05
Copyright statement: This material is compiled and released by the user of Daoge Resources. The copyright belongs to the author. For commercial use, please contact the copyright owner. If there is any infringement, please contact the webmaster to remove the resource.
Download Points: 0.00
Free Download
Upgrade VIP
Favorite
Views: 1358 / Downloads: 732


