Western Normal University Edition First Grade Mathematics Volume 1
Beijing Normal University Edition Seventh Grade Mathematics Volume 1
People's Education Press First Grade Mathematics Volume 1
People's Education Press Third Grade Mathematics Volume 1
People's Education Press Second Grade Mathematics Volume 1
Beijing Normal University Edition Seventh Grade Mathematics Volume 2
Hebei Education Edition Third Grade Mathematics Volume 1
Beijing Normal University Edition Fifth Grade Mathematics Volume 1
Qingdao Edition Seventh Grade Mathematics Volume 1
Beijing Normal University Edition Eighth Grade Mathematics Volume 1
Hebei Education Edition Seventh Grade Mathematics Volume 2
People's Education High School Mathematics Edition B Compulsory Course 2
Qingdao Edition Seventh Grade Mathematics Volume 2
People's Education Press First Grade Mathematics Volume 2
Beijing Normal University Edition Fifth Grade Mathematics Volume 2
Hebei Education Edition Fourth Grade Mathematics Volume 2

| Category | Format | Size |
|---|---|---|
| Hebei Education Edition Eighth Grade Mathematics Volume 2 | pptx | 6 MB |

"Data Collation and Representation" PPT courseware
2024-10-05
Copyright statement: This material is compiled and released by the user of Daoge Resources. The copyright belongs to the author. For commercial use, please contact the copyright owner. If there is any infringement, please contact the webmaster to remove the resource.
Download Points: 0.00
Free Download
Upgrade VIP
Favorite
Views: 1732 / Downloads: 124
Description
"Data Collation and Representation" PPT courseware
Part One: Classroom Questions
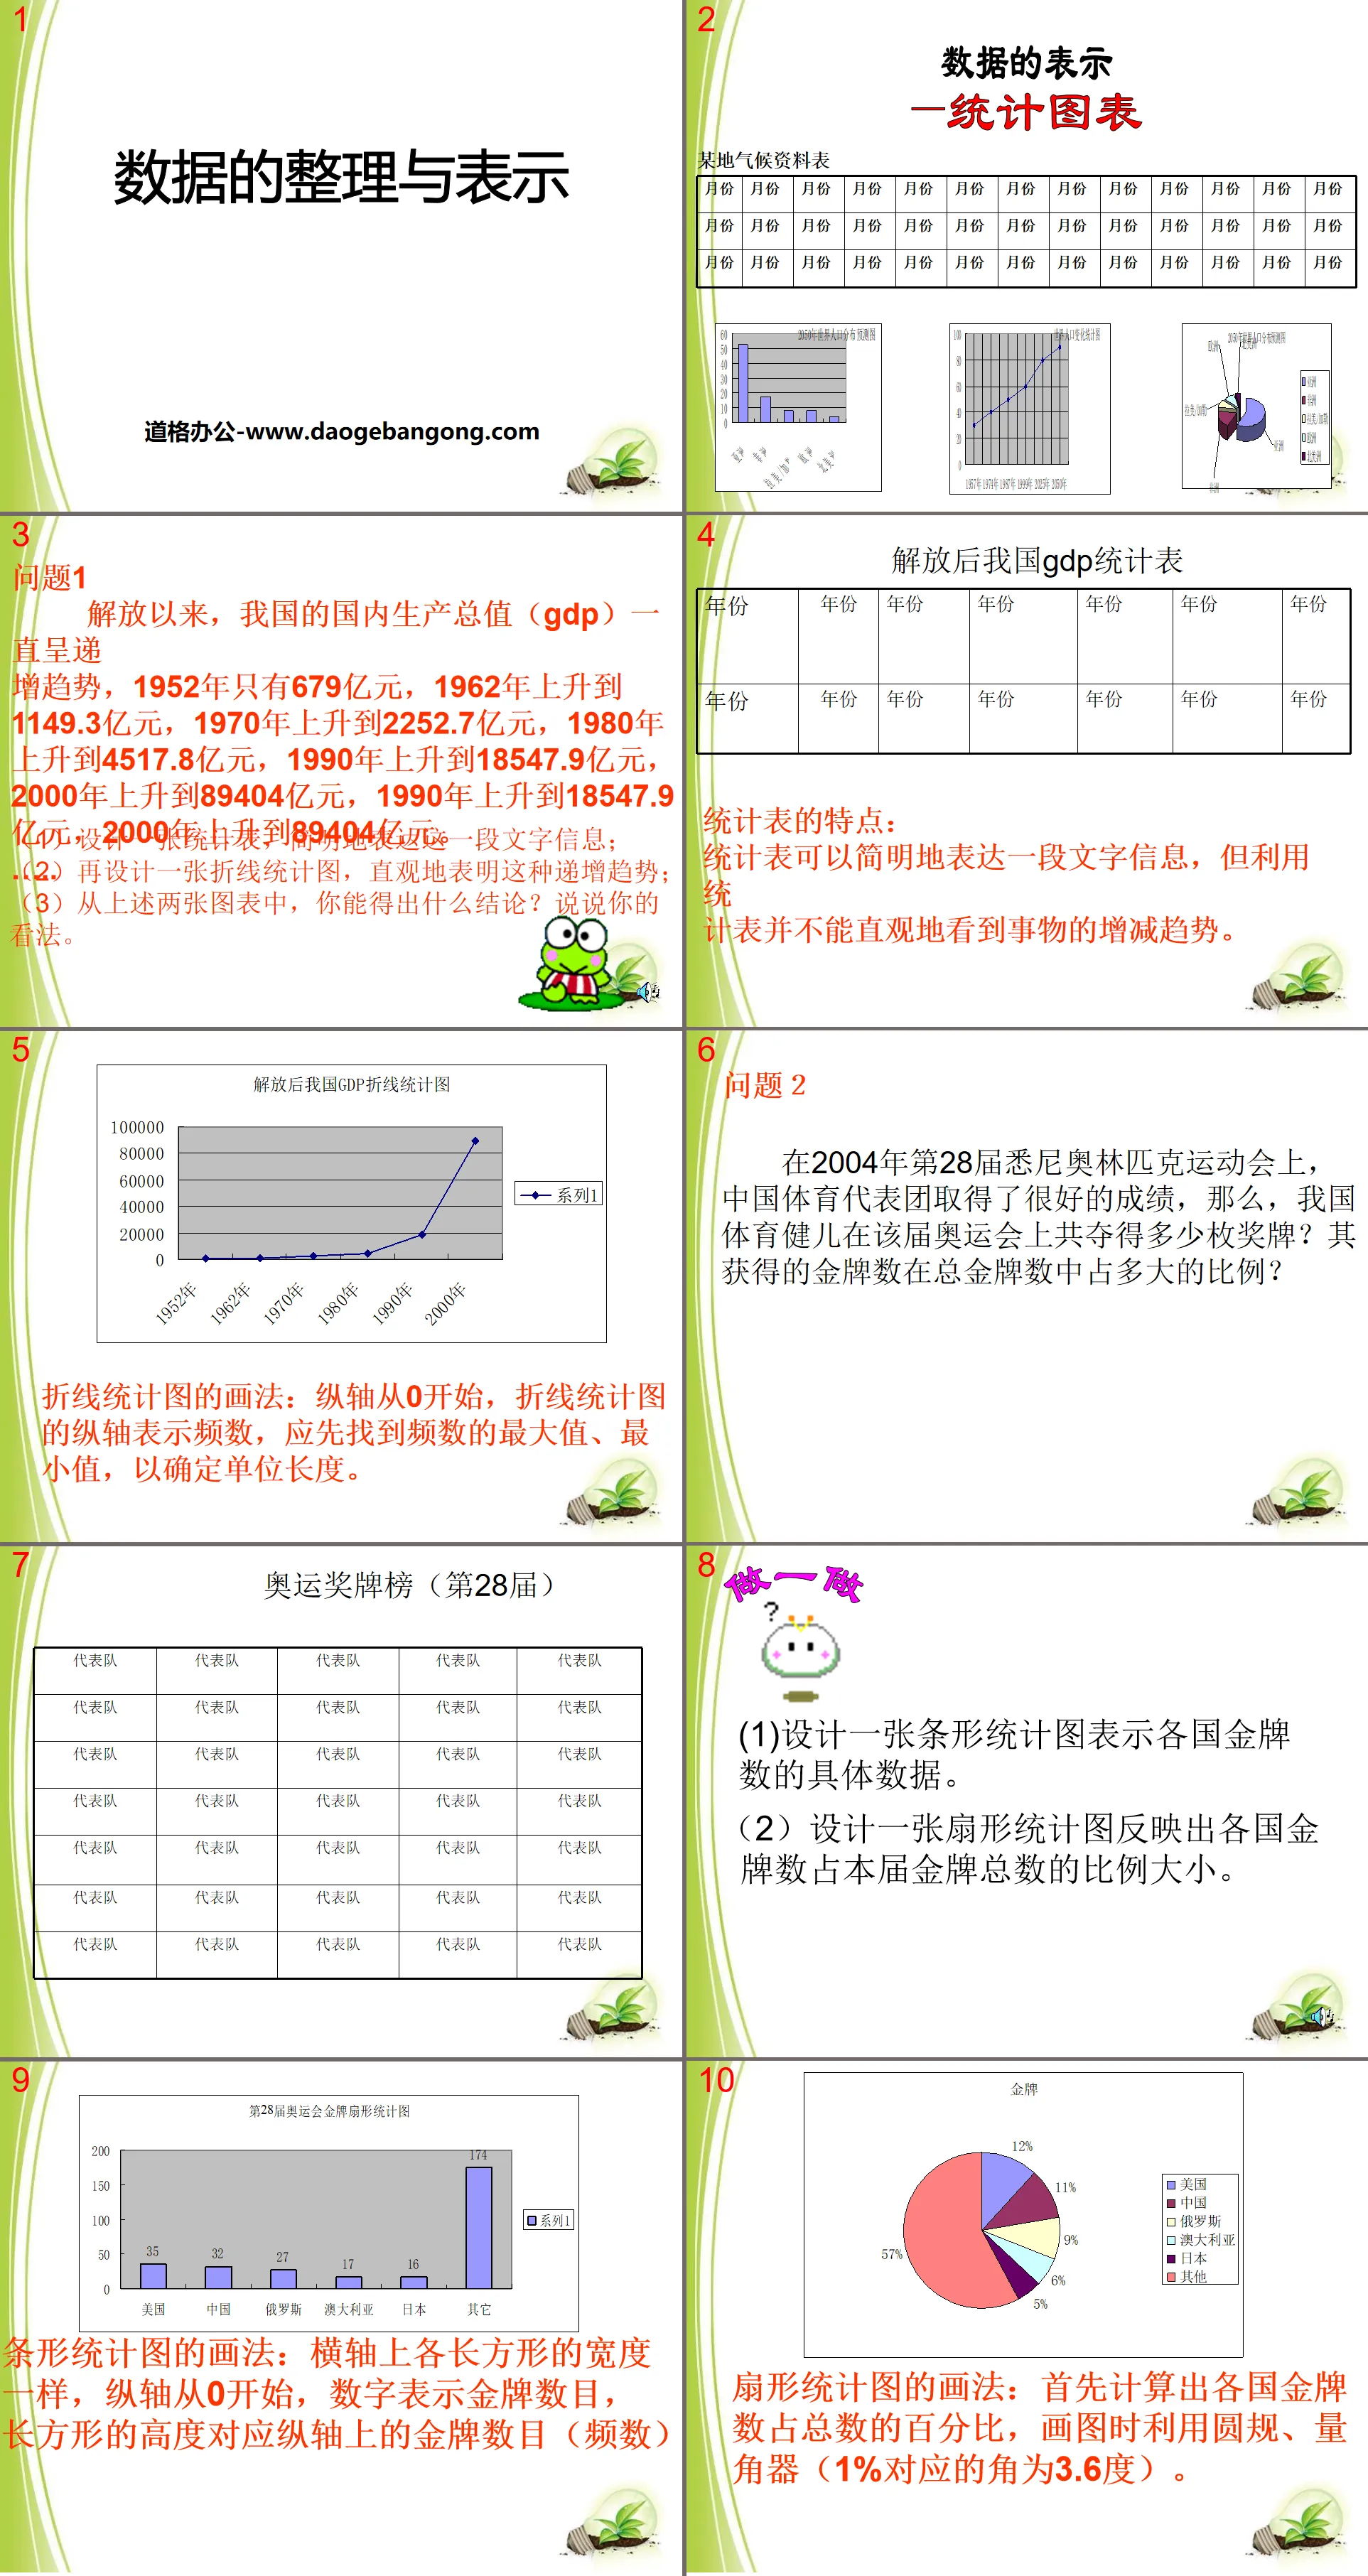
Question 1
Since liberation, my country's gross domestic product (GDP) has been on an increasing trend. It was only 67.9 billion yuan in 1952, rose to 114.93 billion yuan in 1962, rose to 225.27 billion yuan in 1970, rose to 451.78 billion yuan in 1980, and rose to 451.78 billion yuan in 1990. It rose to 1,854.79 billion yuan, 8,940.4 billion yuan in 2000, 1,854.79 billion yuan in 1990, and 8,940.4 billion yuan in 2000.
(1) Design a statistical table to express this piece of text information concisely;
(2) Design another line statistical chart to visually show this increasing trend;
(3) What conclusion can you draw from the above two charts? Give your opinion.
Features of statistical tables:
Statistical tables can express a piece of text information concisely, but statistical tables cannot intuitively see the increase or decrease trends of things.
How to draw a line chart:
The vertical axis starts from 0, and the vertical axis of the line chart represents the frequency. The maximum and minimum values of the frequency should be found first to determine the unit length.
Question 2
At the 28th Sydney Olympic Games in 2004, the Chinese sports delegation achieved very good results. So, how many medals did our athletes win in total at the Olympic Games? What proportion of the total number of gold medals does the number of gold medals it wins account for?
Data organization and presentation PPT, the second part: Do it
(1) Design a bar chart to show the specific data of the number of gold medals in each country.
(2) Design a fan-shaped statistical chart to reflect the proportion of the number of gold medals in each country to the total number of gold medals this year.
How to draw a bar chart: The width of each rectangle on the horizontal axis is the same, the vertical axis starts from 0, the number represents the number of gold medals, and the height of the rectangle corresponds to the number of gold medals (frequency) on the vertical axis.
How to draw a sector chart: First, calculate the percentage of gold medals in each country to the total. Use a compass and a protractor when drawing the chart (the angle corresponding to 1% is 3.6 degrees).
Data organization and presentation PPT, part three: classroom exercises
practice practice 1
Choose an appropriate chart to represent the following data
(1) Statistical table of flower blooming periods
(2) A person was born with a height of 48 cm. The following table is his growth record:
(3) Among my country’s natural disasters, meteorological disasters account for 57%, agricultural disasters account for 20%, earthquake disasters account for 6%, forest biological disasters account for 5%, geological disasters account for 4%, and other disasters account for 3%.
(4) my country's terrestrial vegetation is rich and diverse, including 212 types of coniferous forests, 36 types of bamboo forests, 113 types of shrubs, and 91 types of meadows.
practice practice 2
The following is a line chart of a patient's temperature record
Look at the picture and answer the following questions:
(1) How many hours does the nurse take the patient's temperature?
(2) What is the highest temperature of this patient? What is the minimum temperature?
(3) What was his body temperature at 12:00 on April 8?
(4) During which period of time did his body temperature drop the fastest? Which period of time is more stable?
(5) What does the horizontal dotted line in the picture mean?
(6) Judging from the body temperature, is the patient's condition deteriorating or improving?
Keywords: Free download of Hebei Education Edition mathematics PPT courseware for eighth grade volume 2, PPT download, .PPT format;
For more information about the "Data Collation and Presentation" PPT courseware, please click the "Data Collation and Presentation ppt" tab.
"Data Arrangement and Presentation" PPT:
"Data Arrangement and Presentation" PPT Part One Content: New Lesson Introduction 1. Basic Definitions: 1. Census: A comprehensive survey of the objects under investigation for a certain purpose, called census 2. Overall: The overall name of the objects under investigation for the overall. 3. Individual: Group..
File Info
Update Time: 2024-10-05
This template belongs to Mathematics courseware Hebei Education Edition Eighth Grade Mathematics Volume 2 industry PPT template
"Data Collation and Representation" PPT courseware Simple campus recruitment activity planning plan summary enterprise and institution recruitment publicity lecture PPT template is a general PPT template for business post competition provided by the manuscript PPT, simple campus recruitment activity planning plan summary enterprise and institution recruitment promotion Lecture PPT template, you can edit and modify the text and pictures in the source file by downloading the source file. If you want more exquisite business PPT templates, you can come to grid resource. Doug resource PPT, massive PPT template slide material download, we only make high-quality PPT templates!
Tips: If you open the template and feel that it is not suitable for all your needs, you can search for related content "Data Collation and Representation" PPT courseware is enough.
How to use the Windows system template
Directly decompress the file and use it with office or wps
How to use the Mac system template
Directly decompress the file and use it Office or wps can be used
Related reading
For more detailed PPT-related tutorials and font tutorials, you can view: Click to see
How to create a high-quality technological sense PPT? 4 ways to share the bottom of the box
Notice
Do not download in WeChat, Zhihu, QQ, built-in browsers, please use mobile browsers to download! If you are a mobile phone user, please download it on your computer!
1. The manuscript PPT is only for study and reference, please delete it 24 hours after downloading.
2. If the resource involves your legitimate rights and interests, delete it immediately.
3. Contact information: service@daogebangong.com
"Data Collation and Representation" PPT courseware, due to usage restrictions, it is only for personal study and reference use. For commercial use, please go to the relevant official website for authorization.
(Personal non-commercial use refers to the use of this font to complete the display of personal works, including but not limited to the design of personal papers, resumes, etc.)
Preview
Related Search:
"Data Collation and Representation" PPT courseware
2024-10-05
Copyright statement: This material is compiled and released by the user of Daoge Resources. The copyright belongs to the author. For commercial use, please contact the copyright owner. If there is any infringement, please contact the webmaster to remove the resource.
Download Points: 0.00
Free Download
Upgrade VIP
Favorite
Views: 1732 / Downloads: 124


