| Category | Format | Size |
|---|---|---|
| Hebei Education Edition Eighth Grade Mathematics Volume 2 | pptx | 6 MB |

"Frequency Distribution Table and Histogram" PPT
Description
"Frequency Distribution Table and Histogram" PPT
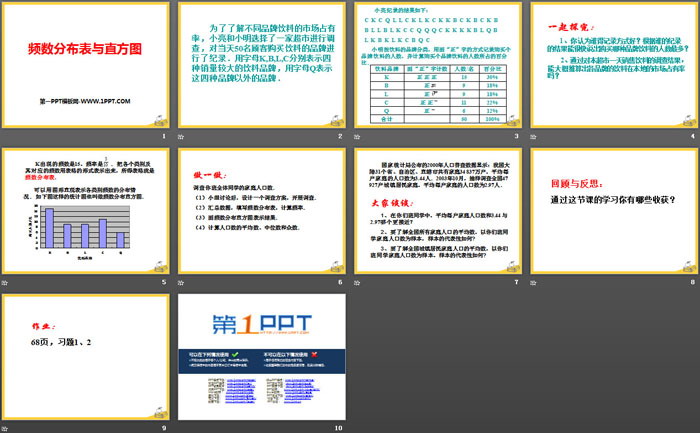
Part One Content: New Lesson Exploration
In order to understand the market share of different brands of beverages, Xiaoliang and Xiaoming chose a supermarket to conduct a survey and recorded the brands of beverages purchased by 50 customers that day. The letters K, B, L, and C are used to represent four beverage brands with large sales volume, and the letter Q is used to represent brands other than these four brands.
Let’s explore together:
1. Who do you think has the best recording method? Based on the results of whose records can you quickly tell which brand of drink has the most people buying it?
2. Based on the survey results of the beverages sold in this supermarket in one day, can we roughly deduce the local market share of each brand of beverages?
Frequency distribution table and histogram PPT, part 2 content: Do it:
Survey the family size of all the students in your class.
(1) After group discussion, design an investigation plan and conduct the investigation.
(2) Summarize the data, fill in the frequency distribution table, and calculate the frequency.
(3) Draw a frequency distribution histogram to represent the results.
(4) Calculate the mean, median and mode of the population.
The 2000 census data released by the National Bureau of Statistics show that there are 348.37 million households in 31 provinces, autonomous regions, and municipalities in mainland my country, with an average population of 3.44 people per household. In October 2003, a sample survey of 47,927 urban households across the country found that the average number of people per household was 2.97.
Let’s talk about:
1. Among the students in your class, which one is closer to the average family size: 3.44 or 2.97?
2. To understand the average population of all households in the country, take the household population of your classmates as a sample. How representative is the sample?
3. To understand the average family size of urban residents across the country, take the family size of your classmates as a sample. How representative is the sample?
Keywords: Free download of Hebei Education Edition mathematics PPT courseware for eighth grade volume 2, frequency distribution table and histogram PPT download, .PPT format;
For more information about the "Frequency Distribution Table and Histogram" PPT courseware, please click the Frequency Distribution Table and Histogram ppt tab.
"Frequency Distribution Table and Histogram" PPT download:
"Frequency Distribution Table and Histogram" PPT Download Part One Content: Review Do you still remember the characteristics of each statistical chart: Bar chart can clearly show the specific number of each item. Line chart can clearly reflect changes in things. situation. Sector..
"Frequency Distribution Table and Histogram" PPT courseware:
"Frequency Distribution Table and Histogram" PPT courseware Part One: Preparation before class Questionnaire: Books are the ladder of human progress. What kind of books do students like to read most after class? A. Literature ( ) B. Comics ( ) C. Popular science ( ) D. History ( ..
File Info
Update Time: 2024-07-02
This template belongs to Mathematics courseware Hebei Education Edition Eighth Grade Mathematics Volume 2 industry PPT template
"Frequency Distribution Table and Histogram" PPT Simple campus recruitment activity planning plan summary enterprise and institution recruitment publicity lecture PPT template is a general PPT template for business post competition provided by the manuscript PPT, simple campus recruitment activity planning plan summary enterprise and institution recruitment promotion Lecture PPT template, you can edit and modify the text and pictures in the source file by downloading the source file. If you want more exquisite business PPT templates, you can come to grid resource. Doug resource PPT, massive PPT template slide material download, we only make high-quality PPT templates!
Tips: If you open the template and feel that it is not suitable for all your needs, you can search for related content "Frequency Distribution Table and Histogram" PPT is enough.
How to use the Windows system template
Directly decompress the file and use it with office or wps
How to use the Mac system template
Directly decompress the file and use it Office or wps can be used
Related reading
For more detailed PPT-related tutorials and font tutorials, you can view: Click to see
How to create a high-quality technological sense PPT? 4 ways to share the bottom of the box
Notice
Do not download in WeChat, Zhihu, QQ, built-in browsers, please use mobile browsers to download! If you are a mobile phone user, please download it on your computer!
1. The manuscript PPT is only for study and reference, please delete it 24 hours after downloading.
2. If the resource involves your legitimate rights and interests, delete it immediately.
3. Contact information: service@daogebangong.com
"Frequency Distribution Table and Histogram" PPT, due to usage restrictions, it is only for personal study and reference use. For commercial use, please go to the relevant official website for authorization.
(Personal non-commercial use refers to the use of this font to complete the display of personal works, including but not limited to the design of personal papers, resumes, etc.)
Preview
Related Search: