Western Normal University Edition First Grade Mathematics Volume 1
Beijing Normal University Edition Seventh Grade Mathematics Volume 1
People's Education Press First Grade Mathematics Volume 1
People's Education Press Second Grade Mathematics Volume 1
Beijing Normal University Edition Seventh Grade Mathematics Volume 2
People's Education Press Third Grade Mathematics Volume 1
Beijing Normal University Edition Eighth Grade Mathematics Volume 1
Qingdao Edition Seventh Grade Mathematics Volume 1
Beijing Normal University Edition Fifth Grade Mathematics Volume 1
Hebei Education Edition Third Grade Mathematics Volume 1
Hebei Education Edition Seventh Grade Mathematics Volume 2
People's Education Press First Grade Mathematics Volume 2
People's Education High School Mathematics Edition B Compulsory Course 2
Qingdao Edition Seventh Grade Mathematics Volume 2
Beijing Normal University Edition Fifth Grade Mathematics Volume 2
Hebei Education Edition Fourth Grade Mathematics Volume 2

| Category | Format | Size |
|---|---|---|
| Hebei Education Edition Eighth Grade Mathematics Volume 2 | pptx | 6 MB |
Description
"The Image and Properties of a Linear Function" PPT
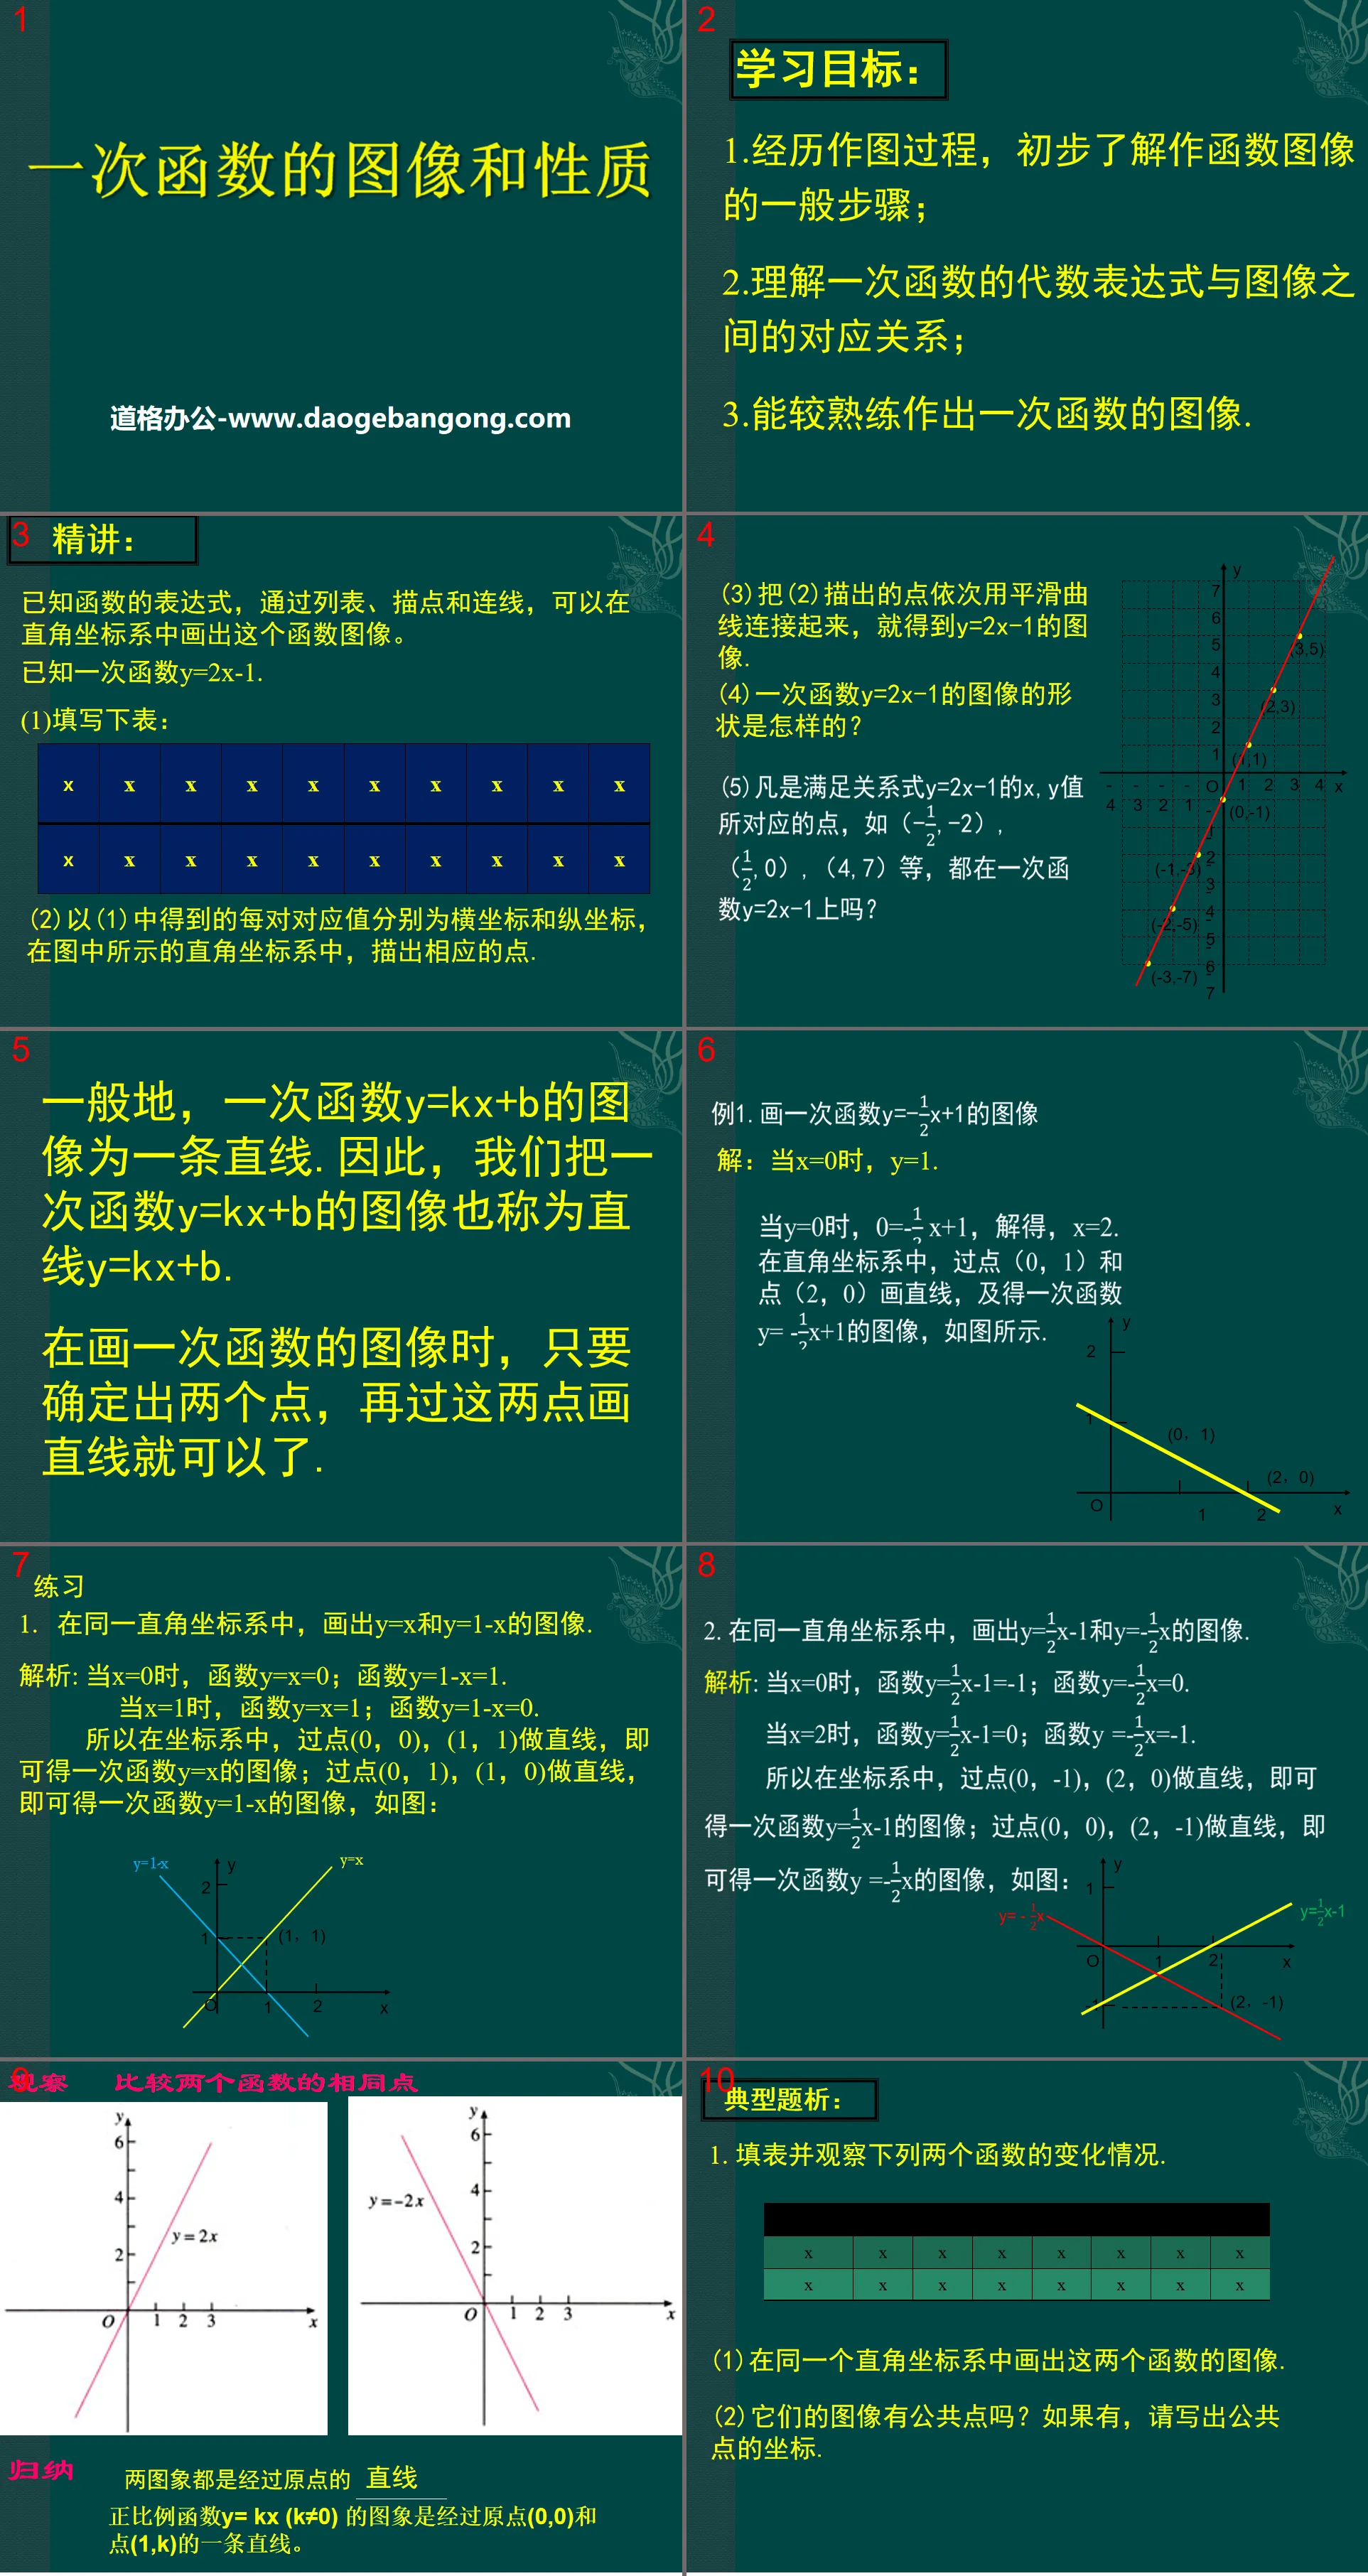
Part One Content: Learning Objectives:
1. Experience the drawing process and have a preliminary understanding of the general steps of drawing function images;
2. Understand the correspondence between the algebraic expression of a linear function and the image;
3. Be able to make graphs of linear functions more skillfully.
Focus on:
Given the expression of a known function, the image of the function can be drawn in the Cartesian coordinate system through lists, plotted points and connecting lines.
It is known that the linear function y=2x-1.
(1) Fill in the following table:
(2) Taking each pair of corresponding values obtained in (1) as the abscissa and ordinate respectively, draw the corresponding points in the rectangular coordinate system shown in the figure.
(3) Connect the points described in (2) with smooth curves in sequence to obtain the image of y=2x-1.
(4) What is the shape of the image of the linear function y=2x-1?
PPT on the image and properties of a linear function, Part 2: Classroom exercises
Generally, the image of a linear function y=kx+b is a straight line. Therefore, we also call the image of a linear function y=kx+b a straight line y=kx+b.
When drawing the graph of a linear function, you only need to identify two points and draw a straight line through these two points.
practise
1. In the same rectangular coordinate system, draw the images of y=x and y=1-x.
Analysis: When x=0, function y=x=0; function y=1-x=1.
When x=1, function y=x=1; function y=1-x=0.
Therefore, in the coordinate system, by drawing a straight line through the points (0, 0) and (1, 1), the image of the linear function y=x can be obtained;
By drawing a straight line through the points (0, 1) and (1, 0), you can get the image of the linear function y=1-x, as shown in the figure:
The image and properties of a linear function PPT, the third part: analysis of typical questions:
1. Fill in the table and observe the changes of the following two functions.
(1) Draw the graphs of these two functions in the same rectangular coordinate system.
(2) Do their images have anything in common? If so, please write the coordinates of the common point.
Analysis:
(1) The function image of y=-5x+2 passes through the points (0, 2), (1, -3), and a straight line is drawn through these two points, which is the function image of y=-5x+2;
The function image of y=x-10 passes through the point (0,-10),
(2,-8), draw a straight line through these two points, which is the function image of y=-5x+2.
(2) It can be seen from the figure that these two function images have a common point. It can be seen from the table that the coordinates of their common point are (2,-8)
(Or combine these two functions, let -5x+2=x-10, and solve to get x=2, y=x-10=-8).
2. There is a spring today. The length when no weight is suspended is 12cm. Every time the suspended weight increases by 1kg (the weight does not exceed 8kg), the length of the spring increases by 0.5cm. Write the length of the spring y (cm) and the length of the suspension. The functional relationship between the mass x (kg) of the object, indicate the value range of the independent variable, and draw the image of this function.
The value range of the independent variable x is: 0≤x≤8. The function image is as shown:
The image and properties of a linear function PPT, the fourth part: content analysis
Generally, we have:
For a linear function y=kx+b (k, b are constants, and k≠0):
When k>0, the value of y increases as the value of x increases;
When k<0, the value of y decreases as the value of x increases.
Which functions intersect the y-axis above the x-axis, and which functions intersect the y-axis below the x-axis?
The intersection point of the graph of the function and the y-axis is above the x-axis, and the intersection point of the graph of the function and the y-axis is below the x-axis. How are the differences between these two functions related to the constant terms?
Which point must the graph of the proportional function pass through?
In fact, the image of the linear function y=kx+b is a straight line passing through the point (0, b) on the y-axis. When b>0, the point (0, b) is above the x-axis; when b<0 When , point (0, b) is below the x-axis; when b = 0, point (0, 0) is the origin, that is, the image of the proportional function y = kx is a straight line passing through the origin.
PPT on the image and properties of a linear function, part 5: analysis of examples
Example 1. It is known that the linear function y=(2k-1)x+(2k+1) about x is known.
(1) When k satisfies what conditions, the value of function y increases as the value of x increases?
(2) When k satisfies what conditions, the image of y=(2k-1)x+(2k+1) passes through the origin?
(3) When k satisfies what conditions, the intersection point of the image of function y=(2k-1)x+(2k+1) and the y-axis is below the x-axis?
(4) When k satisfies what conditions, the value of function y decreases as the value of x increases and the intersection of the function image and the y-axis is above the x-axis?
Analysis:
(1) When 2k-1>0, the value of y increases as the value of x increases.
Solving 2k-1>0, we get: k>0.5.
(2) When 2k+1=0, that is, k=-0.5, the image of the function y=(2k-1)x+(2k+1) passes through the origin.
(3) When 2k+1<0, the intersection of the image of function y=(2k-1)x+(2k+1) and the y-axis is below the x-axis.
Solving 2k+1<0, we get k<-0.5.
(4) When 2k-1 <0, the value of y decreases as the value of x increases. The solution is: k <0.5.
When 2k+1>0, the intersection of the graph of function y=(2k-1)x+(2k+1) and the y-axis is above the x-axis. The solution is k>-0.5.
So the value range of k at this time is (-0.5, 0.5).
PPT on the image and properties of a linear function, part six: summary:
1. The image of the linear function y=kx+b is a straight line, so its image is also called the straight line y=kx+b.
2. The coefficients k and b in the linear function y=kx+b determine its properties:
(1) When k>0, y increases with the increase of x, and the image rises from left to right.
(2) When k<0, y decreases as x increases, and the image decreases from left to right.
(3) When b=0, the linear function y=kx+b is a proportional function y=kx, and its image must pass through the origin.
(4) When b≠0, the straight line y=kx+b must not pass through the origin.
Keywords: Free download of Hebei Education Edition mathematics PPT courseware for eighth grade volume 2, PPT download of images and properties of linear functions, .PPT format;
For more information about the "Image and Properties of a linear function" PPT courseware, please click the "Image and Properties of a linear function ppt" tag.
Download the PPT courseware of "The Image and Properties of a Linear Function":
"The Image and Properties of a Linear Function" PPT courseware download part one content: The image of a function takes the values of the independent variable x and the corresponding dependent variable y of a function as the abscissa and ordinate of the point respectively, and depicts them in the rectangular coordinate system Its corresponding points, all these point groups..
"Image and Properties of a Linear Function" PPT download:
"Image and Properties of a linear function" PPT download Part 1: Learning objectives 1. Master the drawing method of the image of a linear function, and get a preliminary feel for its image. 2. Further understand the concepts and images of proportional functions and linear functions in the comparison of special and general key points..
"The Image and Properties of a Linear Function" PPT courseware:
"The Image and Properties of a linear function" PPT courseware Part 1: Exploration 1. Are the points (x, y) corresponding to x and y that satisfy the relationship y= -2x+5 all on the image of a linear function? The points (x, y) corresponding to x and y that satisfy the relationship are all on the image. 2..
File Info
Update Time: 2024-11-25
This template belongs to Mathematics courseware Hebei Education Edition Eighth Grade Mathematics Volume 2 industry PPT template
"The Image and Properties of a Linear Function" PPT Simple campus recruitment activity planning plan summary enterprise and institution recruitment publicity lecture PPT template is a general PPT template for business post competition provided by the manuscript PPT, simple campus recruitment activity planning plan summary enterprise and institution recruitment promotion Lecture PPT template, you can edit and modify the text and pictures in the source file by downloading the source file. If you want more exquisite business PPT templates, you can come to grid resource. Doug resource PPT, massive PPT template slide material download, we only make high-quality PPT templates!
Tips: If you open the template and feel that it is not suitable for all your needs, you can search for related content "The Image and Properties of a Linear Function" PPT is enough.
How to use the Windows system template
Directly decompress the file and use it with office or wps
How to use the Mac system template
Directly decompress the file and use it Office or wps can be used
Related reading
For more detailed PPT-related tutorials and font tutorials, you can view: Click to see
How to create a high-quality technological sense PPT? 4 ways to share the bottom of the box
Notice
Do not download in WeChat, Zhihu, QQ, built-in browsers, please use mobile browsers to download! If you are a mobile phone user, please download it on your computer!
1. The manuscript PPT is only for study and reference, please delete it 24 hours after downloading.
2. If the resource involves your legitimate rights and interests, delete it immediately.
3. Contact information: service@daogebangong.com
"The Image and Properties of a Linear Function" PPT, due to usage restrictions, it is only for personal study and reference use. For commercial use, please go to the relevant official website for authorization.
(Personal non-commercial use refers to the use of this font to complete the display of personal works, including but not limited to the design of personal papers, resumes, etc.)
Preview


