Western Normal University Edition First Grade Mathematics Volume 1
Beijing Normal University Edition Seventh Grade Mathematics Volume 1
People's Education Press First Grade Mathematics Volume 1
People's Education Press Second Grade Mathematics Volume 1
Beijing Normal University Edition Seventh Grade Mathematics Volume 2
People's Education Press Third Grade Mathematics Volume 1
Beijing Normal University Edition Eighth Grade Mathematics Volume 1
Qingdao Edition Seventh Grade Mathematics Volume 1
Beijing Normal University Edition Fifth Grade Mathematics Volume 1
Hebei Education Edition Third Grade Mathematics Volume 1
Hebei Education Edition Seventh Grade Mathematics Volume 2
People's Education Press First Grade Mathematics Volume 2
People's Education High School Mathematics Edition B Compulsory Course 2
Qingdao Edition Seventh Grade Mathematics Volume 2
Beijing Normal University Edition Fifth Grade Mathematics Volume 2
Hebei Education Edition Fourth Grade Mathematics Volume 2

| Category | Format | Size |
|---|---|---|
| Beijing Normal University seventh grade mathematics volume 2 | pptx | 6 MB |
Description
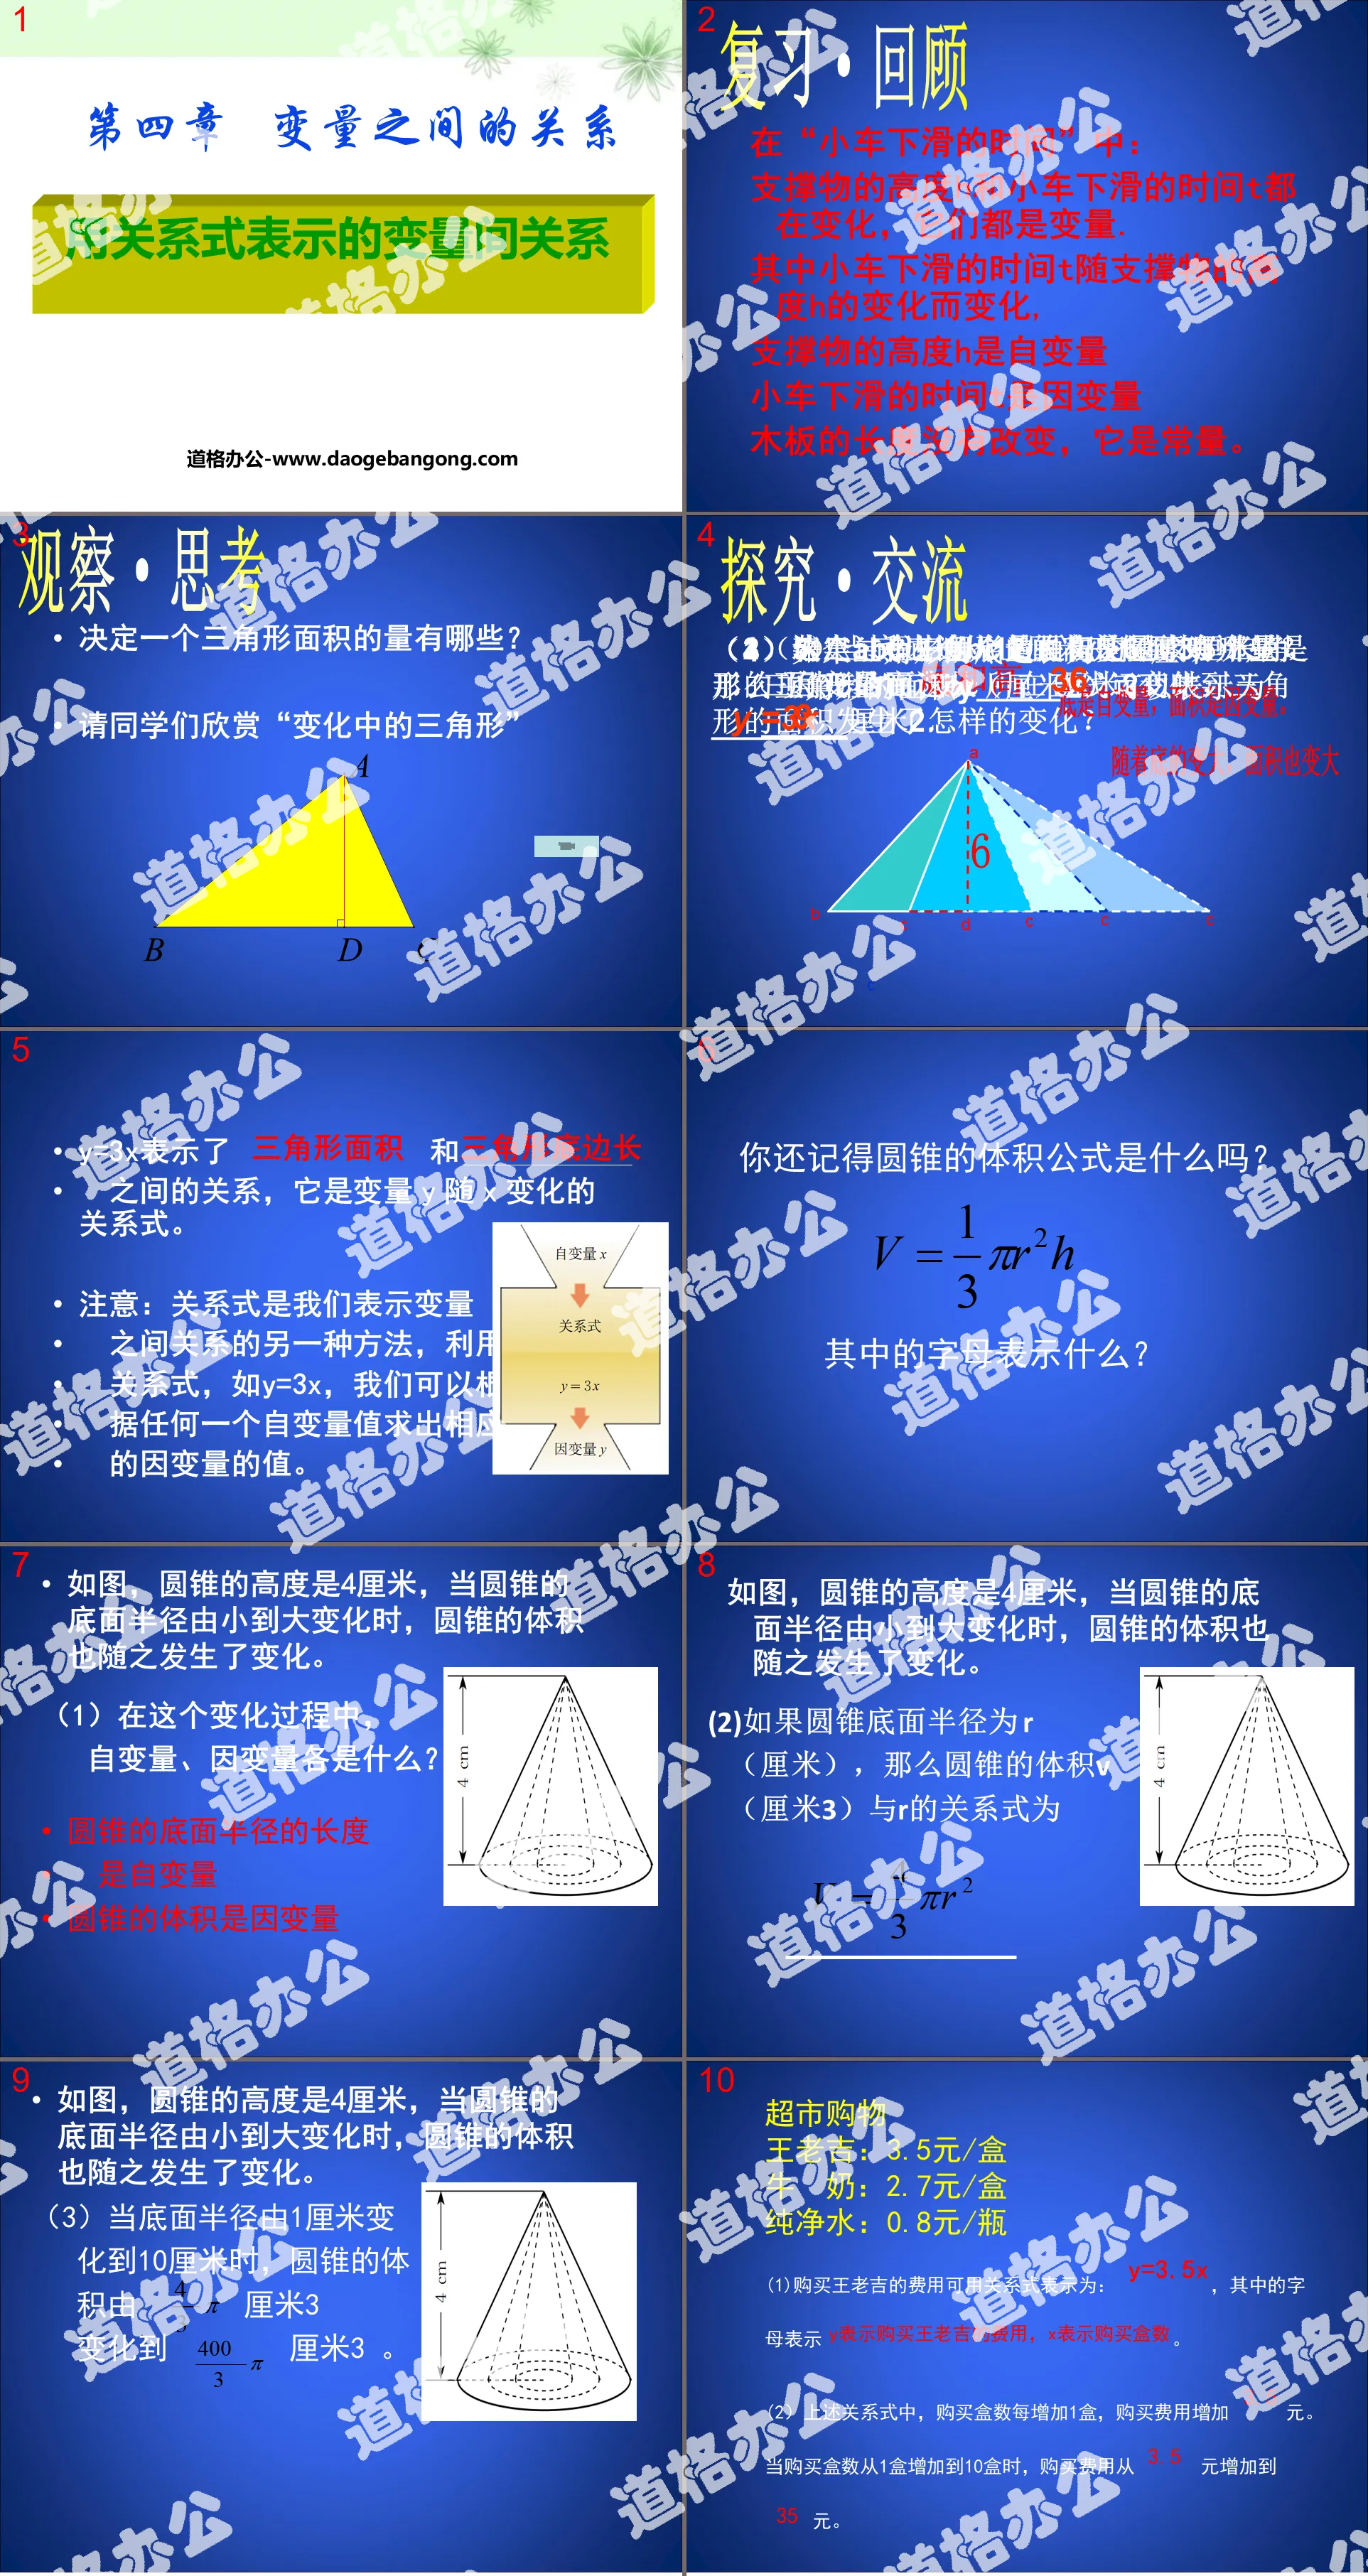
"Relationships between variables represented by relational expressions" PPT courseware on the relationship between variables
Review·Review
In the "time for the car to slide down": the height h of the support and the time t for the car to slide down are both changing, and they are both variables.
The time t for the car to slide down changes with the change of the height h of the support.
The height h of the support is the independent variable
The time t for the car to slide down is the dependent variable
The length of the board does not change, it is constant.
y=3x represents the relationship between the area of the triangle and the length of the base of the triangle. It is the relationship between the variable y and the change of x.
Note: The relational expression is another way for us to express the relationship between variables. Using the relational expression, such as y=3x, we can find the value of the corresponding dependent variable based on the value of any independent variable.
As shown in the figure, the height of the cone is 4 cm. When the radius of the base of the cone changes from small to large, the volume of the cone also changes.
(1) In this change process, what are the independent variables and the dependent variables?
The length of the base radius of the cone is the independent variable
The volume of the cone is the dependent variable
(2) If the radius of the base of the cone is r (cm), then the relationship between the volume of the cone V (cm3) and r is:
(3) When the radius of the base changes from 1 cm to 10 cm, the volume of the cone changes from ____ cm3 to ____ cm3.
Cooperation and exchange
Discuss:
Do you know what "low-carbon life" is? "Low-carbon life" refers to a way to minimize the energy consumed in people's lives, thereby reducing carbon, especially carbon dioxide emissions.
Discuss:
(1) The carbon dioxide emissions from household electricity use can be expressed as ___ __ __, where the letters represent ____________.
(2) In the above relationship, for every 1 KW·h increase in power consumption, carbon dioxide emissions increase _______. When electricity consumption increases from 1 KW·h to 100 KW·h, carbon dioxide emissions increase from _______ to _____________.
(3) Xiao Ming’s home consumes approximately 110 KW h of electricity, 20 m3 of natural gas, 5 t of tap water, and 75 L of fuel consumption this month. Please calculate the carbon dioxide emissions of these items.
summary
1. How many methods have we learned so far to express the relationship between independent variables and dependent variables?
Two methods: column table and column relational expression
2. What are the characteristics of lists and column relations expressing the relationship between variables?
Through the column table, the change of the dependent variable as the independent variable changes can be expressed more intuitively.
Using the relationship, we can find the value of the corresponding dependent variable based on the value of an independent variable.
3. What did the students gain from this class?
Keywords: teaching courseware on the relationship between variables, teaching courseware on the relationship between variables represented by relational expressions, Beijing Normal University edition seventh grade mathematics volume 2 PPT courseware, seventh grade mathematics slide courseware download, relationship between variables PPT courseware download , PPT courseware download of the relationship between variables represented by relational expressions, .ppt format
For more information about the PPT courseware "The relationship between variables expressed by relational expressions" PPT courseware, please click the "Relationships between variables ppt relationship between variables expressed by relational expressions" ppt tag.
"Relationships between variables represented by relational expressions" PPT courseware 4 on the relationship between variables:
"Relationships between variables represented by relational expressions" Relationship between variables PPT courseware 4 Review and thinking In the time experiment of the car sliding down: the height h of the support and the time t for the car sliding down are both changing, and they are both variables. Among them, the time t when the car slides down depends on the support..
"Relationships between variables represented by relational expressions" PPT courseware 3 on the relationship between variables:
"Relationships Between Variables Expressed by Relational Expressions" PPT courseware on the relationship between variables 3 Build a model and explore new knowledge As shown in the figure, the height of BC on the bottom of △ABC is 6 cm. When the vertex C of the triangle moves toward point B along the straight line where the base lies, the area of the triangle changes. ..
"Relationships between variables represented by relational expressions" PPT courseware 2 on the relationship between variables:
"Relationships between variables expressed by relational expressions" Relationship between variables PPT courseware 2 Situation introduction The base of △ABC BC = aThe height of the side of BC is h. If y is used to represent the area of the triangle, then the area y =____________. Determine a What factors determine the area of a triangle?
File Info
Update Time: 2024-11-18
This template belongs to Mathematics courseware Beijing Normal University seventh grade mathematics volume 2 industry PPT template
"Relationships between variables represented by relational expressions" PPT courseware on the relationship between variables Simple campus recruitment activity planning plan summary enterprise and institution recruitment publicity lecture PPT template is a general PPT template for business post competition provided by the manuscript PPT, simple campus recruitment activity planning plan summary enterprise and institution recruitment promotion Lecture PPT template, you can edit and modify the text and pictures in the source file by downloading the source file. If you want more exquisite business PPT templates, you can come to grid resource. Doug resource PPT, massive PPT template slide material download, we only make high-quality PPT templates!
Tips: If you open the template and feel that it is not suitable for all your needs, you can search for related content "Relationships between variables represented by relational expressions" PPT courseware on the relationship between variables is enough.
How to use the Windows system template
Directly decompress the file and use it with office or wps
How to use the Mac system template
Directly decompress the file and use it Office or wps can be used
Related reading
For more detailed PPT-related tutorials and font tutorials, you can view: Click to see
How to create a high-quality technological sense PPT? 4 ways to share the bottom of the box
Notice
Do not download in WeChat, Zhihu, QQ, built-in browsers, please use mobile browsers to download! If you are a mobile phone user, please download it on your computer!
1. The manuscript PPT is only for study and reference, please delete it 24 hours after downloading.
2. If the resource involves your legitimate rights and interests, delete it immediately.
3. Contact information: service@daogebangong.com
"Relationships between variables represented by relational expressions" PPT courseware on the relationship between variables, due to usage restrictions, it is only for personal study and reference use. For commercial use, please go to the relevant official website for authorization.
(Personal non-commercial use refers to the use of this font to complete the display of personal works, including but not limited to the design of personal papers, resumes, etc.)
Preview


