Western Normal University Edition First Grade Mathematics Volume 1
People's Education Press First Grade Mathematics Volume 1
Beijing Normal University Edition Seventh Grade Mathematics Volume 1
People's Education Press Third Grade Mathematics Volume 1
People's Education Press Second Grade Mathematics Volume 1
Beijing Normal University Edition Fifth Grade Mathematics Volume 1
Hebei Education Edition Third Grade Mathematics Volume 1
Hebei Education Edition Seventh Grade Mathematics Volume 2
Beijing Normal University Edition Seventh Grade Mathematics Volume 2
Qingdao Edition Seventh Grade Mathematics Volume 1
People's Education High School Mathematics Edition B Compulsory Course 2
Jiangsu Education Edition Fourth Grade Mathematics Volume 1
Qingdao Edition Seventh Grade Mathematics Volume 2
Qingdao Edition Second Grade Mathematics Volume 2
Beijing Normal University Edition Fifth Grade Mathematics Volume 2
People's Education Press First Grade Mathematics Volume 2
| Category | Format | Size |
|---|---|---|
| Qingdao Edition Eighth Grade Mathematics Volume 1 | pptx | 6 MB |

"Modality" PPT courseware 2
2024-08-13
Copyright statement: This material is compiled and released by the user of Daoge Resources. The copyright belongs to the author. For commercial use, please contact the copyright owner. If there is any infringement, please contact the webmaster to remove the resource.
Download Points: 0.00
Free Download
Upgrade VIP
Favorite
Views: 1102 / Downloads: 401
Description
"Modality" PPT courseware 2
Define learning
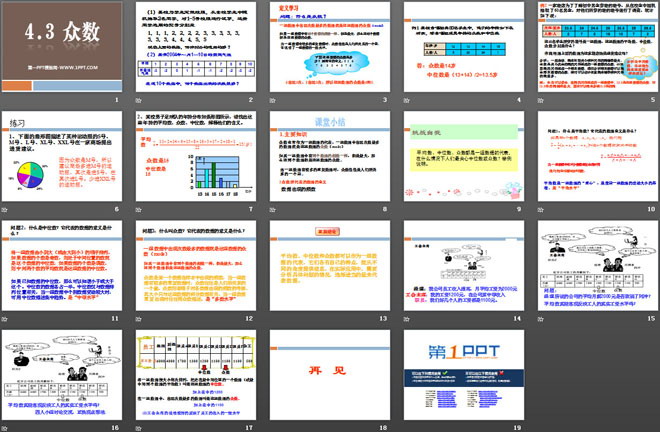
Question: What is mode?
The data that appears most frequently in a set of data is the mode of the set of data.
If there are two data in a set of data with the same frequency, both of which are the largest, then these two data are the mode of the set of data.
When a set of data has many repeated data, the mode is often a quantity that people are concerned with, and it illustrates the general level of a set of data.
What is the mode of the following set of data? Explain its meaning. 5 2 6 7 6 3 3 4 3 7 6
6 appears 3 times and 3 appears 3 times, so the modes of this set of data are 6 and 3.
Example 1 Among the 50 students in a school choir, their ages are as shown in the table below. The mode and median age of the choir members are as follows:
Answer: The mode is 14 years old
The median is (13+14)/2=13.5 years old
Example 2 In order to find out the shoe sizes worn by junior high school boys, a shoe store randomly selected 60 boys from the school students and conducted a survey on the shoe sizes they wore. The statistics are as follows:
The shoe sizes worn by these 60 students are a set of data. What are the mean, median, and mode of this set of data?
Can you provide stocking suggestions for this shoe store based on the data above?
Analysis: Generally speaking, shoe stores are more concerned about which size of shoes sells the most, that is, they are concerned about the mode of a set of data composed of the sizes of the shoes sold. The sizes of 60 pairs of men's shoes form a sample data. By analyzing the sample The data can find the mode of the sample data, and then estimate which size of shoes the shoe store sells the most.
Solution: It can be seen from the table that in a set of data consisting of shoe sizes, 25.5 is the mode of this set of data, that is, shoes of size 25.5 have the largest sales volume, so the shoe store can buy more shoes of size 25.5
Class summary
1. Main knowledge
The mode is often used as a representative of a set of data. The data that appears most frequently in a set of data is the mode of the set of data.
If there are two data in a set of data with the same frequency, both of which are the largest, then these two data are the mode of the set of data.
When a set of data has a lot of repeated data, the mode is often a quantity that people relate to.
2. The meaning of the data represented by the mode
frequency of occurrence of data
Question 1: What is the average? What is the meaning of the data it represents?
Used when there are many repeated data in a set of data
We call it the weighted average.
The average is the "center of gravity" of a set of data and a benchmark for measuring the fluctuation of a set of data. is "average"
Question 2: What is the median? What is the meaning of the data it represents?
Arrange a set of data in order from small to large (or large to small). If the number of data is an odd number, the number in the middle is the median of the data. If the number of data is an even number, then The average of the middle two numbers is the median of this set of data.
If you know the median of your data, you can tell if it's less than or greater than this. The median data is half and half. The median is only related to the arrangement position of the data. When individual data in a set of data vary greatly, the median can be used to describe the central tendency. is "medium level"
Question 3: What is the mode? What is the meaning of the data it represents?
The data that appears most frequently in a set of data is the mode of the set of data.
If there are two data in a set of data with the same frequency, both of which are the largest, then these two data are the mode of the set of data.
The mode is the frequency with which a certain data appears in a sample. When a set of data has a lot of repeated data, the mode is often a quantity that people are concerned with. The mode focuses on the examination of the frequency of occurrence of each data. Its size is only related to part of the data in this set of data. When a set of data appears repeatedly, the mode is often used to describe it. is "majority level"
Important conclusions
The average, median and mode can all be used as representatives of a set of data. They each have their own characteristics and can provide information from different perspectives. In practical applications, it is necessary to analyze the situation of specific problems and choose appropriate quantities. represents data.
Keywords: Mode teaching courseware, Qingdao edition eighth grade mathematics volume PPT courseware download, eighth grade mathematics slide courseware download, mode PPT courseware download, .PPT format;
For more information about the "Modality" PPT courseware, please click on the "Modality" ppt tab.
"Median and Mode" PPT:
"Median and Mode" PPT Part One Content: Teaching Objectives 1. Understand and be able to find the median and mode of a set of data in actual situations. 2. According to specific problems, be able to select appropriate statistical tables to represent different characteristics of the data. 3. Feel statistics in life..
"Median and Mode" PPT Courseware 2:
"Median and Mode" PPT Courseware 2 The average, median and mode can all be used as representatives of a set of data. They each have their own characteristics and can provide information from different angles. The average is obtained through calculation, using the information of all the data, and is a practical question...
"Median and Mode" PPT courseware:
"Median and Mode" PPT courseware 1. Arrange n pieces of data in order from small to large (or from large to small). If n is an odd number, then the number at the _______ position is called the median of this set of data; if n is an even number, then the number in the middle position is the median of the set of data. _____ of data..
File Info
Update Time: 2024-08-13
This template belongs to Mathematics courseware Qingdao Edition Eighth Grade Mathematics Volume 1 industry PPT template
"Modality" PPT courseware 2 Simple campus recruitment activity planning plan summary enterprise and institution recruitment publicity lecture PPT template is a general PPT template for business post competition provided by the manuscript PPT, simple campus recruitment activity planning plan summary enterprise and institution recruitment promotion Lecture PPT template, you can edit and modify the text and pictures in the source file by downloading the source file. If you want more exquisite business PPT templates, you can come to grid resource. Doug resource PPT, massive PPT template slide material download, we only make high-quality PPT templates!
Tips: If you open the template and feel that it is not suitable for all your needs, you can search for related content "Modality" PPT courseware 2 is enough.
How to use the Windows system template
Directly decompress the file and use it with office or wps
How to use the Mac system template
Directly decompress the file and use it Office or wps can be used
Related reading
For more detailed PPT-related tutorials and font tutorials, you can view: Click to see
How to create a high-quality technological sense PPT? 4 ways to share the bottom of the box
Notice
Do not download in WeChat, Zhihu, QQ, built-in browsers, please use mobile browsers to download! If you are a mobile phone user, please download it on your computer!
1. The manuscript PPT is only for study and reference, please delete it 24 hours after downloading.
2. If the resource involves your legitimate rights and interests, delete it immediately.
3. Contact information: service@daogebangong.com
"Modality" PPT courseware 2, due to usage restrictions, it is only for personal study and reference use. For commercial use, please go to the relevant official website for authorization.
(Personal non-commercial use refers to the use of this font to complete the display of personal works, including but not limited to the design of personal papers, resumes, etc.)
Preview
Related Search:
"Modality" PPT courseware 2
2024-08-13
Copyright statement: This material is compiled and released by the user of Daoge Resources. The copyright belongs to the author. For commercial use, please contact the copyright owner. If there is any infringement, please contact the webmaster to remove the resource.
Download Points: 0.00
Free Download
Upgrade VIP
Favorite
Views: 1102 / Downloads: 401


