Western Normal University Edition First Grade Mathematics Volume 1
Beijing Normal University Edition Seventh Grade Mathematics Volume 1
People's Education Press First Grade Mathematics Volume 1
People's Education Press Second Grade Mathematics Volume 1
Beijing Normal University Edition Seventh Grade Mathematics Volume 2
People's Education Press Third Grade Mathematics Volume 1
Beijing Normal University Edition Eighth Grade Mathematics Volume 1
Qingdao Edition Seventh Grade Mathematics Volume 1
Beijing Normal University Edition Fifth Grade Mathematics Volume 1
Hebei Education Edition Third Grade Mathematics Volume 1
Hebei Education Edition Seventh Grade Mathematics Volume 2
People's Education Press First Grade Mathematics Volume 2
People's Education High School Mathematics Edition B Compulsory Course 2
Qingdao Edition Seventh Grade Mathematics Volume 2
Beijing Normal University Edition Fifth Grade Mathematics Volume 2
Hebei Education Edition Fourth Grade Mathematics Volume 2

| Category | Format | Size |
|---|---|---|
| Western Normal University Edition Third Grade Mathematics Volume 2 | pptx | 6 MB |

"Statistical Chart" simple statistical activity PPT courseware
2024-11-19
Copyright statement: This material is compiled and released by the user of Daoge Resources. The copyright belongs to the author. For commercial use, please contact the copyright owner. If there is any infringement, please contact the webmaster to remove the resource.
Download Points: 0.00
Free Download
Upgrade VIP
Favorite
Views: 3967 / Downloads: 128
Description
"Statistical Chart" simple statistical activity PPT courseware
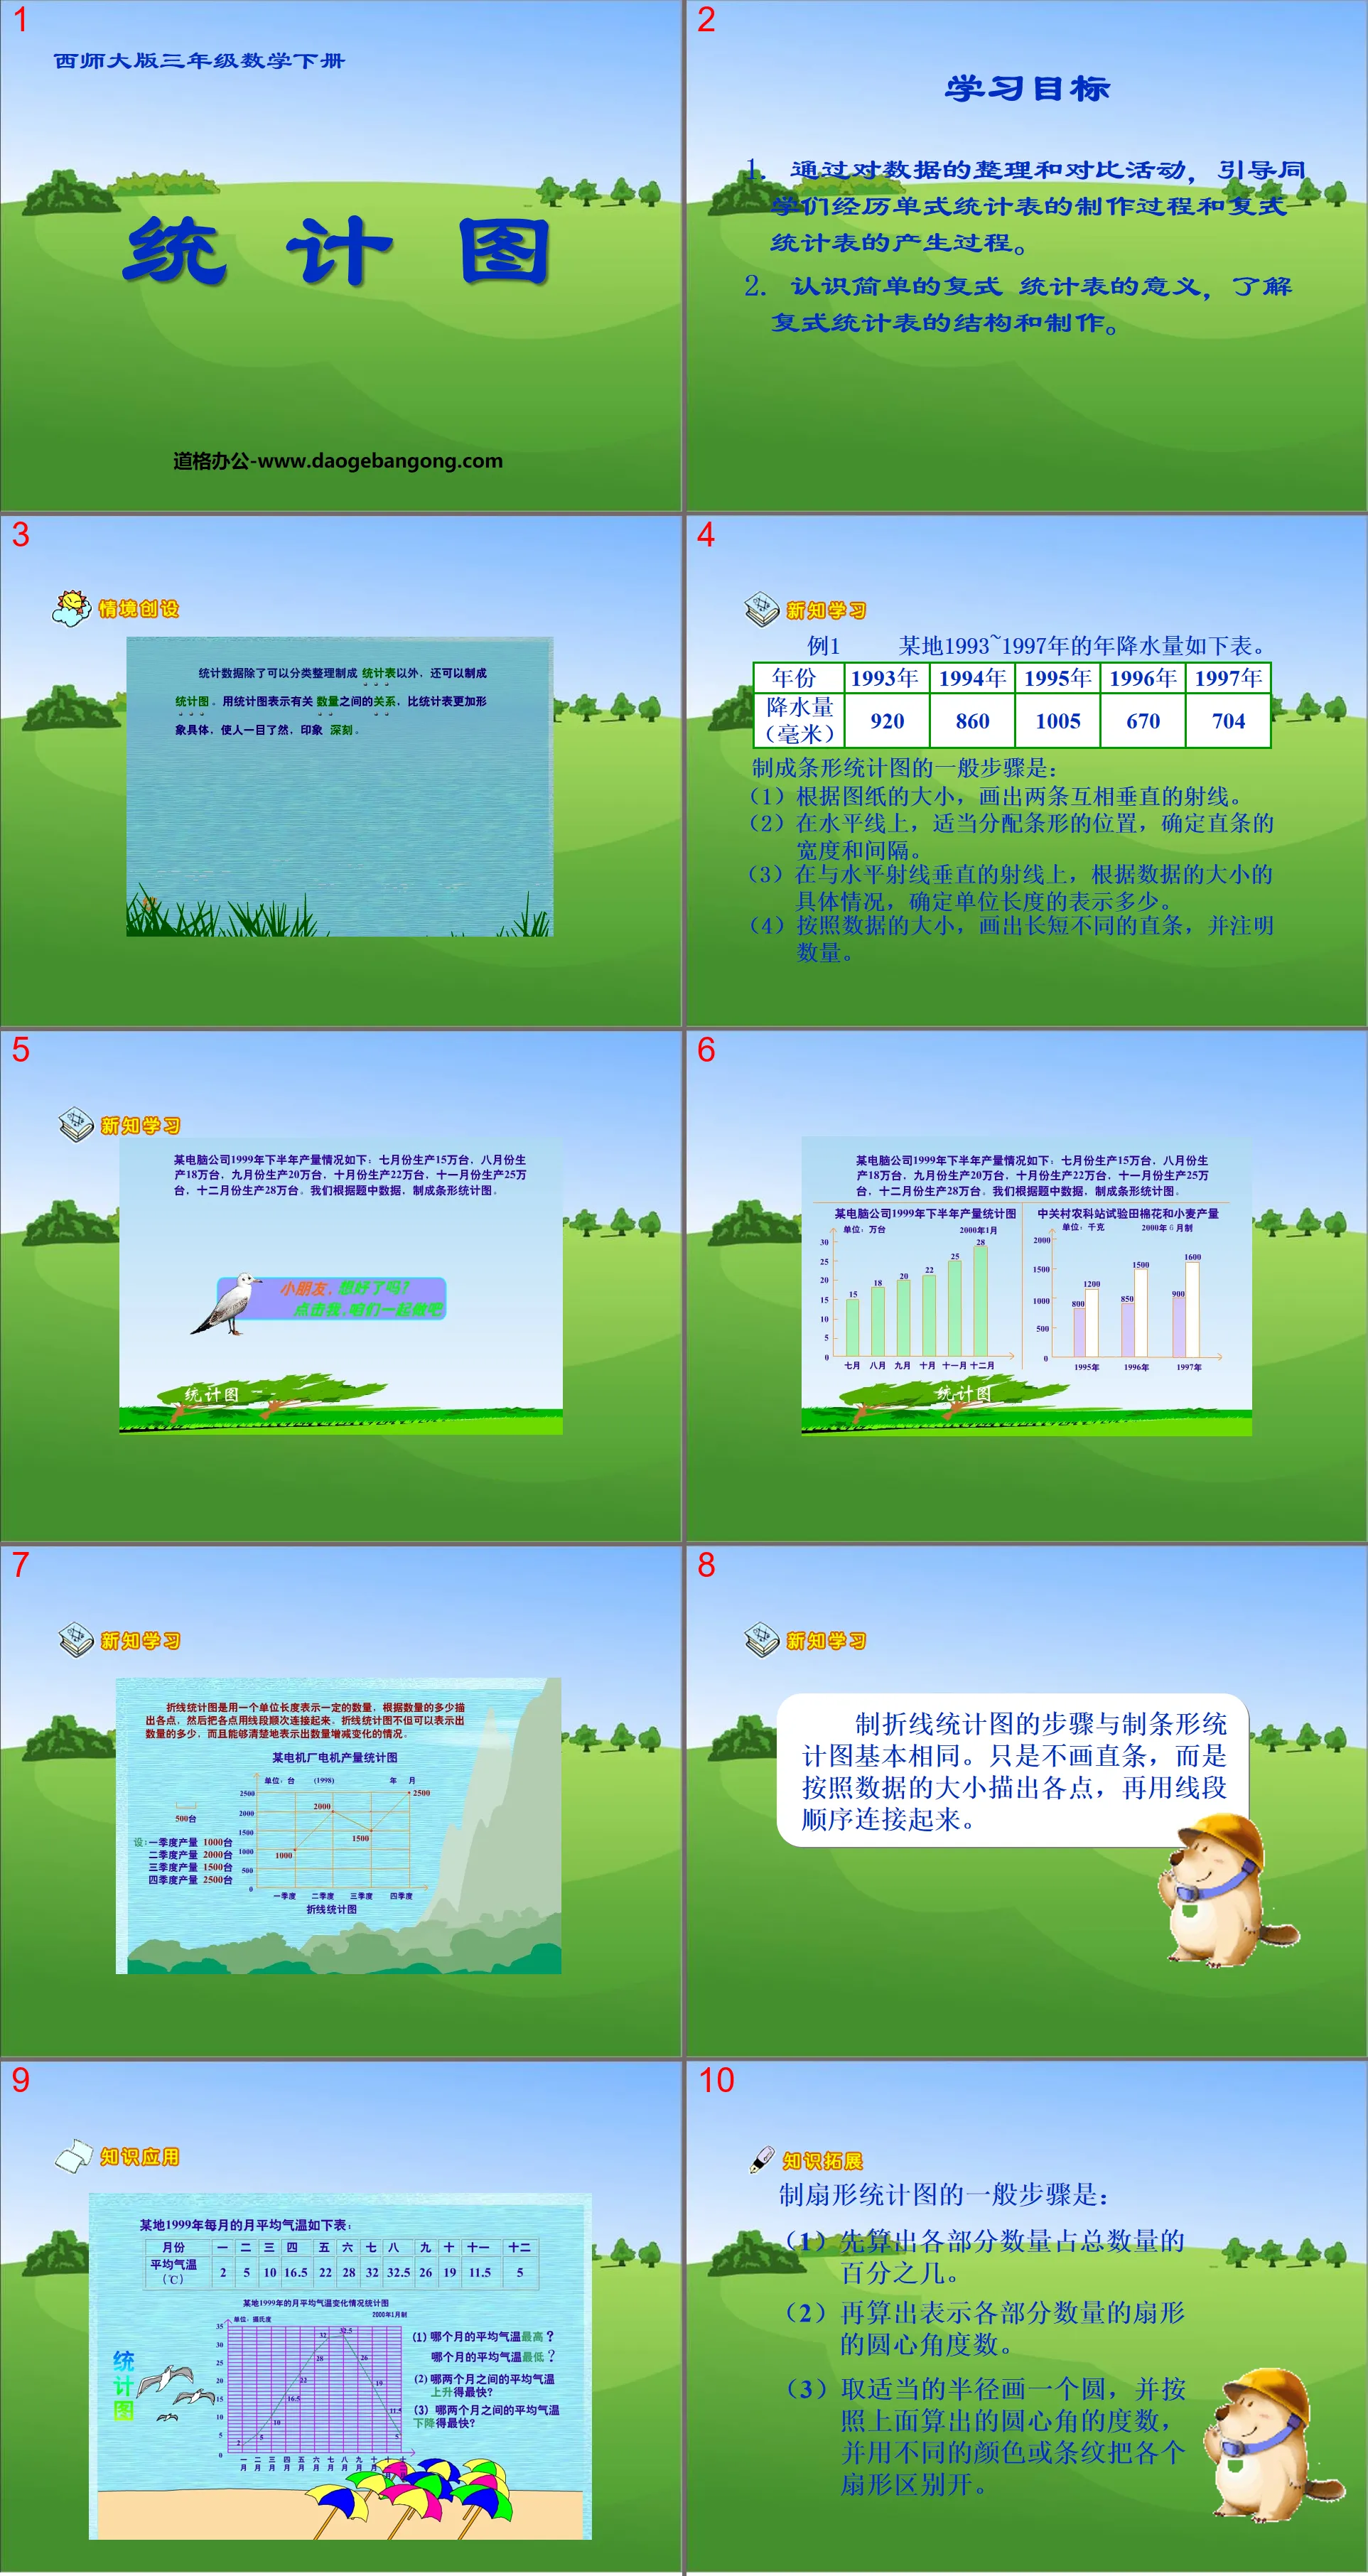
learning target
1. Through data sorting and comparison activities, students will be guided through the production process of single-entry statistical tables and the production process of double-entry statistical tables.
2. Understand the meaning of simple double-entry statistical tables, and understand the structure and production of double-entry statistical tables.
The general steps for making a bar chart are:
(1) According to the size of the drawing, draw two mutually perpendicular rays.
(2) On the horizontal line, appropriately allocate the positions of the bars and determine the width and spacing of the straight bars.
(3) On the ray perpendicular to the horizontal ray, determine how much the unit length is represented according to the specific conditions of the size of the data.
(4) According to the size of the data, draw straight bars of different lengths and indicate the number.
The general steps for making a fan chart are:
(1) First calculate the percentage of each part to the total quantity.
(2) Then calculate the central angle of the sector representing the number of each part.
(3) Draw a circle with an appropriate radius and the central angle calculated above, and use different colors or stripes to distinguish each sector.
Keywords: Simple statistical activity courseware PPT, Statistical chart courseware PPT, Western Normal University version third grade mathematics PPT courseware download, Third grade mathematics slide courseware download, Simple statistical activity PPT courseware download, Statistical chart PPT courseware download, .PPT format
For more information about the "Simple Statistical Activity Statistical Chart" PPT courseware, please click the Simple Statistical Activity ppt Statistical Chart ppt tab.
"Reading Statistical Charts" PPT:
"Reading Statistical Charts" PPT Part One: Analysis of Examples Example 4: Reading Statistical Charts (1) Information learned: (1) my country's fiscal revenue from 2003, 2005, 2007, 2010 and 2011 . (2) It exceeded 2 trillion yuan in 2003. (3)..
"Complex Line Statistical Chart" PPT:
"Compound Broken Line Statistical Chart" PPT Part One: Analysis of Example Questions Example 3: From the founding of the People's Republic of China to the present, a total of six censuses have been conducted. The following is a statistical table of the results of the six censuses. (The data in the table does not include Hong Kong, Macau and Taiwan) ..
"Understanding Special Single Line Statistical Charts" PPT:
"Understanding Special Single Line Statistical Charts" PPT Part 1 Content: Analysis of Example Questions Example 2: The following is the flood situation announcement and water level change statistical chart of a certain river at 2 pm every day from August 1st to August 6th. (1) What do the two horizontal dotted lines in the picture represent? Answer: Purple...
File Info
Update Time: 2024-11-19
This template belongs to Mathematics courseware Western Normal University Edition Third Grade Mathematics Volume 2 industry PPT template
"Statistical Chart" simple statistical activity PPT courseware Simple campus recruitment activity planning plan summary enterprise and institution recruitment publicity lecture PPT template is a general PPT template for business post competition provided by the manuscript PPT, simple campus recruitment activity planning plan summary enterprise and institution recruitment promotion Lecture PPT template, you can edit and modify the text and pictures in the source file by downloading the source file. If you want more exquisite business PPT templates, you can come to grid resource. Doug resource PPT, massive PPT template slide material download, we only make high-quality PPT templates!
Tips: If you open the template and feel that it is not suitable for all your needs, you can search for related content "Statistical Chart" simple statistical activity PPT courseware is enough.
How to use the Windows system template
Directly decompress the file and use it with office or wps
How to use the Mac system template
Directly decompress the file and use it Office or wps can be used
Related reading
For more detailed PPT-related tutorials and font tutorials, you can view: Click to see
How to create a high-quality technological sense PPT? 4 ways to share the bottom of the box
Notice
Do not download in WeChat, Zhihu, QQ, built-in browsers, please use mobile browsers to download! If you are a mobile phone user, please download it on your computer!
1. The manuscript PPT is only for study and reference, please delete it 24 hours after downloading.
2. If the resource involves your legitimate rights and interests, delete it immediately.
3. Contact information: service@daogebangong.com
"Statistical Chart" simple statistical activity PPT courseware, due to usage restrictions, it is only for personal study and reference use. For commercial use, please go to the relevant official website for authorization.
(Personal non-commercial use refers to the use of this font to complete the display of personal works, including but not limited to the design of personal papers, resumes, etc.)
Preview
Related Search:
"Statistical Chart" simple statistical activity PPT courseware
2024-11-19
Copyright statement: This material is compiled and released by the user of Daoge Resources. The copyright belongs to the author. For commercial use, please contact the copyright owner. If there is any infringement, please contact the webmaster to remove the resource.
Download Points: 0.00
Free Download
Upgrade VIP
Favorite
Views: 3967 / Downloads: 128


