
| Category | Format | Size |
|---|---|---|
| Jiangsu Education Edition Sixth Grade Mathematics Volume 2 | pptx | 6 MB |

"Sector Chart" PPT courseware
Description
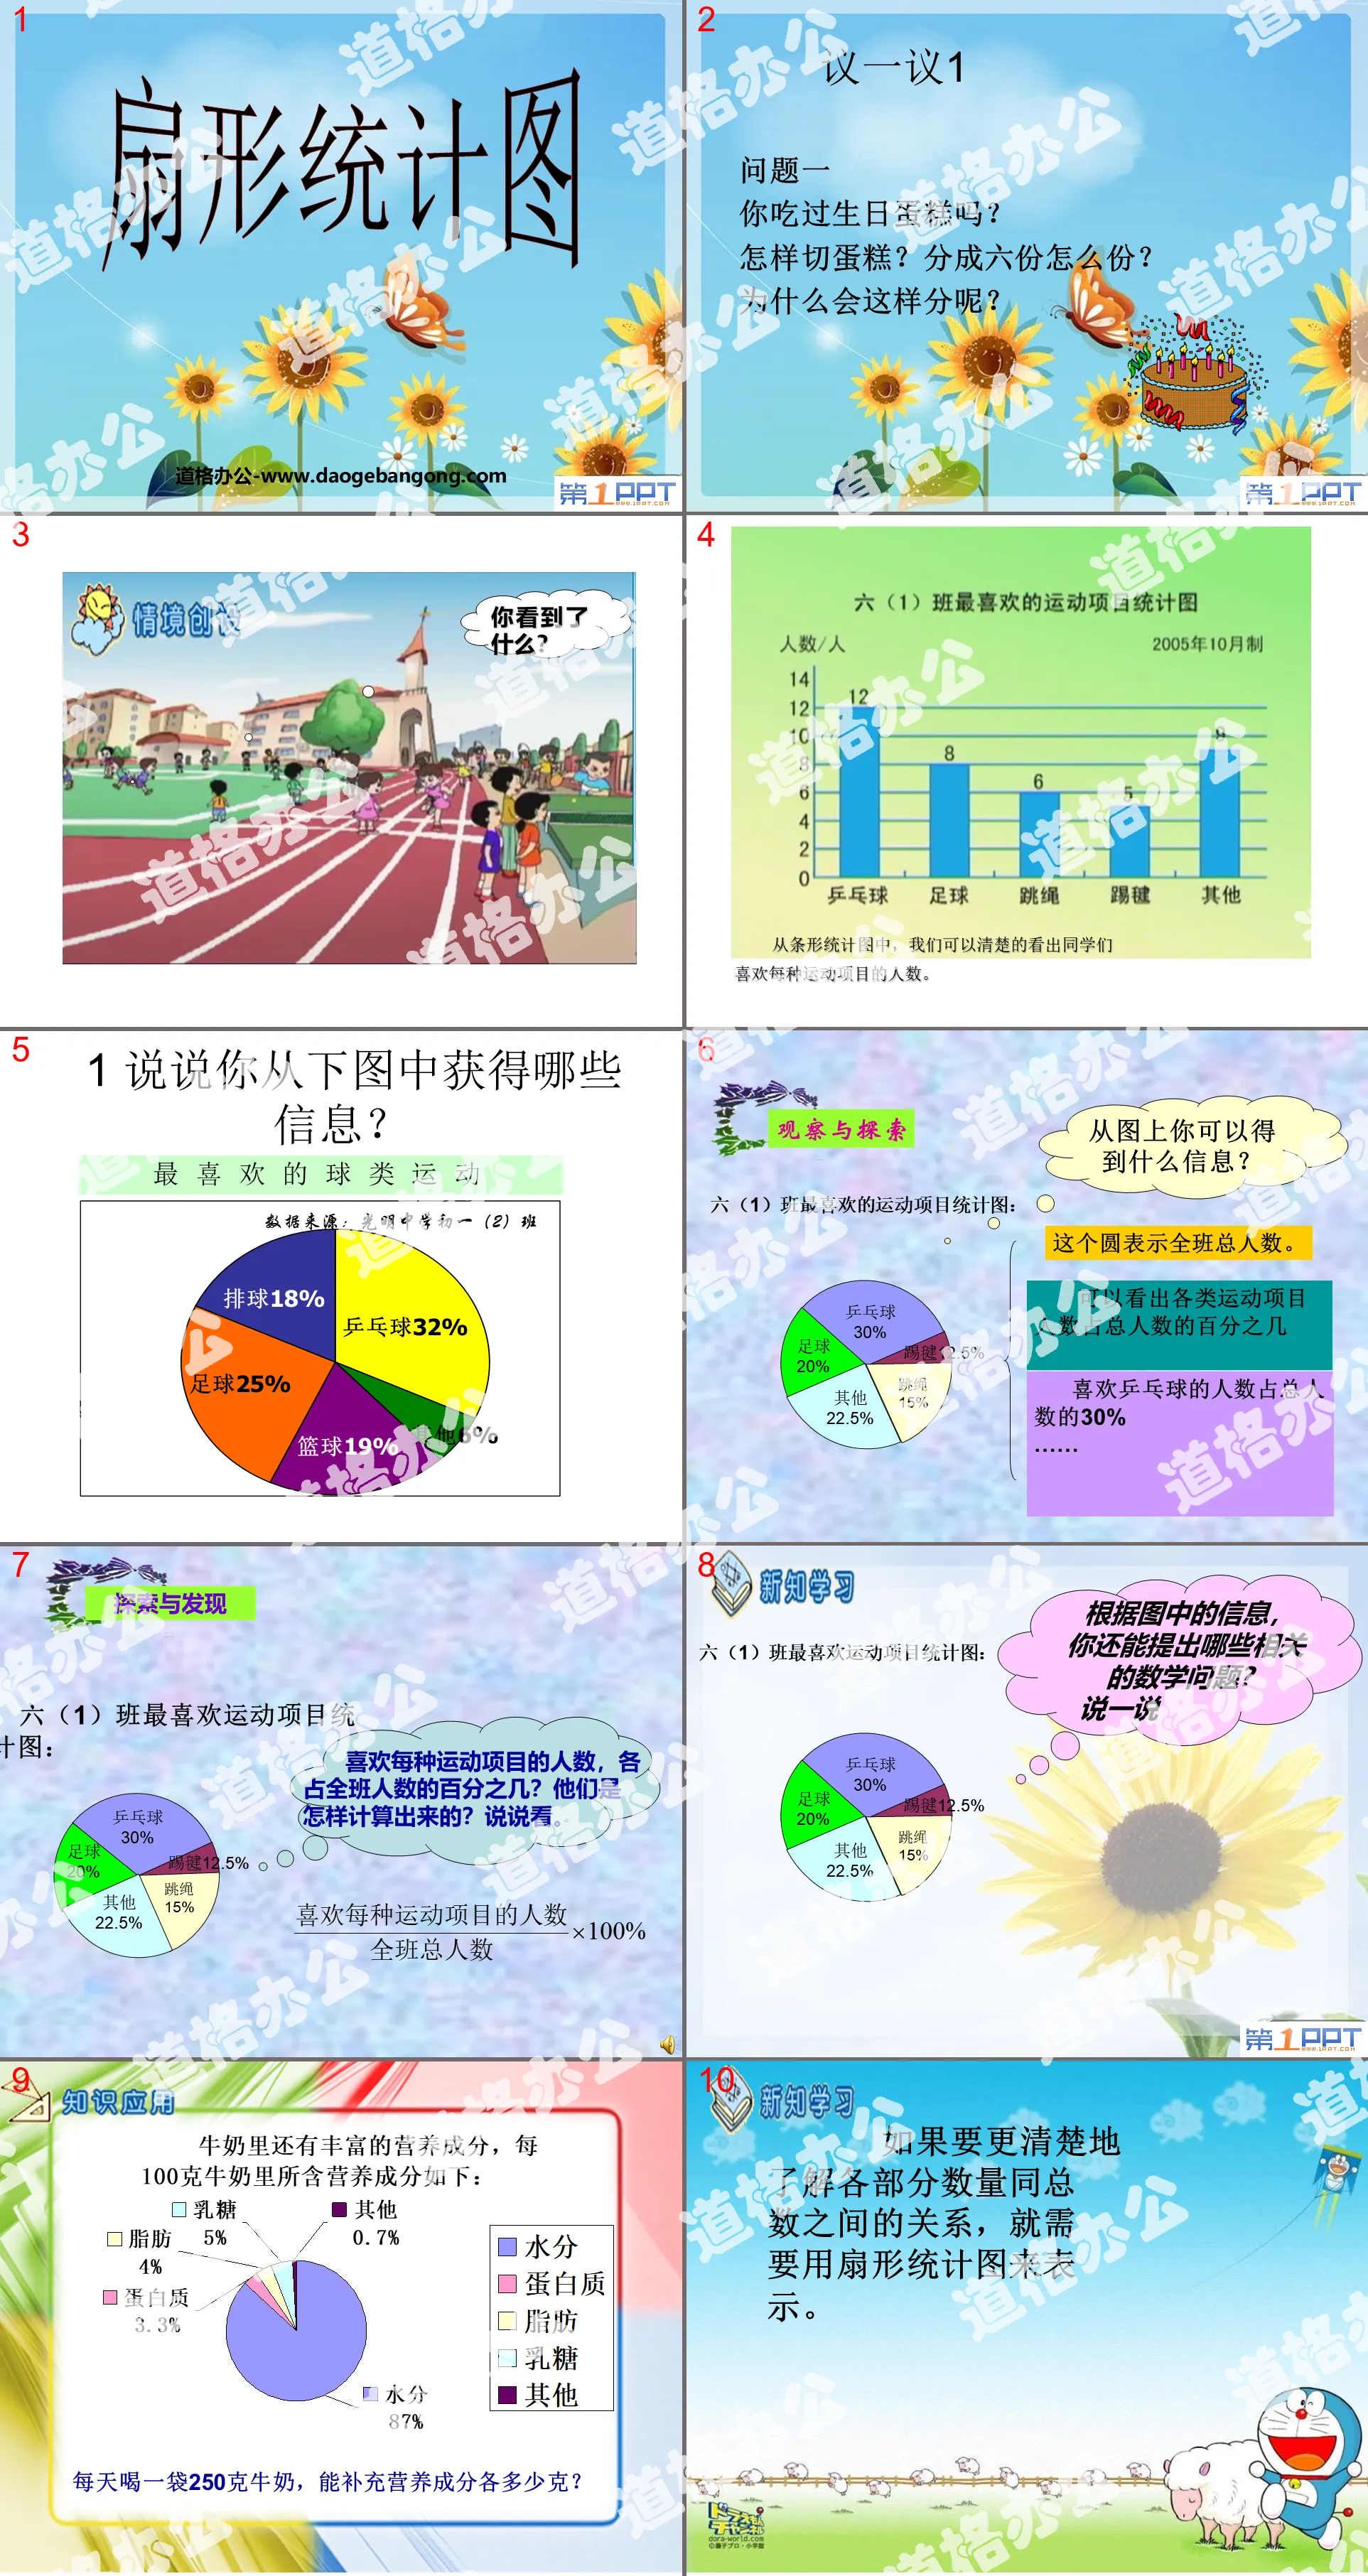
"Sector Chart" PPT courseware
Discuss
Question one
Have you ever had birthday cake?
How to cut a cake? How about dividing it into six parts?
Why is it divided like this?
If you want to understand more clearly the relationship between the quantity of each part and the total, you need to use a fan chart to represent it.
In life, we often encounter similar statistical charts, which all use circles and sectors to represent the relationship between the whole and parts.
The entire circle is used to represent the total quantity, and each sector represents a different part of the whole. The size of the sector reflects the percentage of the quantity of each part in the total. Such a statistical chart is called a fan chart.
Flexible use
If you want to clearly show the relationship between each part and the total, it is better to choose a ( ) statistical chart; as long as the quantity is expressed, it is best to draw a ( ) statistical chart; to show the average monthly temperature changes in a certain area in the second half of the year , it can be made into ( ) statistical chart.
Outward training
There are 120 sixth-grade students in a school, and 24 students are excellent in English competitions, accounting for ( )% of the sixth-grade students. If a fan-shaped statistical chart is made, the degree of the corresponding fan-shaped central angle is ( ).
Features of fan charts:
1. Use circles and sectors to express the relationship between the whole and its parts:
The circle represents the whole, and each sector represents a different part of the whole. The size of the sector reflects the percentage of the part to the whole;
2. The sum of the percentages of each sector is 1;
3. In different fan charts, the size of partial quantities cannot simply be compared based on the size of the percentage.
Keywords: sector chart courseware PPT, Jiangsu Education Edition sixth grade mathematics second volume PPT courseware download, sixth grade mathematics slide courseware download, sector chart PPT courseware download, .PPT format
For more information about the "Fan Chart" PPT courseware, please click the "Fan Chart ppt" tab.
"Choose an appropriate statistical chart to represent data" sector statistical chart PPT courseware:
"Selecting the Appropriate Statistical Chart to Represent Data" Sector Chart PPT Courseware Teaching Objectives 1. Combined with specific examples, experience the process of selecting statistical charts, discussing the characteristics of statistical charts, and using statistical charts to represent data intuitively and effectively. 2. Able to select appropriate statistics according to needs..
"Application of Fan Chart" PPT Courseware of Fan Chart:
"Application of Fan Charts" Fan Chart PPT Courseware Teaching Objectives 1. Combined with specific examples, experience the process of reading statistical charts, analyzing data information, asking questions and answering questions. 2. Be able to read statistical graphs in daily life and answer questions related to statistical information..
"Sector Chart" Flash Animation Courseware 2:
"Sector Chart" Flash Animation Courseware 2 This courseware is a Flash animation courseware for the teaching material of Unit 7 of the Sixth Grade Mathematics Volume 1 of the Hebei Education Edition. The content is vivid and vivid. Please download it! Keywords: Fan chart teaching courseware, Hebei Education Edition for sixth graders..
File Info
Update Time: 2024-07-06
This template belongs to Mathematics courseware Jiangsu Education Edition Sixth Grade Mathematics Volume 2 industry PPT template
"Sector Chart" PPT courseware Simple campus recruitment activity planning plan summary enterprise and institution recruitment publicity lecture PPT template is a general PPT template for business post competition provided by the manuscript PPT, simple campus recruitment activity planning plan summary enterprise and institution recruitment promotion Lecture PPT template, you can edit and modify the text and pictures in the source file by downloading the source file. If you want more exquisite business PPT templates, you can come to grid resource. Doug resource PPT, massive PPT template slide material download, we only make high-quality PPT templates!
Tips: If you open the template and feel that it is not suitable for all your needs, you can search for related content "Sector Chart" PPT courseware is enough.
How to use the Windows system template
Directly decompress the file and use it with office or wps
How to use the Mac system template
Directly decompress the file and use it Office or wps can be used
Related reading
For more detailed PPT-related tutorials and font tutorials, you can view: Click to see
How to create a high-quality technological sense PPT? 4 ways to share the bottom of the box
Notice
Do not download in WeChat, Zhihu, QQ, built-in browsers, please use mobile browsers to download! If you are a mobile phone user, please download it on your computer!
1. The manuscript PPT is only for study and reference, please delete it 24 hours after downloading.
2. If the resource involves your legitimate rights and interests, delete it immediately.
3. Contact information: service@daogebangong.com
"Sector Chart" PPT courseware, due to usage restrictions, it is only for personal study and reference use. For commercial use, please go to the relevant official website for authorization.
(Personal non-commercial use refers to the use of this font to complete the display of personal works, including but not limited to the design of personal papers, resumes, etc.)
Preview
Related Search: