
| Category | Format | Size |
|---|---|---|
| Jiangsu Education Edition Sixth Grade Mathematics Volume 2 | pptx | 6 MB |

"Sector Chart" PPT Courseware 2
Description
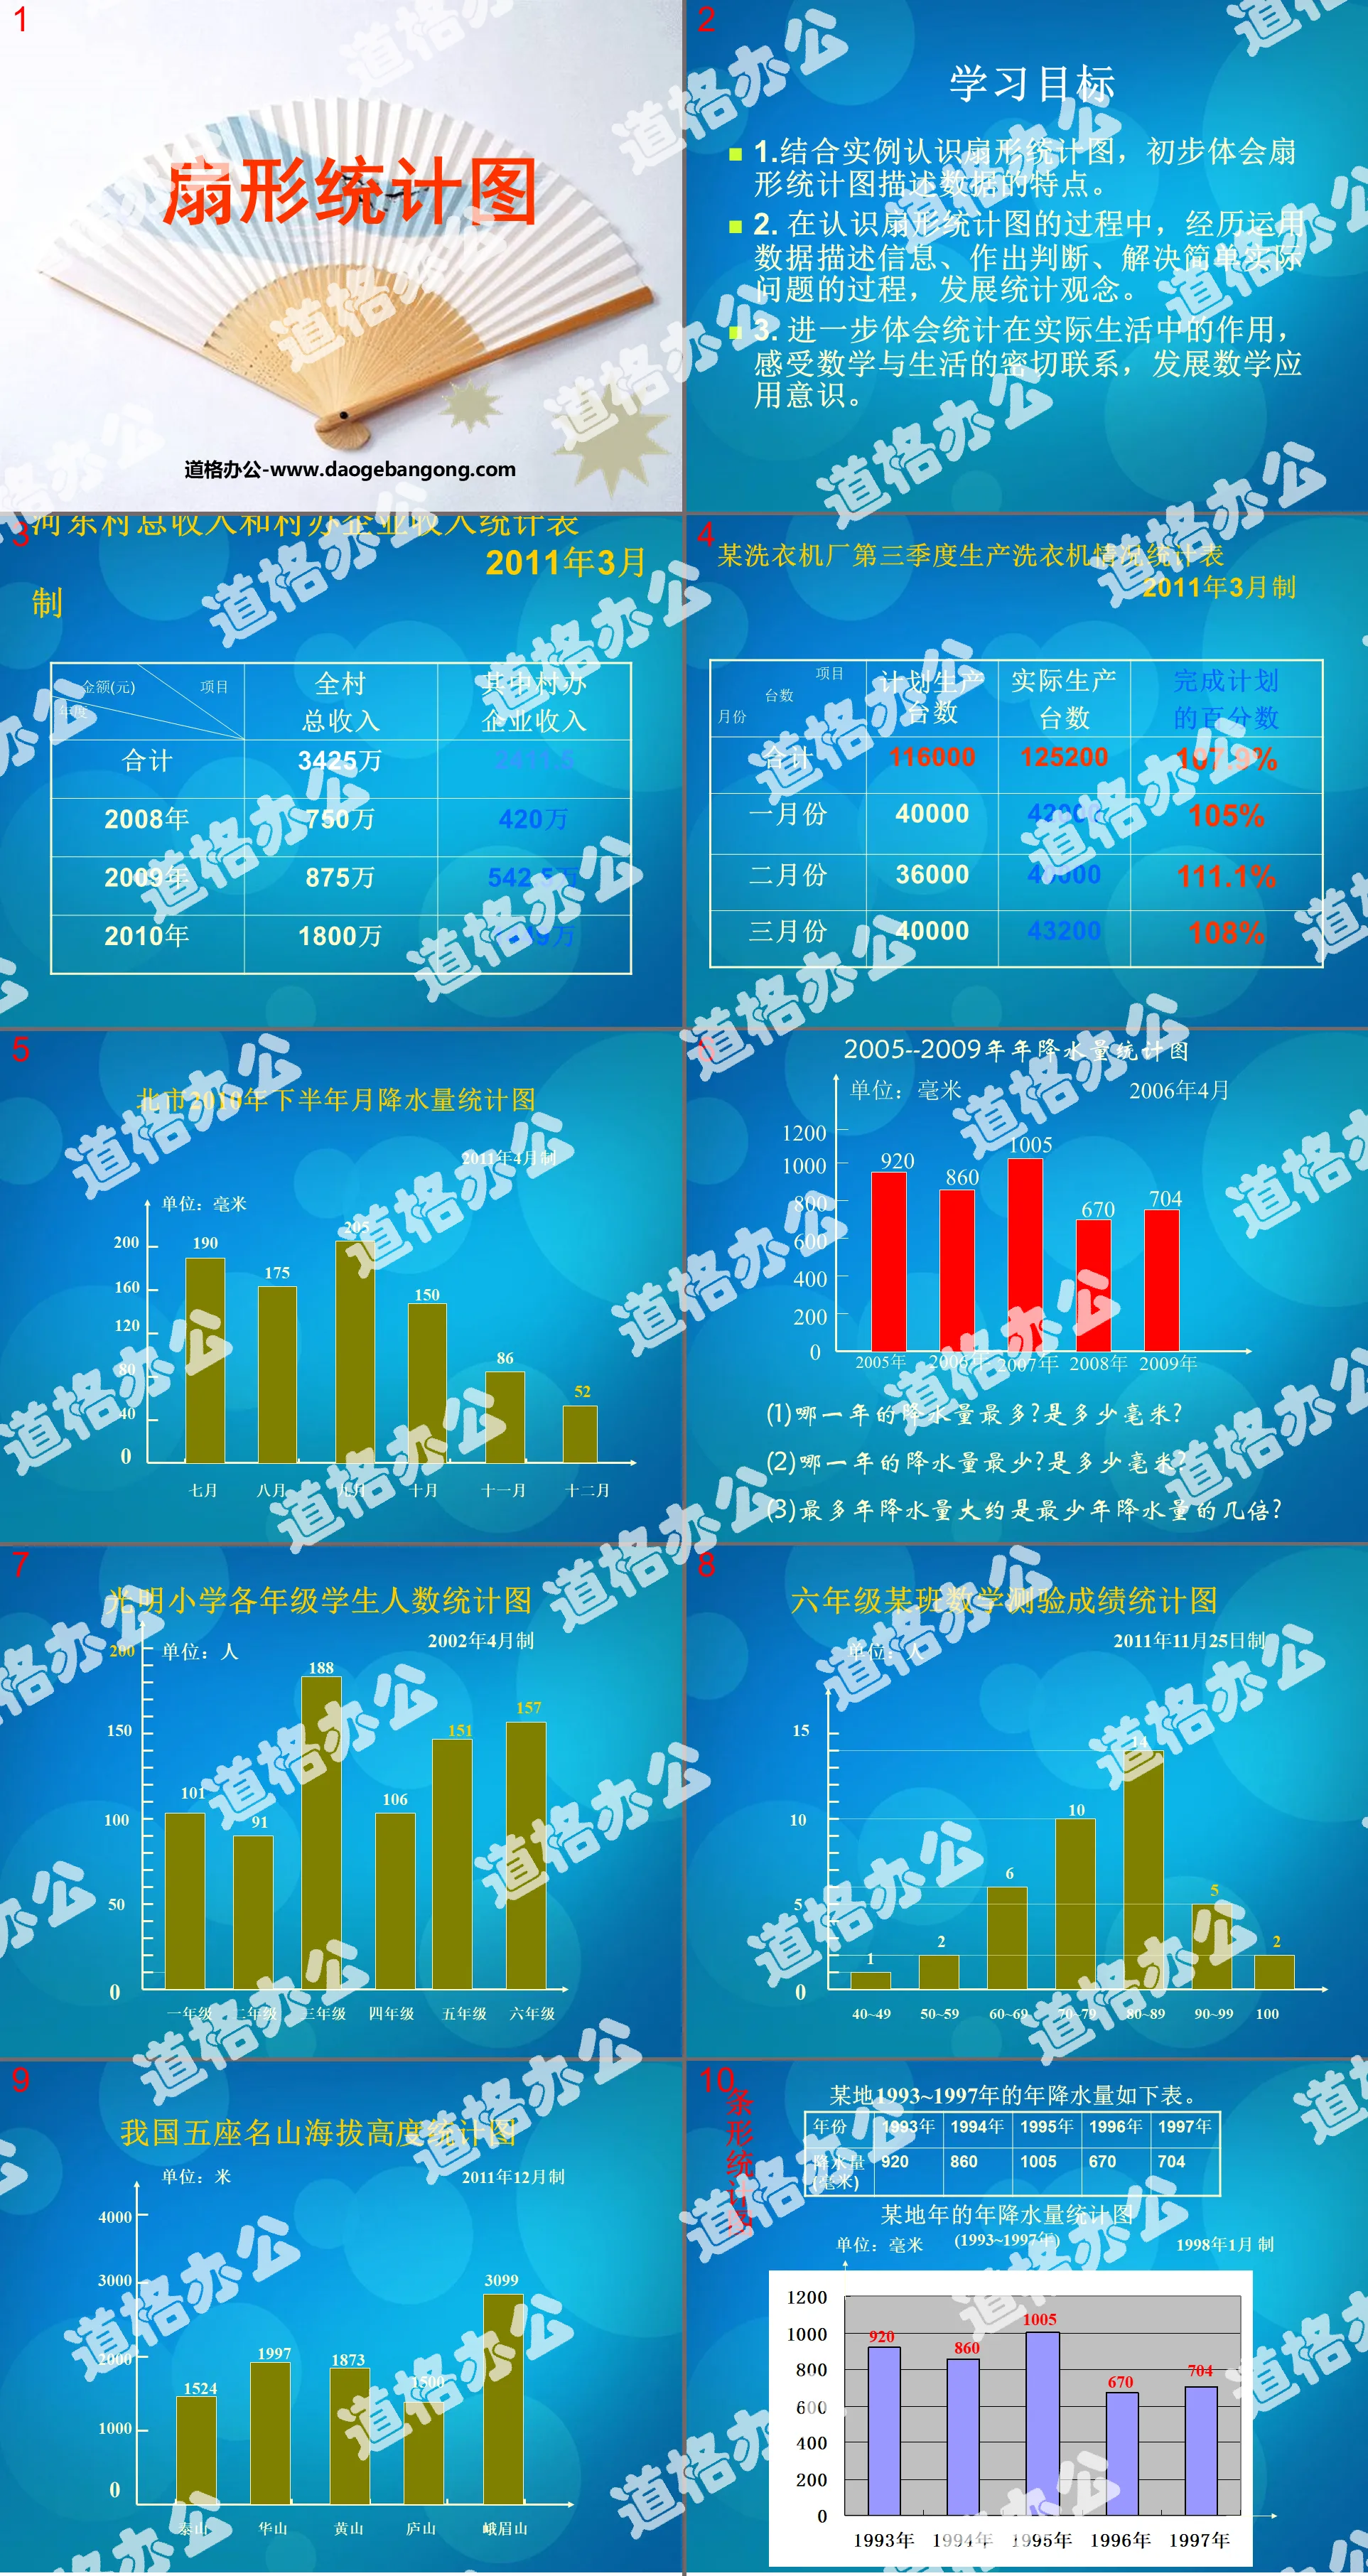
"Sector Chart" PPT Courseware 2
learning target
1. Understand the fan chart based on examples, and initially understand the characteristics of the fan chart to describe data.
2. In the process of understanding fan charts, experience the process of using data to describe information, make judgments, and solve simple practical problems to develop statistical concepts.
3. Further understand the role of statistics in real life, feel the close connection between mathematics and life, and develop awareness of mathematical applications.
Sector statistical chart:
1. The circle represents the whole.
2. Sectors represent different parts of the whole.
3. The size of the sector reflects the percentage of the part to the whole.
Discuss and answer with classmates:
(1) If this circle represents the population, which sector represents 25% of the population?
(2) If the entire circle represents the number of students in your class, how many people does fan-shaped area B represent?
(3) If the entire circle represents the 100 yuan in your pocket, then how much does C represent?
fill in the blank:
1. In addition to being classified and organized into ( ), statistical data can also be produced ( ). Using statistical charts to express the relationship between relevant quantities is more clear ( ) than statistical tables, making it clear at a glance and impressive.
2. Commonly used statistical charts include ( ), ( ) ( ).
3. The bar graph uses a ( ) to represent a certain ( ), and draws ( ) with different lengths according to the number of ( ), and then arranges these ( ) according to a certain ( ).
4. It is easy to see from the bar chart ( ).
Keywords: sector chart courseware PPT, Jiangsu Education Edition sixth grade mathematics second volume PPT courseware download, sixth grade mathematics slide courseware download, sector chart PPT courseware download, .PPT format
For more information about the "Fan Chart" PPT courseware, please click the "Fan Chart ppt" tab.
"Choose an appropriate statistical chart to represent data" sector statistical chart PPT courseware:
"Selecting the Appropriate Statistical Chart to Represent Data" Sector Chart PPT Courseware Teaching Objectives 1. Combined with specific examples, experience the process of selecting statistical charts, discussing the characteristics of statistical charts, and using statistical charts to represent data intuitively and effectively. 2. Able to select appropriate statistics according to needs..
"Application of Fan Chart" PPT Courseware of Fan Chart:
"Application of Fan Charts" Fan Chart PPT Courseware Teaching Objectives 1. Combined with specific examples, experience the process of reading statistical charts, analyzing data information, asking questions and answering questions. 2. Be able to read statistical graphs in daily life and answer questions related to statistical information..
"Sector Chart" Flash Animation Courseware 2:
"Sector Chart" Flash Animation Courseware 2 This courseware is a Flash animation courseware for the teaching material of Unit 7 of the Sixth Grade Mathematics Volume 1 of the Hebei Education Edition. The content is vivid and vivid. Please download it! Keywords: Fan chart teaching courseware, Hebei Education Edition for sixth graders..
File Info
Update Time: 2024-07-06
This template belongs to Mathematics courseware Jiangsu Education Edition Sixth Grade Mathematics Volume 2 industry PPT template
"Sector Chart" PPT Courseware 2 Simple campus recruitment activity planning plan summary enterprise and institution recruitment publicity lecture PPT template is a general PPT template for business post competition provided by the manuscript PPT, simple campus recruitment activity planning plan summary enterprise and institution recruitment promotion Lecture PPT template, you can edit and modify the text and pictures in the source file by downloading the source file. If you want more exquisite business PPT templates, you can come to grid resource. Doug resource PPT, massive PPT template slide material download, we only make high-quality PPT templates!
Tips: If you open the template and feel that it is not suitable for all your needs, you can search for related content "Sector Chart" PPT Courseware 2 is enough.
How to use the Windows system template
Directly decompress the file and use it with office or wps
How to use the Mac system template
Directly decompress the file and use it Office or wps can be used
Related reading
For more detailed PPT-related tutorials and font tutorials, you can view: Click to see
How to create a high-quality technological sense PPT? 4 ways to share the bottom of the box
Notice
Do not download in WeChat, Zhihu, QQ, built-in browsers, please use mobile browsers to download! If you are a mobile phone user, please download it on your computer!
1. The manuscript PPT is only for study and reference, please delete it 24 hours after downloading.
2. If the resource involves your legitimate rights and interests, delete it immediately.
3. Contact information: service@daogebangong.com
"Sector Chart" PPT Courseware 2, due to usage restrictions, it is only for personal study and reference use. For commercial use, please go to the relevant official website for authorization.
(Personal non-commercial use refers to the use of this font to complete the display of personal works, including but not limited to the design of personal papers, resumes, etc.)
Preview
Related Search: