| Category | Format | Size |
|---|---|---|
| Jiangsu Education Edition Fifth Grade Mathematics Volume 2 | pptx | 6 MB |

"Single Line Statistical Chart" Line Statistical Chart PPT Courseware
Description
"Single Line Statistical Chart" Line Statistical Chart PPT Courseware
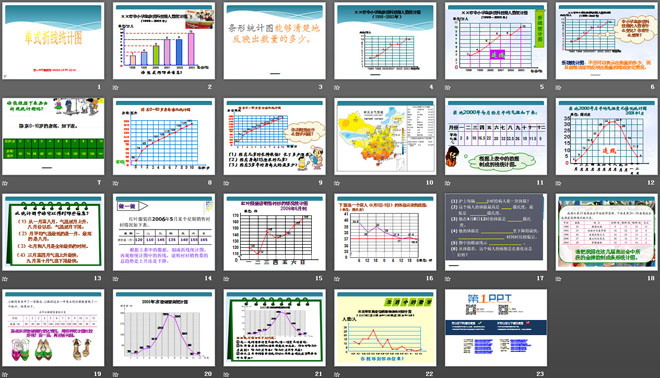
What other math questions can you ask?
(1) At what age did Chen Dong grow the fastest? How many centimeters has it grown?
(2) How old was Chen Dong when he was 115 cm tall?
(3) How tall is Chen Dong approximately when he is 5 and a half years old?
What information can you get from a statistical chart?
(1) From January to August, the temperature rises month by month, and after August, the temperature drops month by month.
(2) The lowest monthly average temperature is in January and the highest in August.
(3) July and August are the hottest times of the year.
(4) The temperature rises fastest from March to April and drops fastest from September to October.
Answer the following questions based on the statistical graph:
① Talk about the changes in sales volume and think about the reasons for the changes.
② If the cost can be recovered by selling 60 pairs of sandals every month, then which months will be profitable? Which months were the losses? In which months are there no losses and no profits?
③How do you think last year’s sales statistics will help shoe stores determine the purchase quantity in the future?
Keywords: line statistical chart courseware PPT, single line statistical chart courseware PPT, Jiangsu Education Edition fifth grade mathematics volume PPT courseware download, fifth grade mathematics slide courseware download, line statistical chart PPT courseware download, single line statistical chart PPT Courseware download, .PPT format
For more information about the "Line Statistical Chart Single Type Line Statistical Chart" PPT courseware, please click the "Line Line Statistical Chart ppt Single Type Line Statistical Chart ppt" tag.
"Understanding Special Single Line Statistical Charts" PPT:
"Understanding Special Single Line Statistical Charts" PPT Part One Content: Analysis of Example Questions Example 2: The following is a flood situation announcement and a statistical chart of water level changes of a certain river at 2 p.m. every day from August 1 to August 6. (1) What do the two horizontal dotted lines in the picture represent? Answer: Purple...
"Understanding Single Line Statistical Chart" PPT:
"Understanding Single Line Statistical Charts" PPT Part One Content: Learning Objectives 1. Understand simple line statistical charts, understand the structure of line statistical charts, understand the characteristics of line statistical charts, and be able to create simple line statistical charts in the provided tables . 2. Understand statistics and...
"Single Line Statistical Chart" Line Statistical Chart PPT Courseware 2:
"Single Line Statistical Chart" Line Statistical Chart PPT Courseware 2 Learning Objectives: 1. Understand the line statistical chart and its characteristics, and know the general method of making a line statistical chart. 2. Understand line statistical charts and be able to make simple analyses. Able to exchange ideas with peers. ..
File Info
Update Time: 2024-07-06
This template belongs to Mathematics courseware Jiangsu Education Edition Fifth Grade Mathematics Volume 2 industry PPT template
"Single Line Statistical Chart" Line Statistical Chart PPT Courseware Simple campus recruitment activity planning plan summary enterprise and institution recruitment publicity lecture PPT template is a general PPT template for business post competition provided by the manuscript PPT, simple campus recruitment activity planning plan summary enterprise and institution recruitment promotion Lecture PPT template, you can edit and modify the text and pictures in the source file by downloading the source file. If you want more exquisite business PPT templates, you can come to grid resource. Doug resource PPT, massive PPT template slide material download, we only make high-quality PPT templates!
Tips: If you open the template and feel that it is not suitable for all your needs, you can search for related content "Single Line Statistical Chart" Line Statistical Chart PPT Courseware is enough.
How to use the Windows system template
Directly decompress the file and use it with office or wps
How to use the Mac system template
Directly decompress the file and use it Office or wps can be used
Related reading
For more detailed PPT-related tutorials and font tutorials, you can view: Click to see
How to create a high-quality technological sense PPT? 4 ways to share the bottom of the box
Notice
Do not download in WeChat, Zhihu, QQ, built-in browsers, please use mobile browsers to download! If you are a mobile phone user, please download it on your computer!
1. The manuscript PPT is only for study and reference, please delete it 24 hours after downloading.
2. If the resource involves your legitimate rights and interests, delete it immediately.
3. Contact information: service@daogebangong.com
"Single Line Statistical Chart" Line Statistical Chart PPT Courseware, due to usage restrictions, it is only for personal study and reference use. For commercial use, please go to the relevant official website for authorization.
(Personal non-commercial use refers to the use of this font to complete the display of personal works, including but not limited to the design of personal papers, resumes, etc.)
Preview
Related Search: