Western Normal University Edition First Grade Mathematics Volume 1
Beijing Normal University Edition Seventh Grade Mathematics Volume 1
People's Education Press First Grade Mathematics Volume 1
People's Education Press Third Grade Mathematics Volume 1
People's Education Press Second Grade Mathematics Volume 1
Hebei Education Edition Third Grade Mathematics Volume 1
Beijing Normal University Edition Seventh Grade Mathematics Volume 2
Beijing Normal University Edition Fifth Grade Mathematics Volume 1
Qingdao Edition Seventh Grade Mathematics Volume 1
Hebei Education Edition Seventh Grade Mathematics Volume 2
Beijing Normal University Edition Eighth Grade Mathematics Volume 1
People's Education High School Mathematics Edition B Compulsory Course 2
Jiangsu Education Edition Fourth Grade Mathematics Volume 1
People's Education Press First Grade Mathematics Volume 2
Qingdao Edition Seventh Grade Mathematics Volume 2
Beijing Normal University Edition Fifth Grade Mathematics Volume 2

| Category | Format | Size |
|---|---|---|
| Jiangsu Education Edition Fifth Grade Mathematics Volume 2 | pptx | 6 MB |

"Compound Line Statistical Chart" Line Statistical Chart PPT Courseware 2
2024-10-01
Copyright statement: This material is compiled and released by the user of Daoge Resources. The copyright belongs to the author. For commercial use, please contact the copyright owner. If there is any infringement, please contact the webmaster to remove the resource.
Download Points: 0.00
Free Download
Upgrade VIP
Favorite
Views: 1627 / Downloads: 462
Description
"Compound Line Statistical Chart" Line Statistical Chart PPT Courseware 2
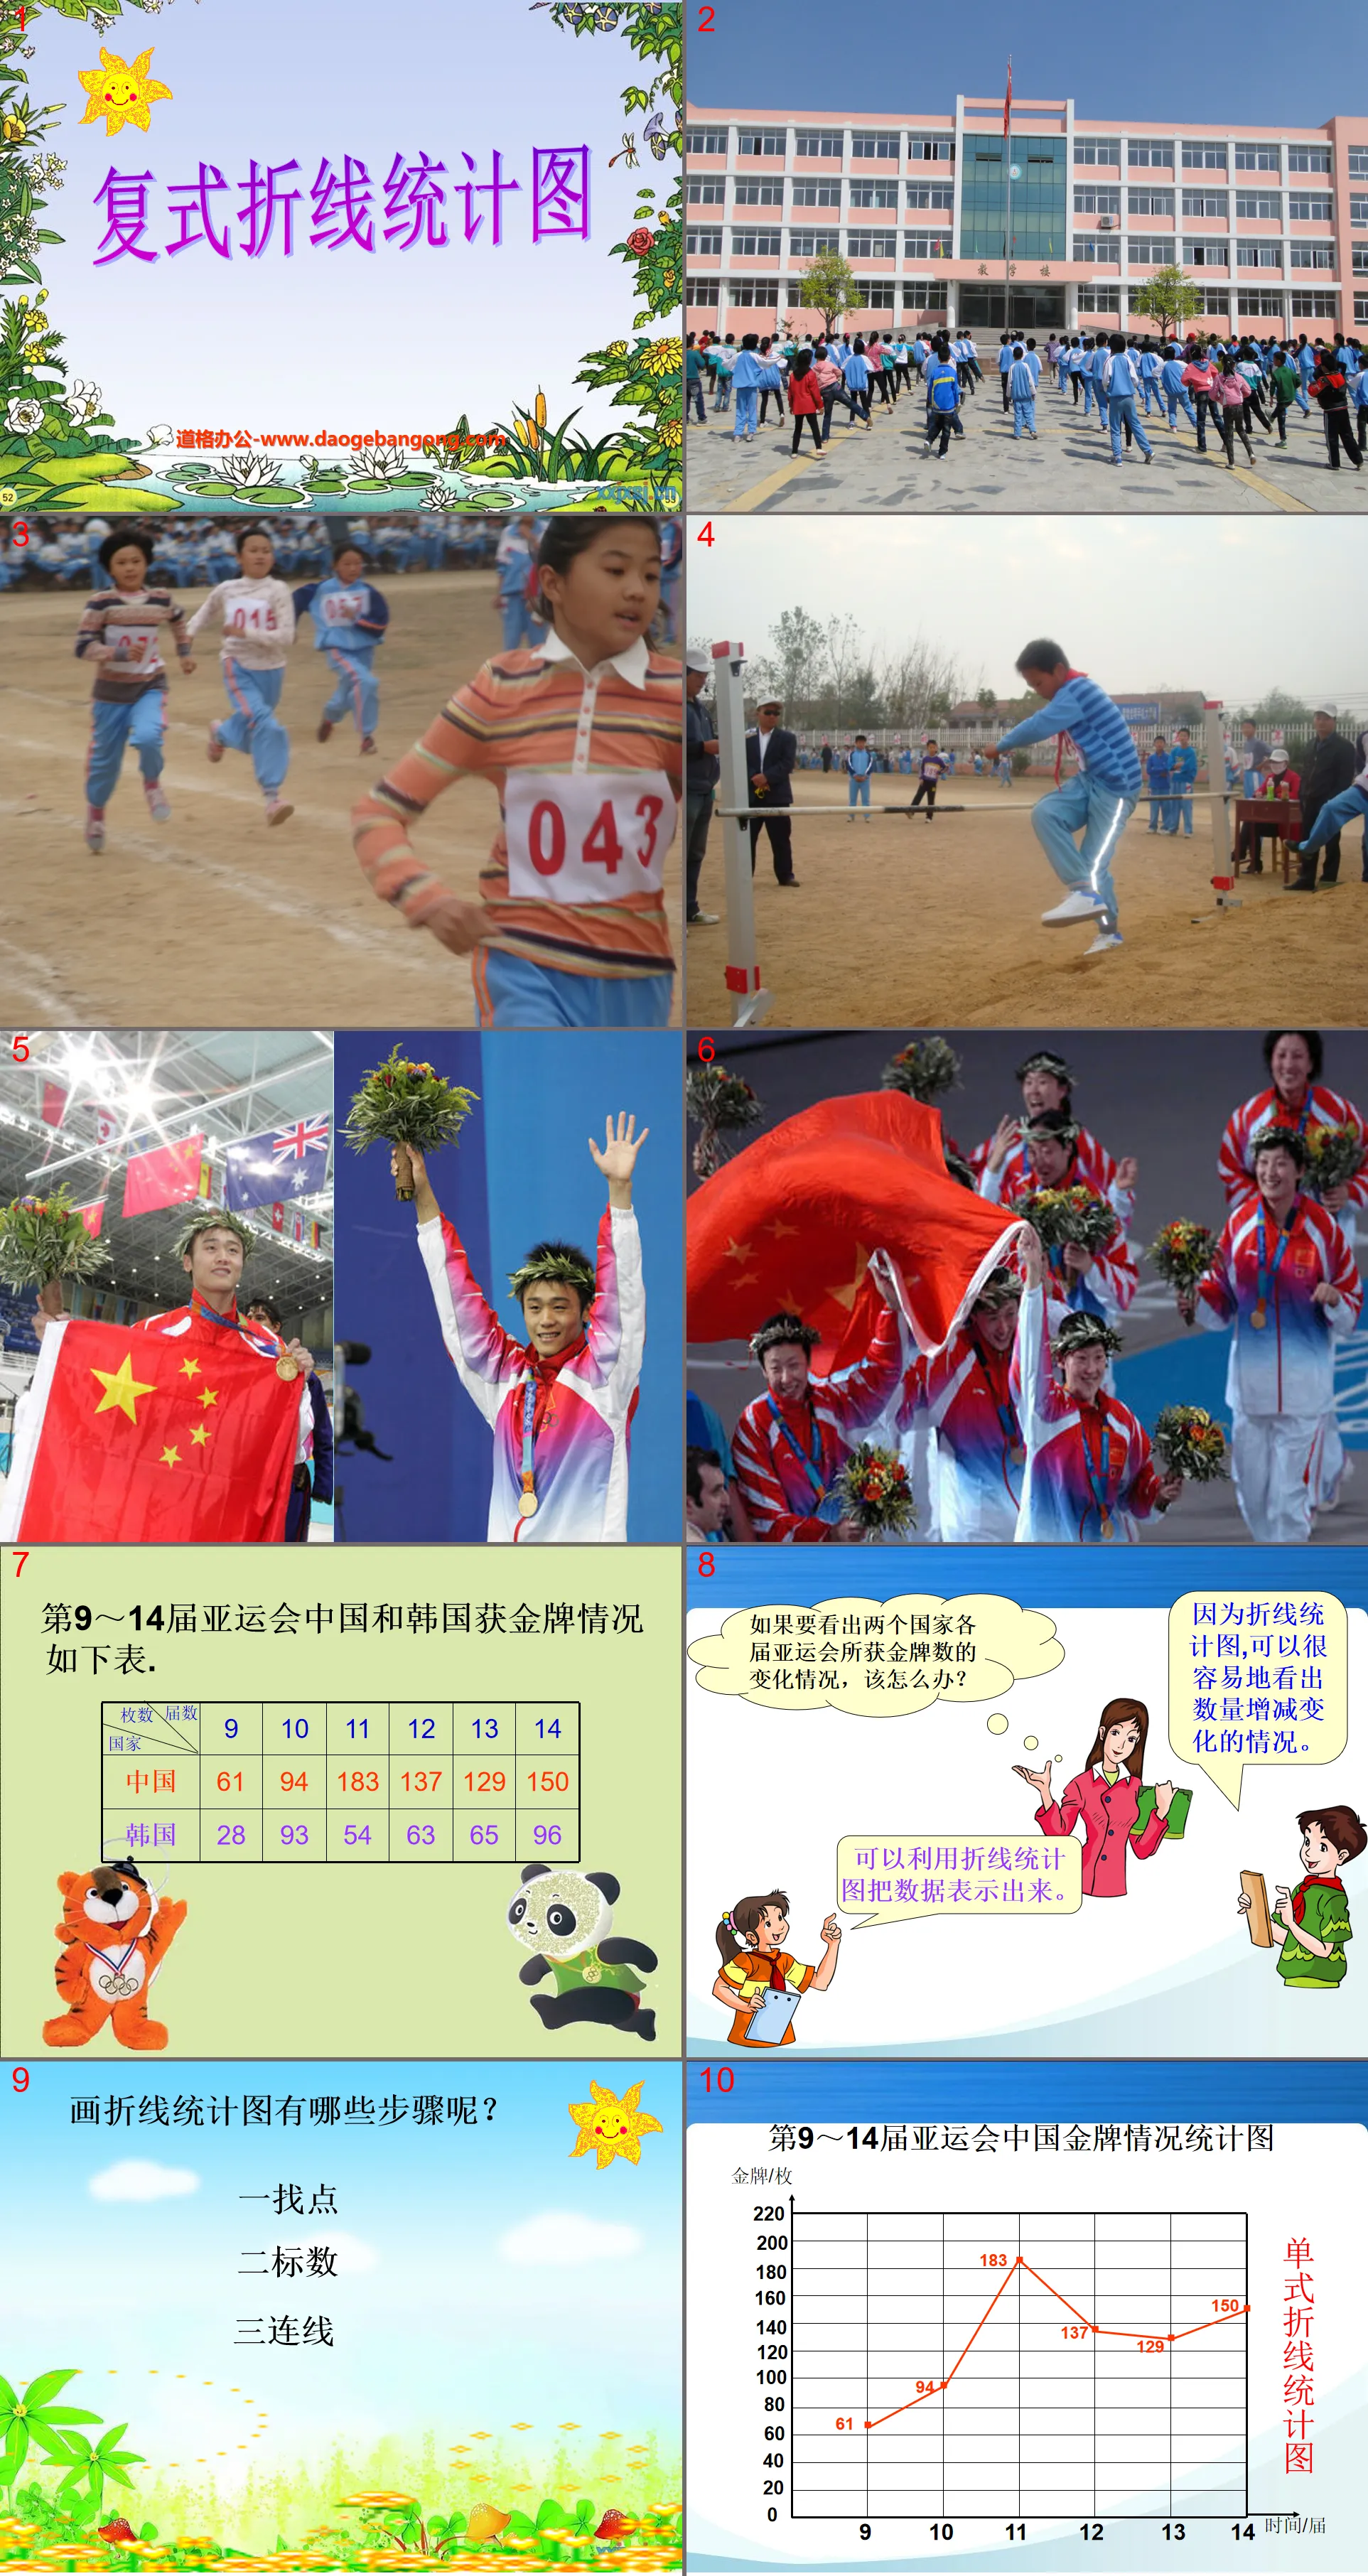
What should we do if we want to see the changes in the number of gold medals won by two countries in each Asian Games?
Because of the line chart, you can easily see the increase or decrease in quantity.
Data can be represented using line charts.
How can we more easily compare the changes in the number of gold medals won by the two countries?
From the two single line charts, we can see the changes in each country, but the changes in the number of gold medals won by the two countries are not easy to compare.
You can merge two single line charts into one chart.
What are the similarities and differences between compound line charts and single line charts?
The production methods of compound line statistical charts and single-type statistical charts are roughly the same. They first find the points, then write the values, and finally connect the lines.
The compound line statistical chart is more convenient to compare the increase and decrease of two quantities.
Keywords: line statistical chart courseware PPT, compound line statistical chart courseware PPT, Jiangsu Education Edition fifth grade mathematics volume PPT courseware download, fifth grade mathematics slide courseware download, line statistical chart PPT courseware download, compound line statistical chart PPT courseware download ,.PPT format
For more information about the "Line Statistical Chart Compound Line Statistical Chart" PPT courseware, please click the "Line Line Statistical Chart ppt Compound Line Statistical Chart ppt" tag.
"Complex Line Statistical Chart" PPT:
"Compound Broken Line Statistical Chart" PPT Part One: Analysis of Example Questions Example 3: From the founding of the People's Republic of China to the present, a total of six censuses have been conducted. The following is a statistical table of the results of the six censuses. (The data in the table does not include Hong Kong, Macau and Taiwan) ..
"Compound Line Statistical Chart" Line Statistical Chart PPT Courseware 3:
"Compound Line Statistical Chart" Line Statistical Chart PPT Courseware 3 What kind of statistical chart can the above statistical table be made into? What's the reason? If you want to see the changing trend of data, what kind of statistical chart is more suitable? Can you tell me how to draw it? ... ... ... In order to enhance...
"Compound Line Statistical Chart" Line Statistical Chart PPT courseware:
"Multiple Line Statistical Chart" Broken Line Statistical Chart PPT courseware Group cooperation requirements: Two people discuss together, the student on the left writes and the student on the right checks. (1) In which Asian Games did China and South Korea win the most gold medals? (2) In which Asian Games did the two countries win the most gold medals?
File Info
Update Time: 2024-10-01
This template belongs to Mathematics courseware Jiangsu Education Edition Fifth Grade Mathematics Volume 2 industry PPT template
"Compound Line Statistical Chart" Line Statistical Chart PPT Courseware 2 Simple campus recruitment activity planning plan summary enterprise and institution recruitment publicity lecture PPT template is a general PPT template for business post competition provided by the manuscript PPT, simple campus recruitment activity planning plan summary enterprise and institution recruitment promotion Lecture PPT template, you can edit and modify the text and pictures in the source file by downloading the source file. If you want more exquisite business PPT templates, you can come to grid resource. Doug resource PPT, massive PPT template slide material download, we only make high-quality PPT templates!
Tips: If you open the template and feel that it is not suitable for all your needs, you can search for related content "Compound Line Statistical Chart" Line Statistical Chart PPT Courseware 2 is enough.
How to use the Windows system template
Directly decompress the file and use it with office or wps
How to use the Mac system template
Directly decompress the file and use it Office or wps can be used
Related reading
For more detailed PPT-related tutorials and font tutorials, you can view: Click to see
How to create a high-quality technological sense PPT? 4 ways to share the bottom of the box
Notice
Do not download in WeChat, Zhihu, QQ, built-in browsers, please use mobile browsers to download! If you are a mobile phone user, please download it on your computer!
1. The manuscript PPT is only for study and reference, please delete it 24 hours after downloading.
2. If the resource involves your legitimate rights and interests, delete it immediately.
3. Contact information: service@daogebangong.com
"Compound Line Statistical Chart" Line Statistical Chart PPT Courseware 2, due to usage restrictions, it is only for personal study and reference use. For commercial use, please go to the relevant official website for authorization.
(Personal non-commercial use refers to the use of this font to complete the display of personal works, including but not limited to the design of personal papers, resumes, etc.)
Preview
Related Search:
"Compound Line Statistical Chart" Line Statistical Chart PPT Courseware 2
2024-10-01
Copyright statement: This material is compiled and released by the user of Daoge Resources. The copyright belongs to the author. For commercial use, please contact the copyright owner. If there is any infringement, please contact the webmaster to remove the resource.
Download Points: 0.00
Free Download
Upgrade VIP
Favorite
Views: 1627 / Downloads: 462


