Western Normal University Edition First Grade Mathematics Volume 1
Beijing Normal University Edition Seventh Grade Mathematics Volume 1
People's Education Press First Grade Mathematics Volume 1
People's Education Press Third Grade Mathematics Volume 1
People's Education Press Second Grade Mathematics Volume 1
Beijing Normal University Edition Seventh Grade Mathematics Volume 2
Beijing Normal University Edition Fifth Grade Mathematics Volume 1
Hebei Education Edition Third Grade Mathematics Volume 1
Qingdao Edition Seventh Grade Mathematics Volume 1
Beijing Normal University Edition Eighth Grade Mathematics Volume 1
Hebei Education Edition Seventh Grade Mathematics Volume 2
People's Education High School Mathematics Edition B Compulsory Course 2
Qingdao Edition Seventh Grade Mathematics Volume 2
Beijing Normal University Edition Fifth Grade Mathematics Volume 2
Hebei Education Edition Fourth Grade Mathematics Volume 2
Jiangsu Education Edition Fourth Grade Mathematics Volume 1

| Category | Format | Size |
|---|---|---|
| Beijing Normal University Ninth Grade First Volume Mathematics | pptx | 6 MB |

"Using tree diagrams or tables to find probabilities" Further understanding of probability PPT courseware 2
2024-09-29
Copyright statement: This material is compiled and released by the user of Daoge Resources. The copyright belongs to the author. For commercial use, please contact the copyright owner. If there is any infringement, please contact the webmaster to remove the resource.
Download Points: 0.00
Free Download
Upgrade VIP
Favorite
Views: 1349 / Downloads: 115
Description
"Using tree diagrams or tables to find probabilities" Further understanding of probability PPT courseware 2
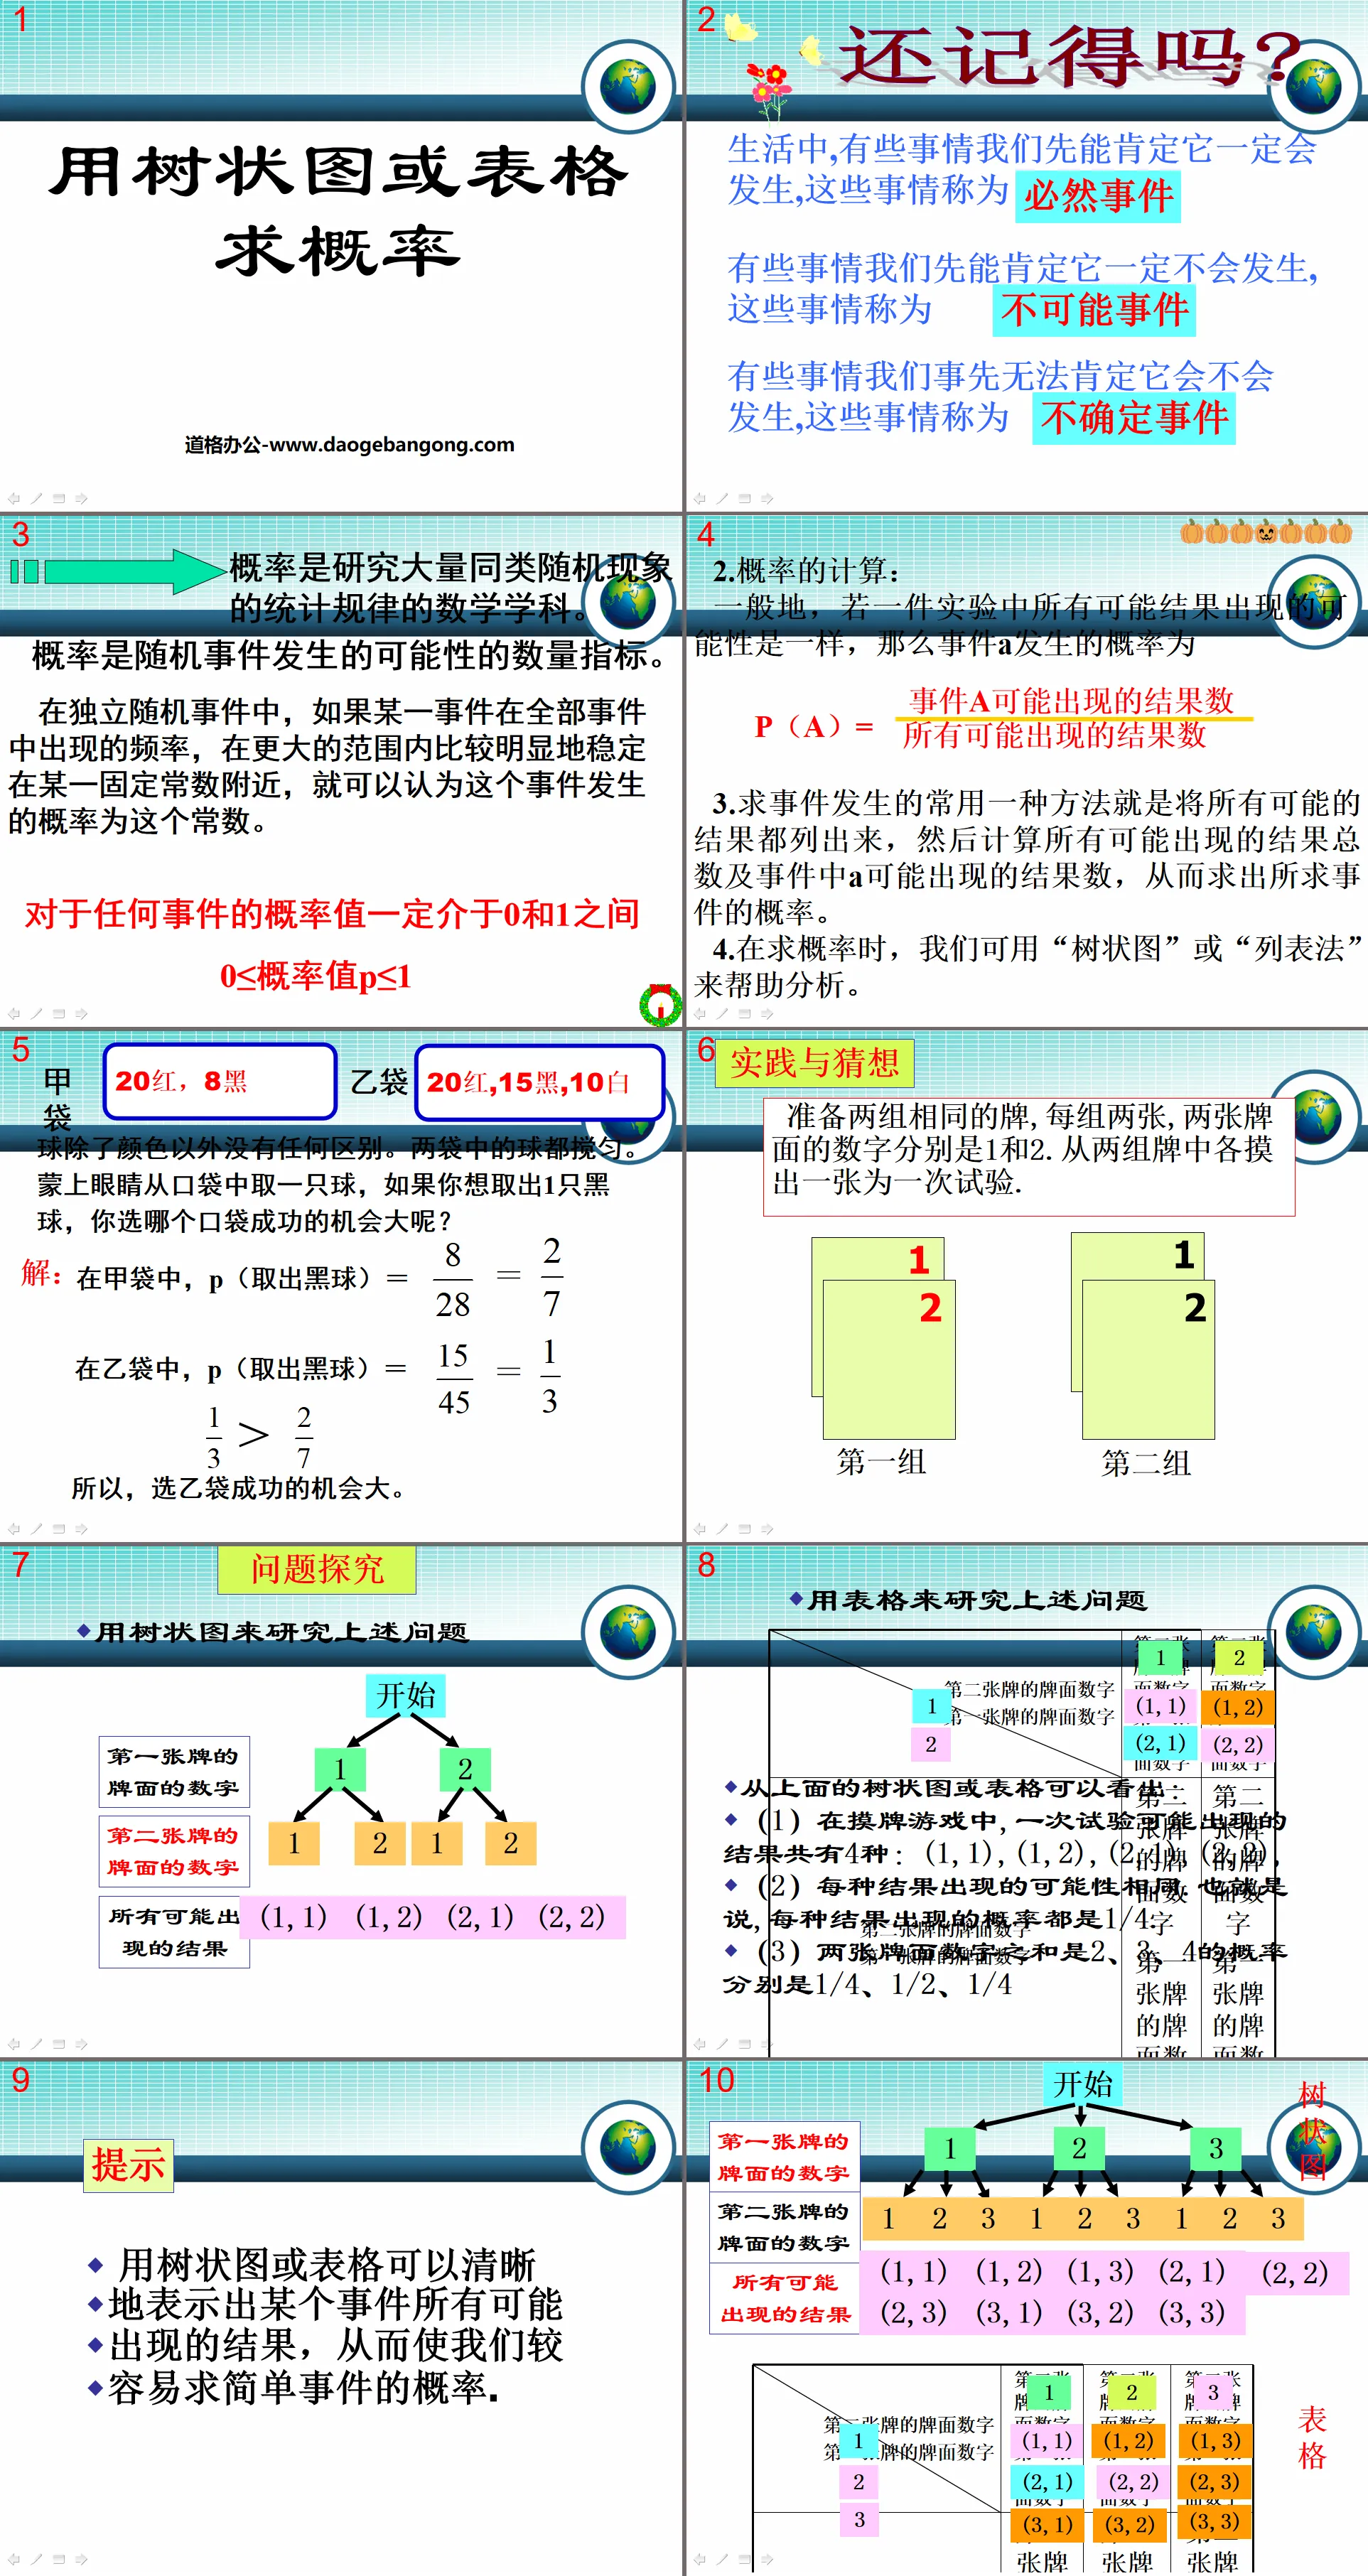
do you remember?
In life, there are some things that we can first be sure will happen. These things are called inevitable events.
There are some things that we can first be sure will not happen. These things are called impossible events.
There are some things that we cannot be sure will happen in advance. These things are called uncertain events.
Probability is a mathematical discipline that studies the statistical laws of a large number of similar random phenomena.
Probability is a quantitative measure of the likelihood of a random event occurring.
In independent random events, if the frequency of an event in all events is relatively stable around a fixed constant in a larger range, the probability of the event can be considered to be this constant.
Calculation of probability:
Generally speaking, if all possible outcomes in an experiment are equally likely, then the probability of event A occurring is
A common method for finding the occurrence of an event is to list all possible outcomes, and then calculate the total number of all possible outcomes and the number of possible outcomes of A in the event, thereby finding the probability of the event being sought.
When finding probability, we can use "dendrogram" or "list method" to help analysis.
Use tables to study the above questions
As can be seen from the tree diagram or table above:
(1) In the card drawing game, there are four possible outcomes in a trial: (1,1), (1,2), (2,1), (2,2),
(2) Each outcome is equally likely to occur. In other words, the probability of each outcome is 1/4.
(3) The probabilities that the sum of the numbers on the two cards are 2, 3, and 4 are 1/4, 1/2, and 1/4 respectively.
There are four red balls and two blue balls in the bag.
They are identical except for color;
(1) The probability that a ball is picked out at random and is a red ball is ______;
(2) Pick out a ball at random, record the color and put it back into the bag. Mix it thoroughly and then randomly pick out a ball. The probability of getting a red ball twice is ______;
(3) Two balls are randomly picked out at once. The probability that both balls are red balls is ______.
Keywords: Teaching courseware for further understanding of probability, using tree diagrams or tables to find probability teaching courseware, Beijing Normal University edition ninth grade mathematics volume PPT courseware, download of ninth grade mathematics slide courseware, downloading PPT courseware for further understanding of probability, using trees Download the PPT courseware for calculating probability with state diagram or table, in .ppt format
For more information about the PPT courseware "further understanding of probability and using tree diagrams or tables to calculate probability", please click the further understanding of probability ppt to use tree diagrams or tables to calculate probability ppt tags.
"Using tree diagrams or tables to find probabilities" Further understanding of probability PPT courseware 4:
"Using Tree Diagrams or Tables to Calculate Probability" Further Understanding of Probability PPT Courseware 4 Probability can use tree diagrams or tables to clearly express all possible outcomes of an event; thus it is easier to calculate the occurrence of certain events Probability. With purple game small..
"Using tree diagrams or tables to find probabilities" Further understanding of probability PPT courseware 3:
"Using Tree Diagrams or Tables to Find Probabilities" Further Understanding of Probability PPT Courseware 3 Game Rules: Prepare two groups of identical cards. The numbers on the two cards in each group are 1 and draw one from each group of cards. It is a trial. In the card drawing game, in the first trial, if you draw...
"Using Tree Diagrams or Tables to Find Probabilities" PPT courseware for further understanding of probability:
"Using Tree Diagrams or Tables to Find Probabilities" Further understanding of probability PPT courseware The relationship between frequency and probability When there are many trials, the frequency of an event is stable around the corresponding probability. Therefore, we can use the frequency of an event through multiple trials Let's estimate...
File Info
Update Time: 2024-09-29
This template belongs to Mathematics courseware Beijing Normal University Ninth Grade First Volume Mathematics industry PPT template
"Using tree diagrams or tables to find probabilities" Further understanding of probability PPT courseware 2 Simple campus recruitment activity planning plan summary enterprise and institution recruitment publicity lecture PPT template is a general PPT template for business post competition provided by the manuscript PPT, simple campus recruitment activity planning plan summary enterprise and institution recruitment promotion Lecture PPT template, you can edit and modify the text and pictures in the source file by downloading the source file. If you want more exquisite business PPT templates, you can come to grid resource. Doug resource PPT, massive PPT template slide material download, we only make high-quality PPT templates!
Tips: If you open the template and feel that it is not suitable for all your needs, you can search for related content "Using tree diagrams or tables to find probabilities" Further understanding of probability PPT courseware 2 is enough.
How to use the Windows system template
Directly decompress the file and use it with office or wps
How to use the Mac system template
Directly decompress the file and use it Office or wps can be used
Related reading
For more detailed PPT-related tutorials and font tutorials, you can view: Click to see
How to create a high-quality technological sense PPT? 4 ways to share the bottom of the box
Notice
Do not download in WeChat, Zhihu, QQ, built-in browsers, please use mobile browsers to download! If you are a mobile phone user, please download it on your computer!
1. The manuscript PPT is only for study and reference, please delete it 24 hours after downloading.
2. If the resource involves your legitimate rights and interests, delete it immediately.
3. Contact information: service@daogebangong.com
"Using tree diagrams or tables to find probabilities" Further understanding of probability PPT courseware 2, due to usage restrictions, it is only for personal study and reference use. For commercial use, please go to the relevant official website for authorization.
(Personal non-commercial use refers to the use of this font to complete the display of personal works, including but not limited to the design of personal papers, resumes, etc.)
Preview
Related Search:
"Using tree diagrams or tables to find probabilities" Further understanding of probability PPT courseware 2
2024-09-29
Copyright statement: This material is compiled and released by the user of Daoge Resources. The copyright belongs to the author. For commercial use, please contact the copyright owner. If there is any infringement, please contact the webmaster to remove the resource.
Download Points: 0.00
Free Download
Upgrade VIP
Favorite
Views: 1349 / Downloads: 115


