Western Normal University Edition First Grade Mathematics Volume 1
Beijing Normal University Edition Seventh Grade Mathematics Volume 1
People's Education Press First Grade Mathematics Volume 1
People's Education Press Third Grade Mathematics Volume 1
People's Education Press Second Grade Mathematics Volume 1
Hebei Education Edition Third Grade Mathematics Volume 1
Beijing Normal University Edition Seventh Grade Mathematics Volume 2
Beijing Normal University Edition Fifth Grade Mathematics Volume 1
Qingdao Edition Seventh Grade Mathematics Volume 1
Beijing Normal University Edition Eighth Grade Mathematics Volume 1
Hebei Education Edition Seventh Grade Mathematics Volume 2
People's Education High School Mathematics Edition B Compulsory Course 2
Jiangsu Education Edition Fourth Grade Mathematics Volume 1
People's Education Press First Grade Mathematics Volume 2
Qingdao Edition Seventh Grade Mathematics Volume 2
Beijing Normal University Edition Fifth Grade Mathematics Volume 2

| Category | Format | Size |
|---|---|---|
| Beijing Normal University eighth grade mathematics volume 2 | pptx | 6 MB |

"Data Fluctuations" Data Collection and Processing PPT Courseware
2024-09-28
Copyright statement: This material is compiled and released by the user of Daoge Resources. The copyright belongs to the author. For commercial use, please contact the copyright owner. If there is any infringement, please contact the webmaster to remove the resource.
Download Points: 0.00
Free Download
Upgrade VIP
Favorite
Views: 2824 / Downloads: 943
Description
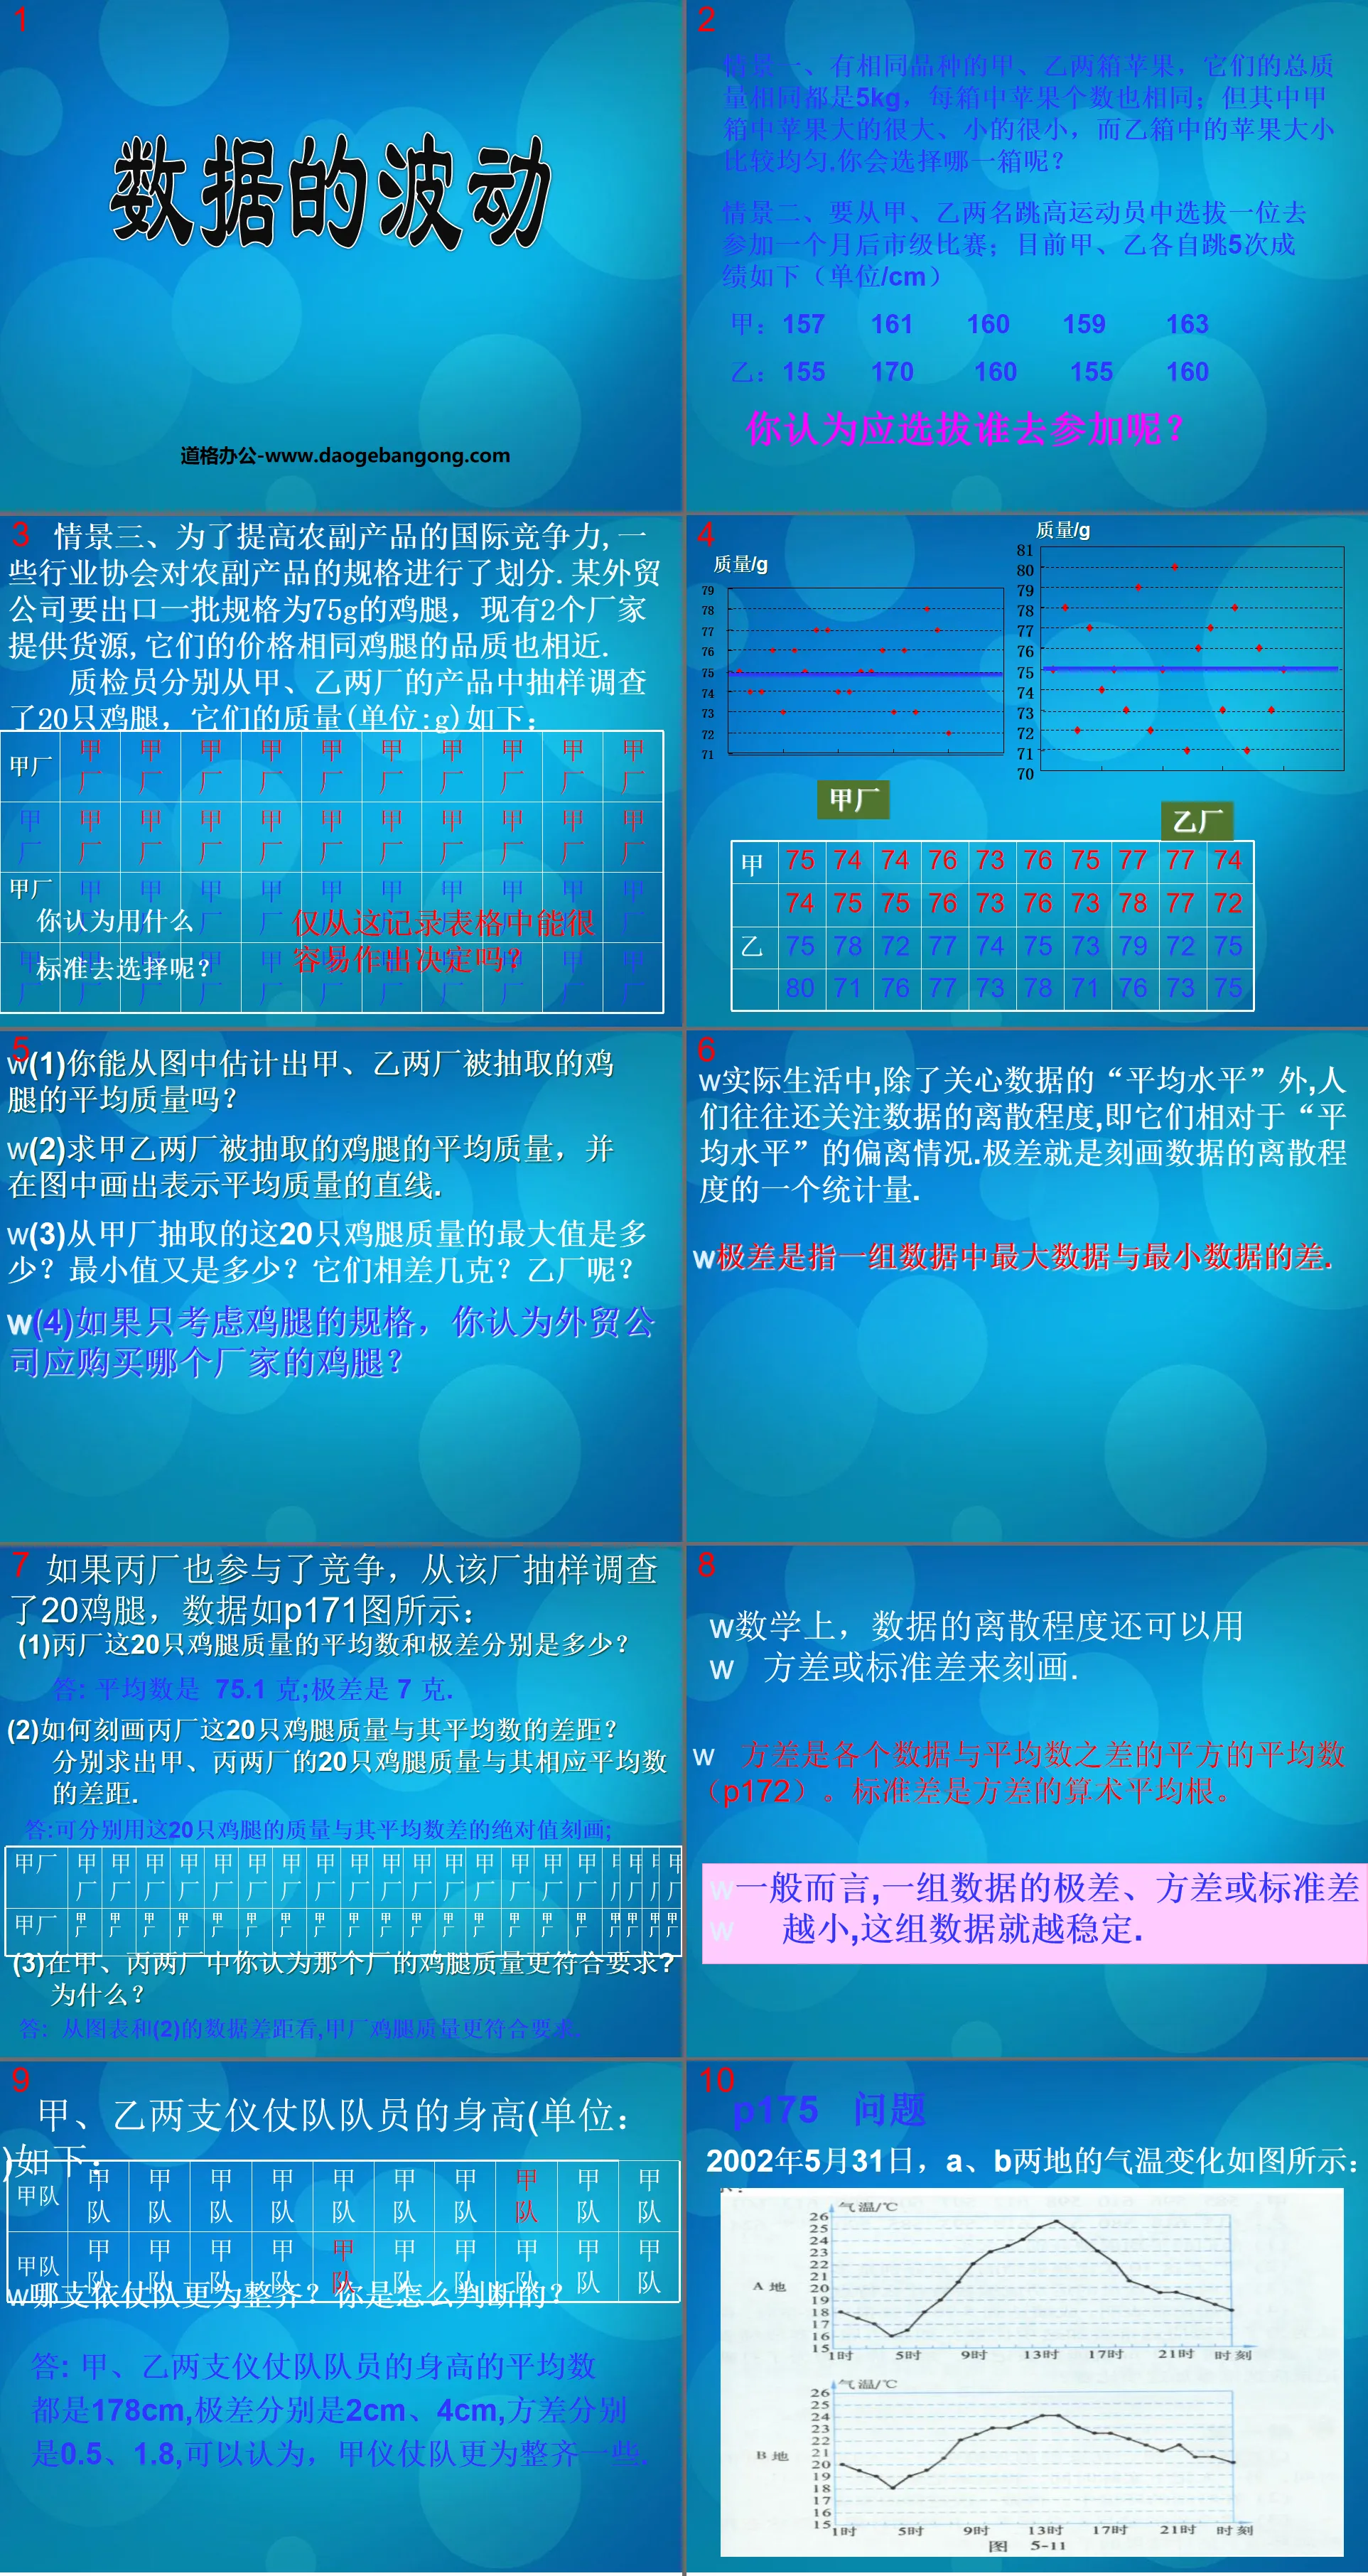
"Data Fluctuations" Data Collection and Processing PPT Courseware
Scenario 1. There are two boxes of apples of the same variety, A and B. Their total mass is the same, 5kg, and the number of apples in each box is also the same; but the apples in box A are very large and the small apples are very small, while the apples in box B are very small. The apples in the box are relatively uniform in size. Which box will you choose?
Scenario 2: One of the two high jumpers A and B is to be selected to participate in the municipal competition one month later. Currently, A and B each jump 5 times and the results are as follows (unit/cm)
A: 157 161 160 159 163
B: 155 170 160 155 160
Who do you think should be selected to participate?
Scenario 3. In order to improve the international competitiveness of agricultural and sideline products, some industry associations have divided the specifications of agricultural and sideline products. A foreign trade company wants to export a batch of 75g chicken legs. There are currently two manufacturers providing supply, and their prices are the same. The quality is also similar.
The quality inspector sampled 20 chicken legs from the products of factories A and B respectively. Their mass (unit: g) is as follows:
(1) Can you estimate the average mass of chicken legs sampled from factories A and B from the picture?
(2) Find the average mass of chicken legs sampled from factories A and B, and draw a straight line representing the average mass on the graph.
(3) What is the maximum mass of the 20 chicken legs sampled from Factory A? What is the minimum value? How many grams are they different? What about Factory B?
(4) If you only consider the specifications of chicken legs, which manufacturer of chicken legs do you think a foreign trade company should buy?
In real life, in addition to caring about the "average level" of data, people often also pay attention to the degree of dispersion of data, that is, their deviation from the "average level". Range is a statistic that describes the degree of dispersion of data.
Range refers to the difference between the largest data and the smallest data in a set of data.
Discuss
A school wants to select one of two athletes A and B to participate in an inter-school competition. In the last 10 trials, their results (unit: cm) are as follows:
A: 585 596 610 598 612
597 604 600 613 601
B: 613 618 580 574 618
593 585 590 598 624
practice
There are two students in a class, A and B. Their five math test scores in a certain semester are as follows:
A: 76 84 80 87 73
B: 78 82 79 80 81
Which student’s math scores are stable?
Keywords: data collection and processing teaching courseware, data fluctuation teaching courseware, Beijing Normal University edition eighth grade mathematics volume 2 PPT courseware, eighth grade mathematics slide courseware download, data collection and processing PPT courseware download, data fluctuation PPT Courseware download, .ppt format
For more information about the PPT courseware "Data Collection and Processing Data Fluctuation", please click the Data Collection and Processing ppt Data Fluctuation ppt tag.
"Data Fluctuation" Data Collection and Processing PPT Courseware 3:
"Data Fluctuation" Data Collection and Processing PPT Courseware 3 Problem Situation In order to improve the international competitiveness of agricultural and sideline products, some industry associations have divided the planning of agricultural and sideline products. A foreign trade company wants to export a batch of 75g chicken legs. There are currently 2 manufacturers providing...
"Data Fluctuations" Data Collection and Processing PPT Courseware 2:
"Data Fluctuation" Data Collection and Processing PPT Courseware 2 Courseware Description This lesson is to understand the necessity and importance of analyzing the fluctuation degree of a set of data in a specific problem situation, by analyzing the scatter points of two sets of data with close averages Graphical representation, intuitively feel the data wave...
File Info
Update Time: 2024-09-28
This template belongs to Mathematics courseware Beijing Normal University eighth grade mathematics volume 2 industry PPT template
"Data Fluctuations" Data Collection and Processing PPT Courseware Simple campus recruitment activity planning plan summary enterprise and institution recruitment publicity lecture PPT template is a general PPT template for business post competition provided by the manuscript PPT, simple campus recruitment activity planning plan summary enterprise and institution recruitment promotion Lecture PPT template, you can edit and modify the text and pictures in the source file by downloading the source file. If you want more exquisite business PPT templates, you can come to grid resource. Doug resource PPT, massive PPT template slide material download, we only make high-quality PPT templates!
Tips: If you open the template and feel that it is not suitable for all your needs, you can search for related content "Data Fluctuations" Data Collection and Processing PPT Courseware is enough.
How to use the Windows system template
Directly decompress the file and use it with office or wps
How to use the Mac system template
Directly decompress the file and use it Office or wps can be used
Related reading
For more detailed PPT-related tutorials and font tutorials, you can view: Click to see
How to create a high-quality technological sense PPT? 4 ways to share the bottom of the box
Notice
Do not download in WeChat, Zhihu, QQ, built-in browsers, please use mobile browsers to download! If you are a mobile phone user, please download it on your computer!
1. The manuscript PPT is only for study and reference, please delete it 24 hours after downloading.
2. If the resource involves your legitimate rights and interests, delete it immediately.
3. Contact information: service@daogebangong.com
"Data Fluctuations" Data Collection and Processing PPT Courseware, due to usage restrictions, it is only for personal study and reference use. For commercial use, please go to the relevant official website for authorization.
(Personal non-commercial use refers to the use of this font to complete the display of personal works, including but not limited to the design of personal papers, resumes, etc.)
Preview
Related Search:
"Data Fluctuations" Data Collection and Processing PPT Courseware
2024-09-28
Copyright statement: This material is compiled and released by the user of Daoge Resources. The copyright belongs to the author. For commercial use, please contact the copyright owner. If there is any infringement, please contact the webmaster to remove the resource.
Download Points: 0.00
Free Download
Upgrade VIP
Favorite
Views: 2824 / Downloads: 943


