| Category | Format | Size |
|---|---|---|
| Beijing Normal University eighth grade first volume mathematics | pptx | 6 MB |

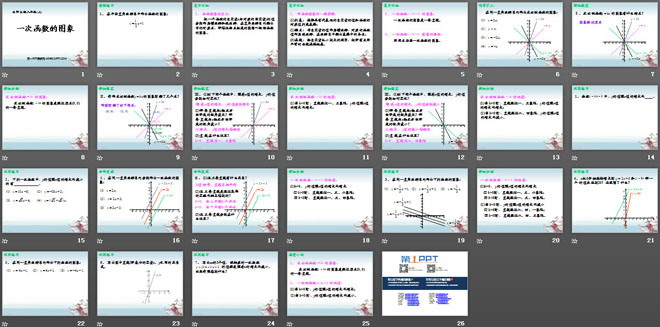
"Graphic of a linear function" linear function PPT courseware 4
Description
"Graphic of a linear function" linear function PPT courseware 4
1. Definition of function graph:
Take the values of the independent variable x and the corresponding dependent variable y of a function as the abscissa and ordinate respectively, and draw its corresponding points in the rectangular coordinate system. The resulting graph composed of these points is called the image of the function.
2. General steps for making function graphs:
(1) List: Select the representative independent variable values and the corresponding values of the function to form a table;
(2) Draw points: Use the value of the independent variable as the abscissa, the corresponding function value as the ordinate, and draw each point in the table in the coordinate system;
(3) Connection: Connect all points with a smooth curve in the order of independent variables from small to large.
New knowledge exploration
(1) In the following two functions, as the value of x increases, how do the values of y change?
As the value of x increases, the value of y increases respectively
(2) Which straight line forms the largest acute angle with the positive direction of the x-axis? Which straight line makes the smallest acute angle with the positive x-axis?
The larger the |k|, the faster the y value increases.
(3) Where is the straight line?
k>0, the straight line passes through the first and third quadrants
Properties of the proportional example function y=kx:
(1) When k>0, the straight line passes through the first and third quadrants, and the value of y increases as the value of x increases;
(2) When k<0, the straight line passes through the second and fourth quadrants, and the value of y decreases as the value of x increases.
Properties of the linear function y=kx+b:
(1)k>0, the value of y increases as the value of x increases
① When b>0, the straight line passes through the first, third, and second quadrants;
②When b<0, the straight line passes through the first, third and fourth quadrants.
(2) When k<0, the value of y decreases as the value of x increases.
① When b>0, the straight line passes through the second, fourth, and first quadrants;
②When b<0, the straight line passes through the second, fourth and third quadrants.
Keywords: linear function courseware, image courseware of a linear function, Beijing Normal University edition eighth grade mathematics volume PPT courseware, eighth grade mathematics slide courseware download, primary function PPT courseware download, image of a linear function PPT courseware download, .ppt Format
For more information about the PPT courseware "Graphic of a linear function and the image of a linear function", please click the "Graphic of a linear function ppt ppt" tag.
"Graphic of a linear function" linear function PPT courseware 5:
"Image of a linear function" linear function PPT courseware 5 Definition of a linear function: If the relationship between two variables x and y can be expressed in the form of (k, b are constants, k0), then y is said to be linear Function where x is the independent variable and y is the dependent variable. In particular, when b=0..
"Graphic of a linear function" linear function PPT courseware 3:
"The Image of a First-Time Function" First-time Function PPT Courseware 3 One day, Xiao Ming went to school at a speed of 80 meters/min. Five minutes after leaving home, Xiao Ming's father found that Xiao Ming did not bring his Chinese books, so he immediately went to school at a speed of 120 meters/min. Going to chase Xiao Ming, what is the distance S (meters) between Xiao Ming and...
"Graphic of a linear function" linear function PPT courseware 2:
"Graph of a linear function" PPT courseware of linear function 2 Recall 1. How many steps are there to make a graph of a function? List, draw points, connect lines 2. What are the characteristics of the graph of a linear function? The graph of a linear function is a straight line, where the graph of a proportional function passes through the origin (0, 0..
File Info
Update Time: 2024-07-04
This template belongs to Mathematics courseware Beijing Normal University eighth grade first volume mathematics industry PPT template
"Graphic of a linear function" linear function PPT courseware 4 Simple campus recruitment activity planning plan summary enterprise and institution recruitment publicity lecture PPT template is a general PPT template for business post competition provided by the manuscript PPT, simple campus recruitment activity planning plan summary enterprise and institution recruitment promotion Lecture PPT template, you can edit and modify the text and pictures in the source file by downloading the source file. If you want more exquisite business PPT templates, you can come to grid resource. Doug resource PPT, massive PPT template slide material download, we only make high-quality PPT templates!
Tips: If you open the template and feel that it is not suitable for all your needs, you can search for related content "Graphic of a linear function" linear function PPT courseware 4 is enough.
How to use the Windows system template
Directly decompress the file and use it with office or wps
How to use the Mac system template
Directly decompress the file and use it Office or wps can be used
Related reading
For more detailed PPT-related tutorials and font tutorials, you can view: Click to see
How to create a high-quality technological sense PPT? 4 ways to share the bottom of the box
Notice
Do not download in WeChat, Zhihu, QQ, built-in browsers, please use mobile browsers to download! If you are a mobile phone user, please download it on your computer!
1. The manuscript PPT is only for study and reference, please delete it 24 hours after downloading.
2. If the resource involves your legitimate rights and interests, delete it immediately.
3. Contact information: service@daogebangong.com
"Graphic of a linear function" linear function PPT courseware 4, due to usage restrictions, it is only for personal study and reference use. For commercial use, please go to the relevant official website for authorization.
(Personal non-commercial use refers to the use of this font to complete the display of personal works, including but not limited to the design of personal papers, resumes, etc.)
Preview
Related Search: