| Category | Format | Size |
|---|---|---|
| Beijing Normal University eighth grade first volume mathematics | pptx | 6 MB |

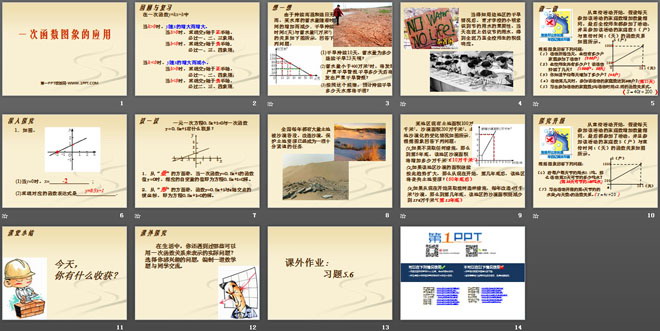
"Application of graphs of linear functions" linear function PPT courseware 3
Description
"Application of graphs of linear functions" linear function PPT courseware 3
In the linear function y=kx+b
When k>0, y increases with the increase of x,
When b>0, the straight line intersecting the y-axis with the positive semi-axis must pass through the first, second, and third quadrants;
When b<0, the straight line intersecting the y-axis at the negative semi-axis must pass through the first, third, and fourth quadrants;
When k<0, y decreases as x increases,
When b>0, the straight line intersecting the y-axis with the positive semi-axis must pass through the first, second, and fourth quadrants;
When b<0, the straight line intersecting the y-axis at the negative semi-axis must pass through the second, third, and fourth quadrants.
think about it
Due to persistent high temperatures and no rain for days, the water storage capacity of a certain reservoir decreased with time. The relationship between drought duration t (days) and water storage volume V (10,000 m3) is shown in the figure below. Answer the following questions:
(1) If the drought lasts for 10 days, how much water will be stored? What about 23 consecutive days of drought?
(2) When the water storage capacity is less than 4 million m3, a severe drought warning will occur. How many days after the drought will a severe drought warning be issued?
(3) According to this rule, how many days will the reservoir be expected to dry up if the drought continues?
From the beginning of the publicity activity, it is assumed that the number of families participating in the activity increases by the same amount every day. Finally, all teachers and students in the school participate in the activity, and the functional relationship between the number of families participating in the activity S (households) and the publicity time t (days) is as shown in the figure Show.
Answer the following questions based on the image:
(1) On the day the activity started, how many families in the school participated in the activity?
(2) How many households are there in total among teachers and students in the school? How many days did the event last?
(3) Do you know how many households are added every day on average?
(4) On what day of the event will the number of families participating in the event reach 800?
(5) Write the functional relationship between the number of families participating in the activity S and the activity time t.
Keywords: primary function courseware, primary function graph application courseware, Beijing Normal University edition eighth grade mathematics volume PPT courseware, eighth grade mathematics slide courseware download, primary function PPT courseware download, primary function graph application PPT courseware download, .ppt format
For more information about the "Application of a linear function and a graph of a linear function" PPT courseware, please click the tag "Application of a linear function ppt and the graph of a linear function" ppt.
"Application of graphs of linear functions" PPT courseware of linear functions 5:
"Application of linear function graphs" linear function PPT courseware 5 Scenario introduction Due to continuous high temperature and no rain for days, the water storage capacity of a certain reservoir decreases with the increase of time. The relationship between drought duration t (days) and water storage volume v (10,000 m3) is shown in the figure. Answer the following questions: ..
"Application of graphs of linear functions" PPT courseware of linear functions 4:
"Application of Linear Function Graphs" Linear Function PPT Courseware 4 As shown in the figure, l1 reflects the relationship between the sales revenue and sales volume of a company's products. Fill in the blanks according to the diagram: (1) When the sales volume is 2 tons, the sales volume Income = ______ yuan; (2) When the sales income is 6,000 yuan..
"Application of graphs of linear functions" PPT courseware of linear functions 2:
"Application of the Graph of a First-Time Function" First-time Function PPT Courseware 2 A farmer brought several kilograms of home-grown potatoes to the city for sale. For convenience, he brought some spare change and sold some at the market price and then sold them at a reduced price. The number of kilograms of potatoes sold. And the amount of money he holds in hand (including spare...
File Info
Update Time: 2024-07-22
This template belongs to Mathematics courseware Beijing Normal University eighth grade first volume mathematics industry PPT template
"Application of graphs of linear functions" linear function PPT courseware 3 Simple campus recruitment activity planning plan summary enterprise and institution recruitment publicity lecture PPT template is a general PPT template for business post competition provided by the manuscript PPT, simple campus recruitment activity planning plan summary enterprise and institution recruitment promotion Lecture PPT template, you can edit and modify the text and pictures in the source file by downloading the source file. If you want more exquisite business PPT templates, you can come to grid resource. Doug resource PPT, massive PPT template slide material download, we only make high-quality PPT templates!
Tips: If you open the template and feel that it is not suitable for all your needs, you can search for related content "Application of graphs of linear functions" linear function PPT courseware 3 is enough.
How to use the Windows system template
Directly decompress the file and use it with office or wps
How to use the Mac system template
Directly decompress the file and use it Office or wps can be used
Related reading
For more detailed PPT-related tutorials and font tutorials, you can view: Click to see
How to create a high-quality technological sense PPT? 4 ways to share the bottom of the box
Notice
Do not download in WeChat, Zhihu, QQ, built-in browsers, please use mobile browsers to download! If you are a mobile phone user, please download it on your computer!
1. The manuscript PPT is only for study and reference, please delete it 24 hours after downloading.
2. If the resource involves your legitimate rights and interests, delete it immediately.
3. Contact information: service@daogebangong.com
"Application of graphs of linear functions" linear function PPT courseware 3, due to usage restrictions, it is only for personal study and reference use. For commercial use, please go to the relevant official website for authorization.
(Personal non-commercial use refers to the use of this font to complete the display of personal works, including but not limited to the design of personal papers, resumes, etc.)
Preview
Related Search: