Western Normal University Edition First Grade Mathematics Volume 1
Beijing Normal University Edition Seventh Grade Mathematics Volume 1
People's Education Press First Grade Mathematics Volume 1
People's Education Press Second Grade Mathematics Volume 1
People's Education Press Third Grade Mathematics Volume 1
Hebei Education Edition Third Grade Mathematics Volume 1
Beijing Normal University Edition Seventh Grade Mathematics Volume 2
Beijing Normal University Edition Fifth Grade Mathematics Volume 1
Qingdao Edition Seventh Grade Mathematics Volume 1
Hebei Education Edition Seventh Grade Mathematics Volume 2
Beijing Normal University Edition Eighth Grade Mathematics Volume 1
People's Education High School Mathematics Edition B Compulsory Course 2
Jiangsu Education Edition Fourth Grade Mathematics Volume 1
People's Education Press First Grade Mathematics Volume 2
Qingdao Edition Seventh Grade Mathematics Volume 2
Beijing Normal University Edition Fifth Grade Mathematics Volume 2

| Category | Format | Size |
|---|---|---|
| Beijing Normal University eighth grade first volume mathematics | pptx | 6 MB |

"Analyzing the Central Trend of Data from Statistical Charts" Data Analysis PPT Courseware
2024-10-01
Copyright statement: This material is compiled and released by the user of Daoge Resources. The copyright belongs to the author. For commercial use, please contact the copyright owner. If there is any infringement, please contact the webmaster to remove the resource.
Download Points: 0.00
Free Download
Upgrade VIP
Favorite
Views: 2349 / Downloads: 96
Description
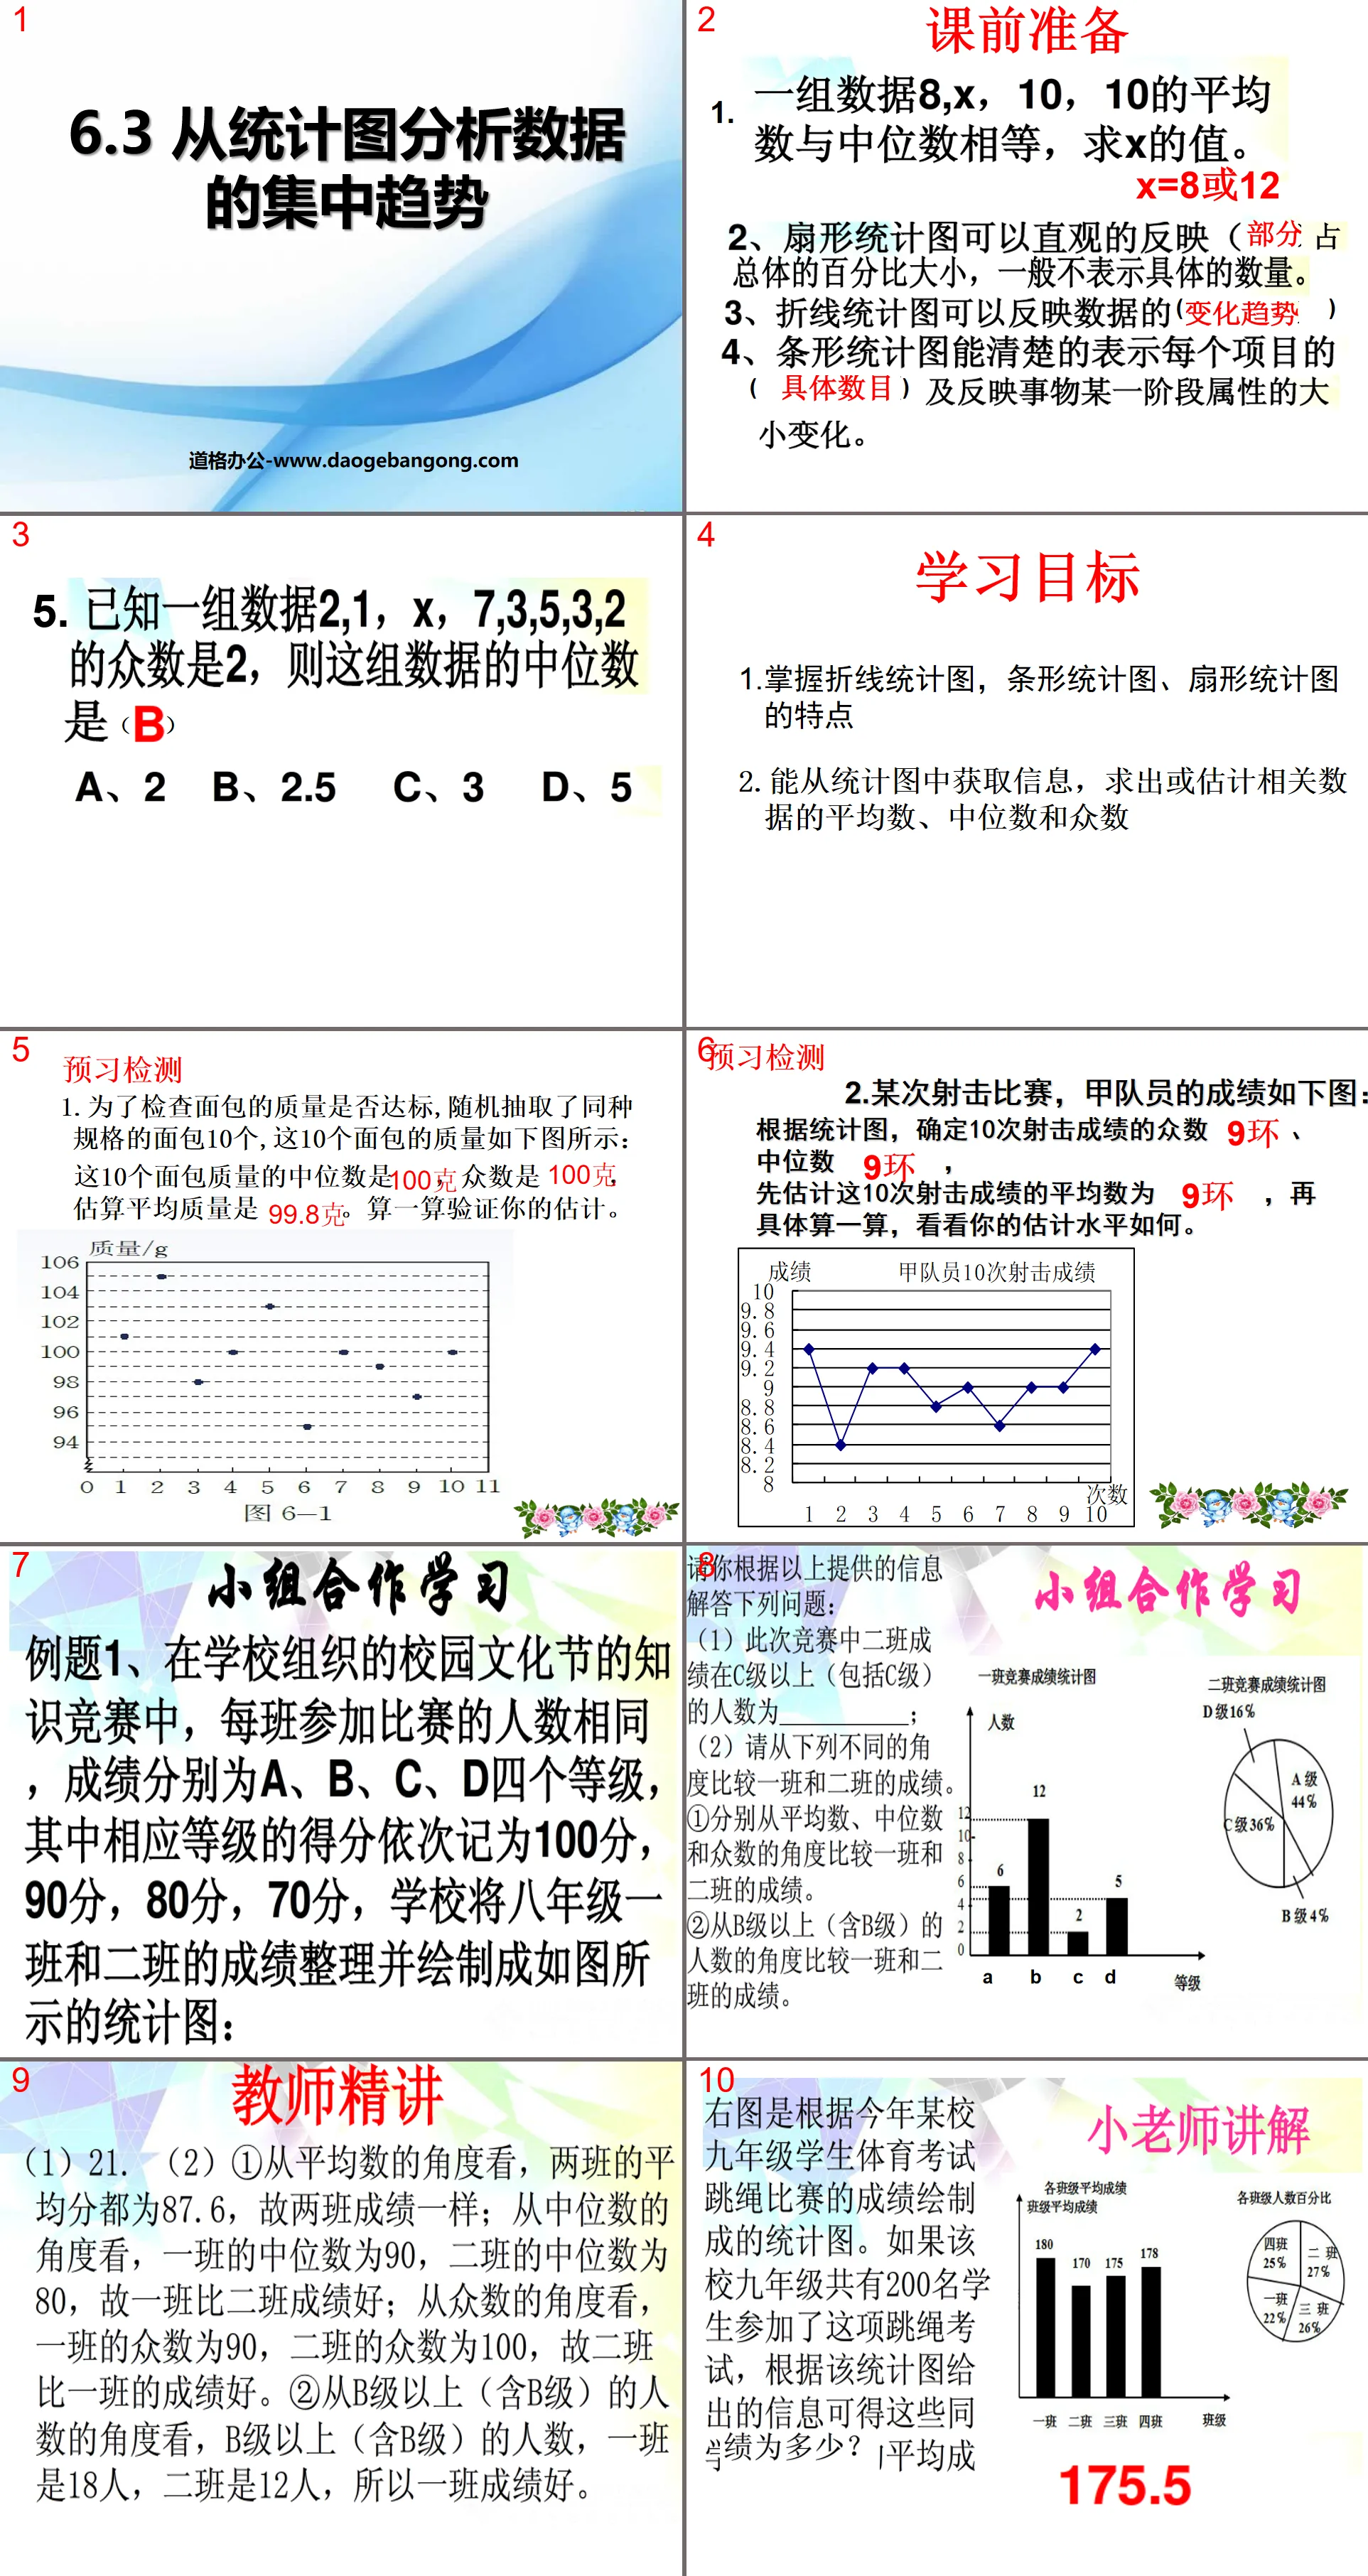
"Analyzing the Central Trend of Data from Statistical Charts" Data Analysis PPT Courseware
learning target
1. Master the characteristics of line charts, bar charts, and sector charts
2. Able to obtain information from statistical charts and find or estimate the average, median and mode of relevant data
Preview test
1. In order to check whether the quality of bread meets the standard, 10 breads of the same specification were randomly selected. The quality of these 10 breads is as shown in the figure below: The median of the quality of these 10 breads is ____, and the mode is ____ , the estimated average quality is ____. Do the math to verify your estimate.
2. In a certain shooting competition, the results of Team A are as follows: According to the statistical chart, determine the mode ____ and median ____ of the 10 shooting results. First estimate the average of these 10 shooting results as ____, and then Do the math specifically to see how good your estimate is.
Inquiry Outline
1. Study "Discussion" on page 145 of the textbook.
Requirements: Answer the questions raised by "Yiyiyi" based on the given graphics.
The three youth volleyball teams A, B, and C each have 12 members. The ages of the members of the three teams are as follows:
2. The picture below is a statistical chart of the sales volume of sports shoes in a certain shopping mall in one day. In a set of data consisting of the sizes of these sports shoes, the mode and median are ( ) respectively
A. 25,25B. 25,24.5 C. 24.5,25 D. 24.5,24.5
Classroom testing
1. The highest temperature statistics for each day of the week in our city are as follows:
(1) Write the median and mode of this set of data;
(2) Find the average of this set of data.
2. A traffic manager made statistics on the number of people who ran red lights at an intersection in the city center on Sunday. Based on the number of people who ran red lights in each time period from 7:00 to 12:00 a.m. (one hour is a time period), he produced a As shown in the bar chart shown in the figure, the mode and median of the number of red light runners in each time period are ( )
A. 15,15 B. 10,15 C. 15,20 D. 10,20
3. A stationery store owner purchased a batch of stationery boxes with different prices. Their prices are 10 yuan, 20 yuan, 30 yuan, 40 yuan and 50 yuan respectively. The sales situation is as shown in the figure.
The average, mode and median selling prices of this batch of stationery boxes are ____, ____ and ____ respectively.
Keywords: data analysis courseware, analyzing the central tendency of data from statistical graphs courseware, Beijing Normal University edition eighth grade mathematics volume PPT courseware, eighth grade mathematics slide courseware download, data analysis PPT courseware download, analyzing data from statistical graphs Central tendency PPT courseware download, .ppt format
For more information about the PPT courseware "Data Analysis to Analyze the Central Tendency of Data from Statistical Charts", please click the Data Analysis ppt to Analyze the Central Tendency of Data from Statistical Charts ppt tag.
"Analyzing the Central Trend of Data from Statistical Charts" Data Analysis PPT Courseware 2:
"Analyzing the Central Trend of Data from Statistical Charts" Data Analysis PPT Courseware 2 Teaching Objectives: 1. Experience the activities of analyzing the central tendency of data from statistical charts, establish data intuition, and develop geometric intuition. 2. Can be obtained from statistical charts such as bar charts and fan charts.
File Info
Update Time: 2024-10-01
This template belongs to Mathematics courseware Beijing Normal University eighth grade first volume mathematics industry PPT template
"Analyzing the Central Trend of Data from Statistical Charts" Data Analysis PPT Courseware Simple campus recruitment activity planning plan summary enterprise and institution recruitment publicity lecture PPT template is a general PPT template for business post competition provided by the manuscript PPT, simple campus recruitment activity planning plan summary enterprise and institution recruitment promotion Lecture PPT template, you can edit and modify the text and pictures in the source file by downloading the source file. If you want more exquisite business PPT templates, you can come to grid resource. Doug resource PPT, massive PPT template slide material download, we only make high-quality PPT templates!
Tips: If you open the template and feel that it is not suitable for all your needs, you can search for related content "Analyzing the Central Trend of Data from Statistical Charts" Data Analysis PPT Courseware is enough.
How to use the Windows system template
Directly decompress the file and use it with office or wps
How to use the Mac system template
Directly decompress the file and use it Office or wps can be used
Related reading
For more detailed PPT-related tutorials and font tutorials, you can view: Click to see
How to create a high-quality technological sense PPT? 4 ways to share the bottom of the box
Notice
Do not download in WeChat, Zhihu, QQ, built-in browsers, please use mobile browsers to download! If you are a mobile phone user, please download it on your computer!
1. The manuscript PPT is only for study and reference, please delete it 24 hours after downloading.
2. If the resource involves your legitimate rights and interests, delete it immediately.
3. Contact information: service@daogebangong.com
"Analyzing the Central Trend of Data from Statistical Charts" Data Analysis PPT Courseware, due to usage restrictions, it is only for personal study and reference use. For commercial use, please go to the relevant official website for authorization.
(Personal non-commercial use refers to the use of this font to complete the display of personal works, including but not limited to the design of personal papers, resumes, etc.)
Preview
Related Search:
"Analyzing the Central Trend of Data from Statistical Charts" Data Analysis PPT Courseware
2024-10-01
Copyright statement: This material is compiled and released by the user of Daoge Resources. The copyright belongs to the author. For commercial use, please contact the copyright owner. If there is any infringement, please contact the webmaster to remove the resource.
Download Points: 0.00
Free Download
Upgrade VIP
Favorite
Views: 2349 / Downloads: 96


