Western Normal University Edition First Grade Mathematics Volume 1
Beijing Normal University Edition Seventh Grade Mathematics Volume 1
People's Education Press First Grade Mathematics Volume 1
People's Education Press Second Grade Mathematics Volume 1
People's Education Press Third Grade Mathematics Volume 1
Hebei Education Edition Third Grade Mathematics Volume 1
Beijing Normal University Edition Seventh Grade Mathematics Volume 2
Beijing Normal University Edition Fifth Grade Mathematics Volume 1
Qingdao Edition Seventh Grade Mathematics Volume 1
Hebei Education Edition Seventh Grade Mathematics Volume 2
Beijing Normal University Edition Eighth Grade Mathematics Volume 1
People's Education High School Mathematics Edition B Compulsory Course 2
Jiangsu Education Edition Fourth Grade Mathematics Volume 1
People's Education Press First Grade Mathematics Volume 2
Qingdao Edition Seventh Grade Mathematics Volume 2
Beijing Normal University Edition Fifth Grade Mathematics Volume 2

| Category | Format | Size |
|---|---|---|
| Beijing Normal University eighth grade first volume mathematics | pptx | 6 MB |

"Analyzing the Central Trend of Data from Statistical Charts" Data Analysis PPT Courseware 2
2024-10-01
Copyright statement: This material is compiled and released by the user of Daoge Resources. The copyright belongs to the author. For commercial use, please contact the copyright owner. If there is any infringement, please contact the webmaster to remove the resource.
Download Points: 0.00
Free Download
Upgrade VIP
Favorite
Views: 3505 / Downloads: 332
Description
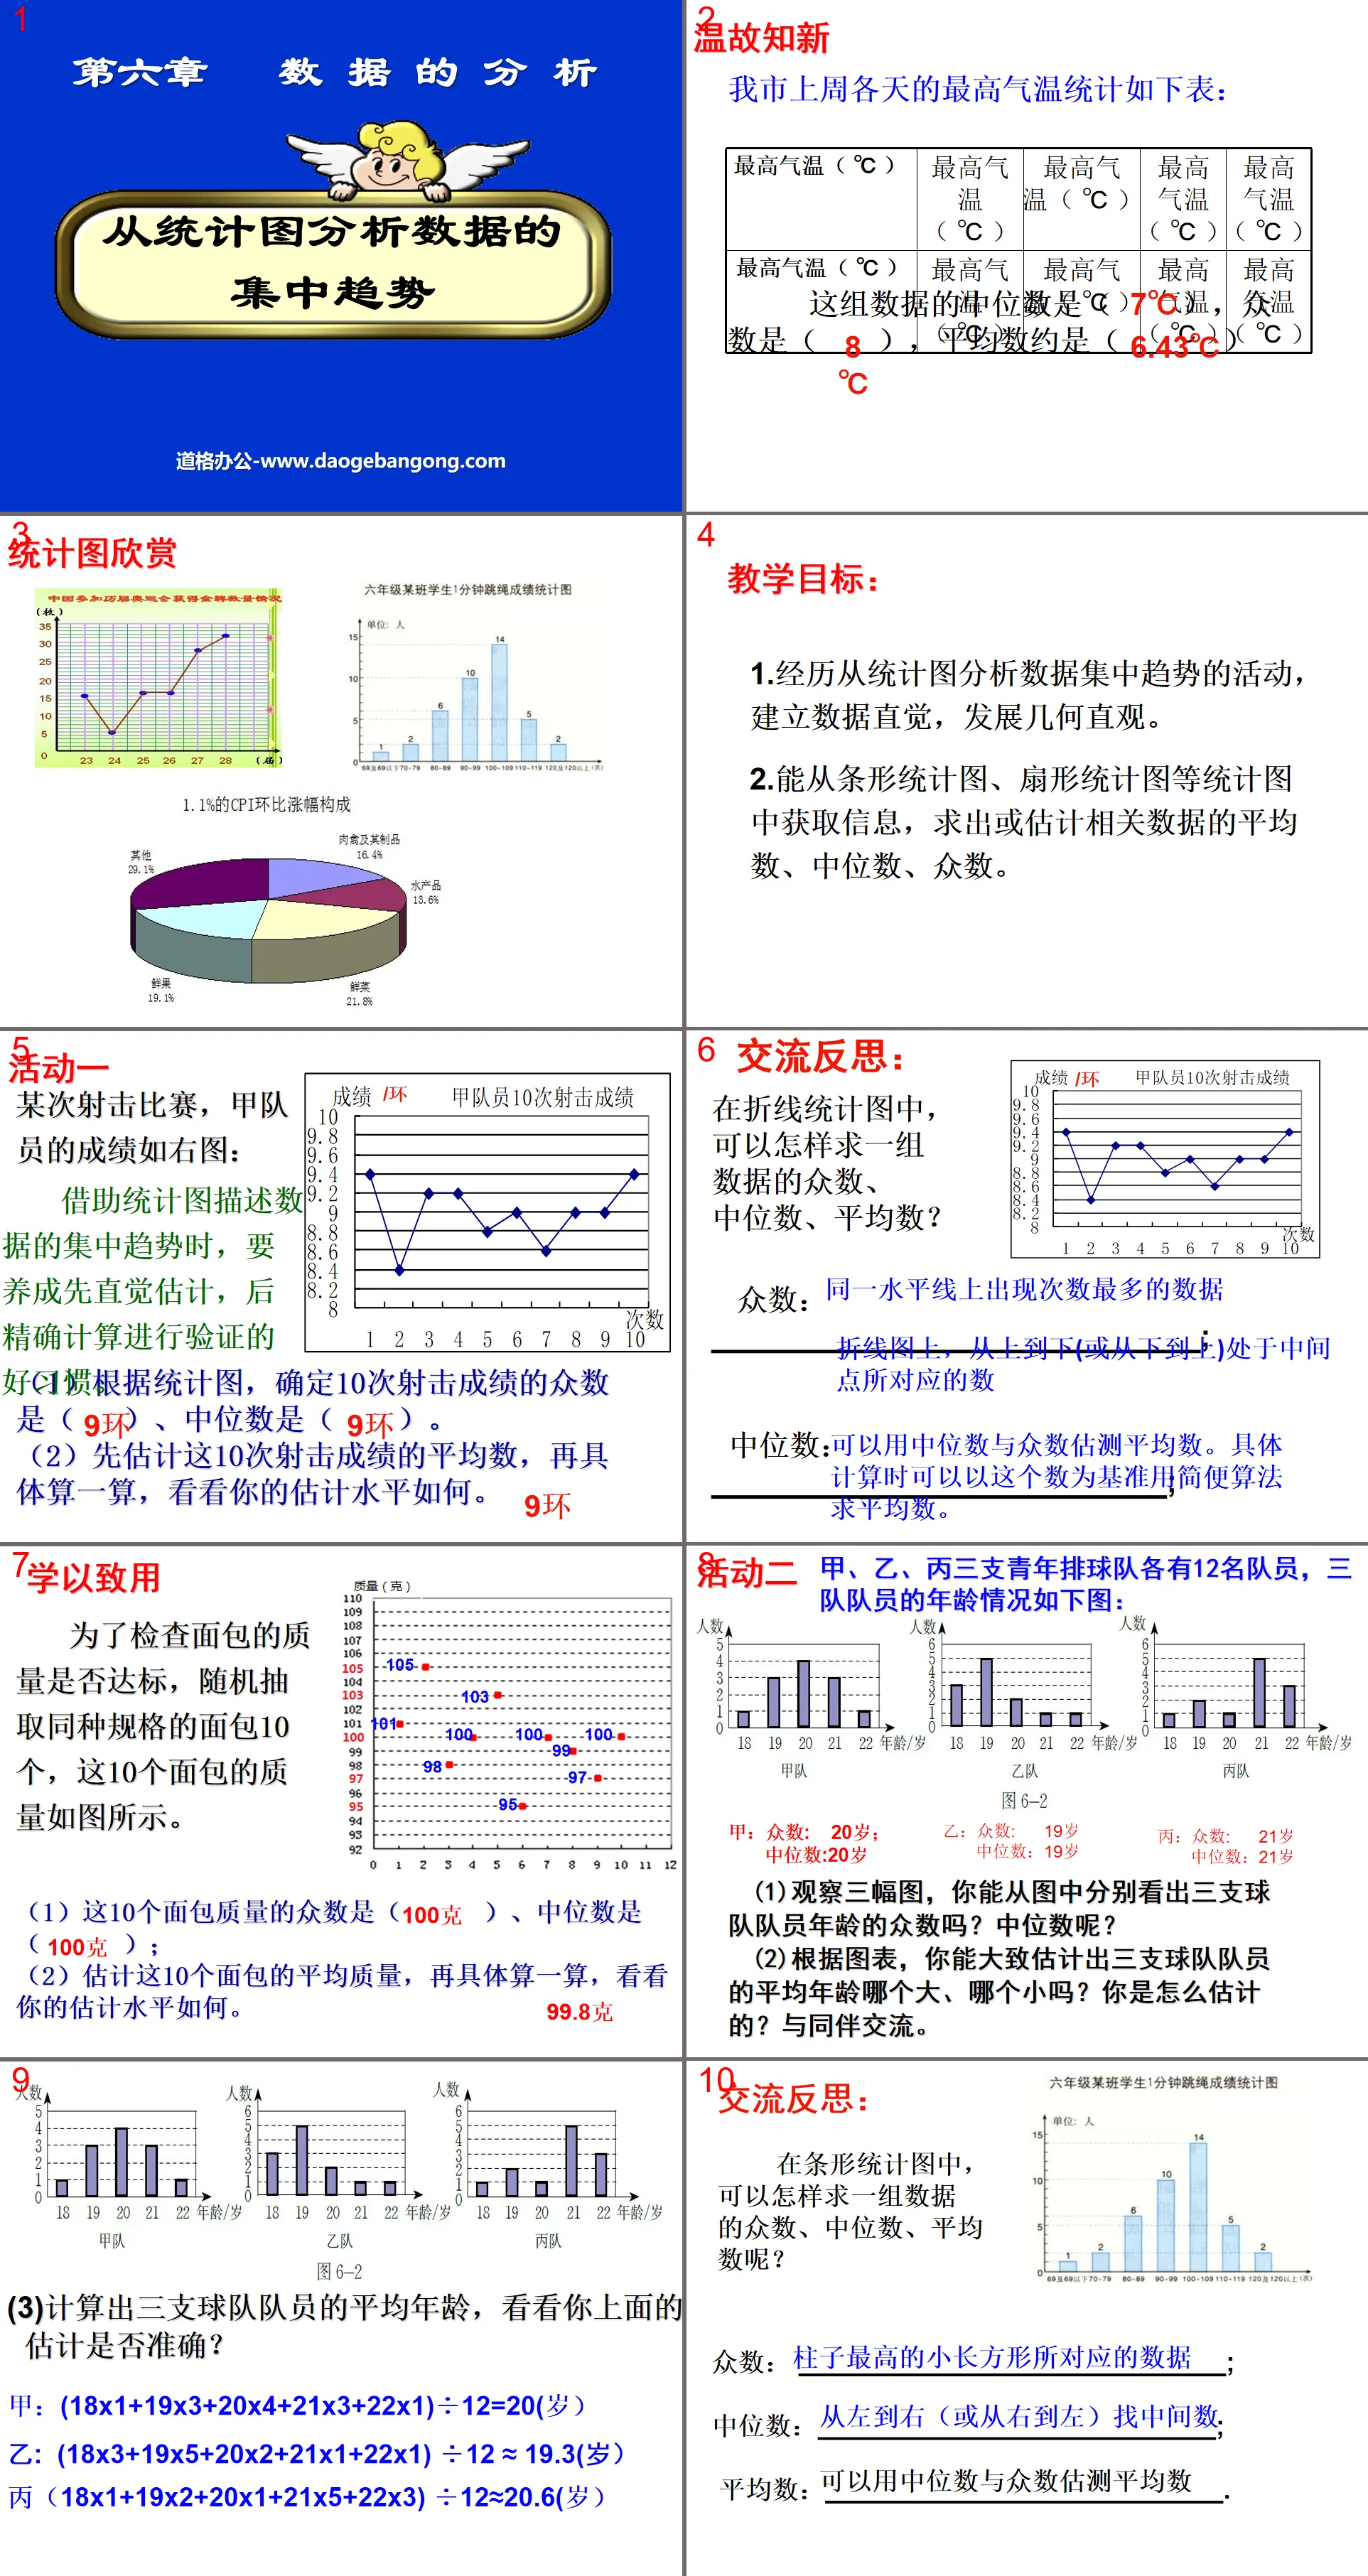
"Analyzing the Central Trend of Data from Statistical Charts" Data Analysis PPT Courseware 2
teaching objectives:
1. Experience the activities of analyzing data concentration trends from statistical charts, build data intuition, and develop geometric intuition.
2. Able to obtain information from statistical charts such as bar charts and fan charts, and find or estimate the average, median, and mode of relevant data.
In a certain shooting competition, team A’s results are as shown on the right:
When describing the central tendency of data with the help of statistical charts, it is necessary to develop a good habit of making intuitive estimates first and then verifying them with precise calculations.
(1) According to the statistical chart, determine the mode of the 10 shooting results is ( ) and the median is ( ).
(2) First estimate the average of these 10 shooting results, and then do the calculations to see how good your estimate is.
In a line chart, how can you find the mode, median, and mean of a set of data?
Mode: ____________________________;
median:___________________________;
Average:___________________________.
In order to check whether the quality of the bread meets the standard, 10 breads of the same size are randomly selected. The quality of these 10 breads is as shown in the figure.
(1) The mode of the quality of these 10 breads is ( ) and the median is ( );
(2) Estimate the average quality of these 10 loaves of bread, and then calculate it specifically to see how good your estimate is.
Gain insights
What did you gain from studying this lesson? Please talk about how to obtain information from statistical charts such as bar charts and fan charts, and find or estimate the average, median, and mode of relevant data.
(1) In the line chart,
Mode: the data that appears most frequently on the same horizontal line;
Median: Find the number corresponding to the middle point from top to bottom (or bottom to top);
Mean: The mean can be estimated using the median and mode.
(2) In the bar chart,
Mode: It is the data with the highest column;
Median: Find the middle number from left to right (or right to left);
Mean: The mean can be estimated using the median and mode.
(3) In the fan chart,
Mode: the data with the largest sector area;
Median: In order, look at the corresponding percentages, the average of the 50% and 51% data;
Average: Can be calculated using weighted average.
Keywords: data analysis courseware, analyzing the central tendency of data from statistical graphs courseware, Beijing Normal University edition eighth grade mathematics volume PPT courseware, eighth grade mathematics slide courseware download, data analysis PPT courseware download, analyzing data from statistical graphs Central tendency PPT courseware download, .ppt format
For more information about the PPT courseware "Data Analysis to Analyze the Central Tendency of Data from Statistical Charts", please click the Data Analysis ppt to Analyze the Central Tendency of Data from Statistical Charts ppt tag.
"Analyzing the Central Trend of Data from Statistical Charts" Data Analysis PPT Courseware:
"Analyzing the Central Trend of Data from Statistical Charts" Data Analysis PPT Courseware Learning Objectives 1. Master the characteristics of line statistical charts, bar statistical charts, and sector statistical charts 2. Be able to obtain information from statistical charts and find or estimate relevant data The mean, median and mode of ..
File Info
Update Time: 2024-10-01
This template belongs to Mathematics courseware Beijing Normal University eighth grade first volume mathematics industry PPT template
"Analyzing the Central Trend of Data from Statistical Charts" Data Analysis PPT Courseware 2 Simple campus recruitment activity planning plan summary enterprise and institution recruitment publicity lecture PPT template is a general PPT template for business post competition provided by the manuscript PPT, simple campus recruitment activity planning plan summary enterprise and institution recruitment promotion Lecture PPT template, you can edit and modify the text and pictures in the source file by downloading the source file. If you want more exquisite business PPT templates, you can come to grid resource. Doug resource PPT, massive PPT template slide material download, we only make high-quality PPT templates!
Tips: If you open the template and feel that it is not suitable for all your needs, you can search for related content "Analyzing the Central Trend of Data from Statistical Charts" Data Analysis PPT Courseware 2 is enough.
How to use the Windows system template
Directly decompress the file and use it with office or wps
How to use the Mac system template
Directly decompress the file and use it Office or wps can be used
Related reading
For more detailed PPT-related tutorials and font tutorials, you can view: Click to see
How to create a high-quality technological sense PPT? 4 ways to share the bottom of the box
Notice
Do not download in WeChat, Zhihu, QQ, built-in browsers, please use mobile browsers to download! If you are a mobile phone user, please download it on your computer!
1. The manuscript PPT is only for study and reference, please delete it 24 hours after downloading.
2. If the resource involves your legitimate rights and interests, delete it immediately.
3. Contact information: service@daogebangong.com
"Analyzing the Central Trend of Data from Statistical Charts" Data Analysis PPT Courseware 2, due to usage restrictions, it is only for personal study and reference use. For commercial use, please go to the relevant official website for authorization.
(Personal non-commercial use refers to the use of this font to complete the display of personal works, including but not limited to the design of personal papers, resumes, etc.)
Preview
Related Search:
"Analyzing the Central Trend of Data from Statistical Charts" Data Analysis PPT Courseware 2
2024-10-01
Copyright statement: This material is compiled and released by the user of Daoge Resources. The copyright belongs to the author. For commercial use, please contact the copyright owner. If there is any infringement, please contact the webmaster to remove the resource.
Download Points: 0.00
Free Download
Upgrade VIP
Favorite
Views: 3505 / Downloads: 332


