Western Normal University Edition First Grade Mathematics Volume 1
Beijing Normal University Edition Seventh Grade Mathematics Volume 1
People's Education Press First Grade Mathematics Volume 1
People's Education Press Second Grade Mathematics Volume 1
Beijing Normal University Edition Seventh Grade Mathematics Volume 2
People's Education Press Third Grade Mathematics Volume 1
Beijing Normal University Edition Eighth Grade Mathematics Volume 1
Qingdao Edition Seventh Grade Mathematics Volume 1
Beijing Normal University Edition Fifth Grade Mathematics Volume 1
Hebei Education Edition Third Grade Mathematics Volume 1
Hebei Education Edition Seventh Grade Mathematics Volume 2
People's Education Press First Grade Mathematics Volume 2
People's Education High School Mathematics Edition B Compulsory Course 2
Qingdao Edition Seventh Grade Mathematics Volume 2
Beijing Normal University Edition Fifth Grade Mathematics Volume 2
Hebei Education Edition Fourth Grade Mathematics Volume 2

| Category | Format | Size |
|---|---|---|
| People's Education Press Eighth Grade Mathematics Volume 1 | pptx | 6 MB |
Description
"Image of Function" First-time Function PPT Courseware 2
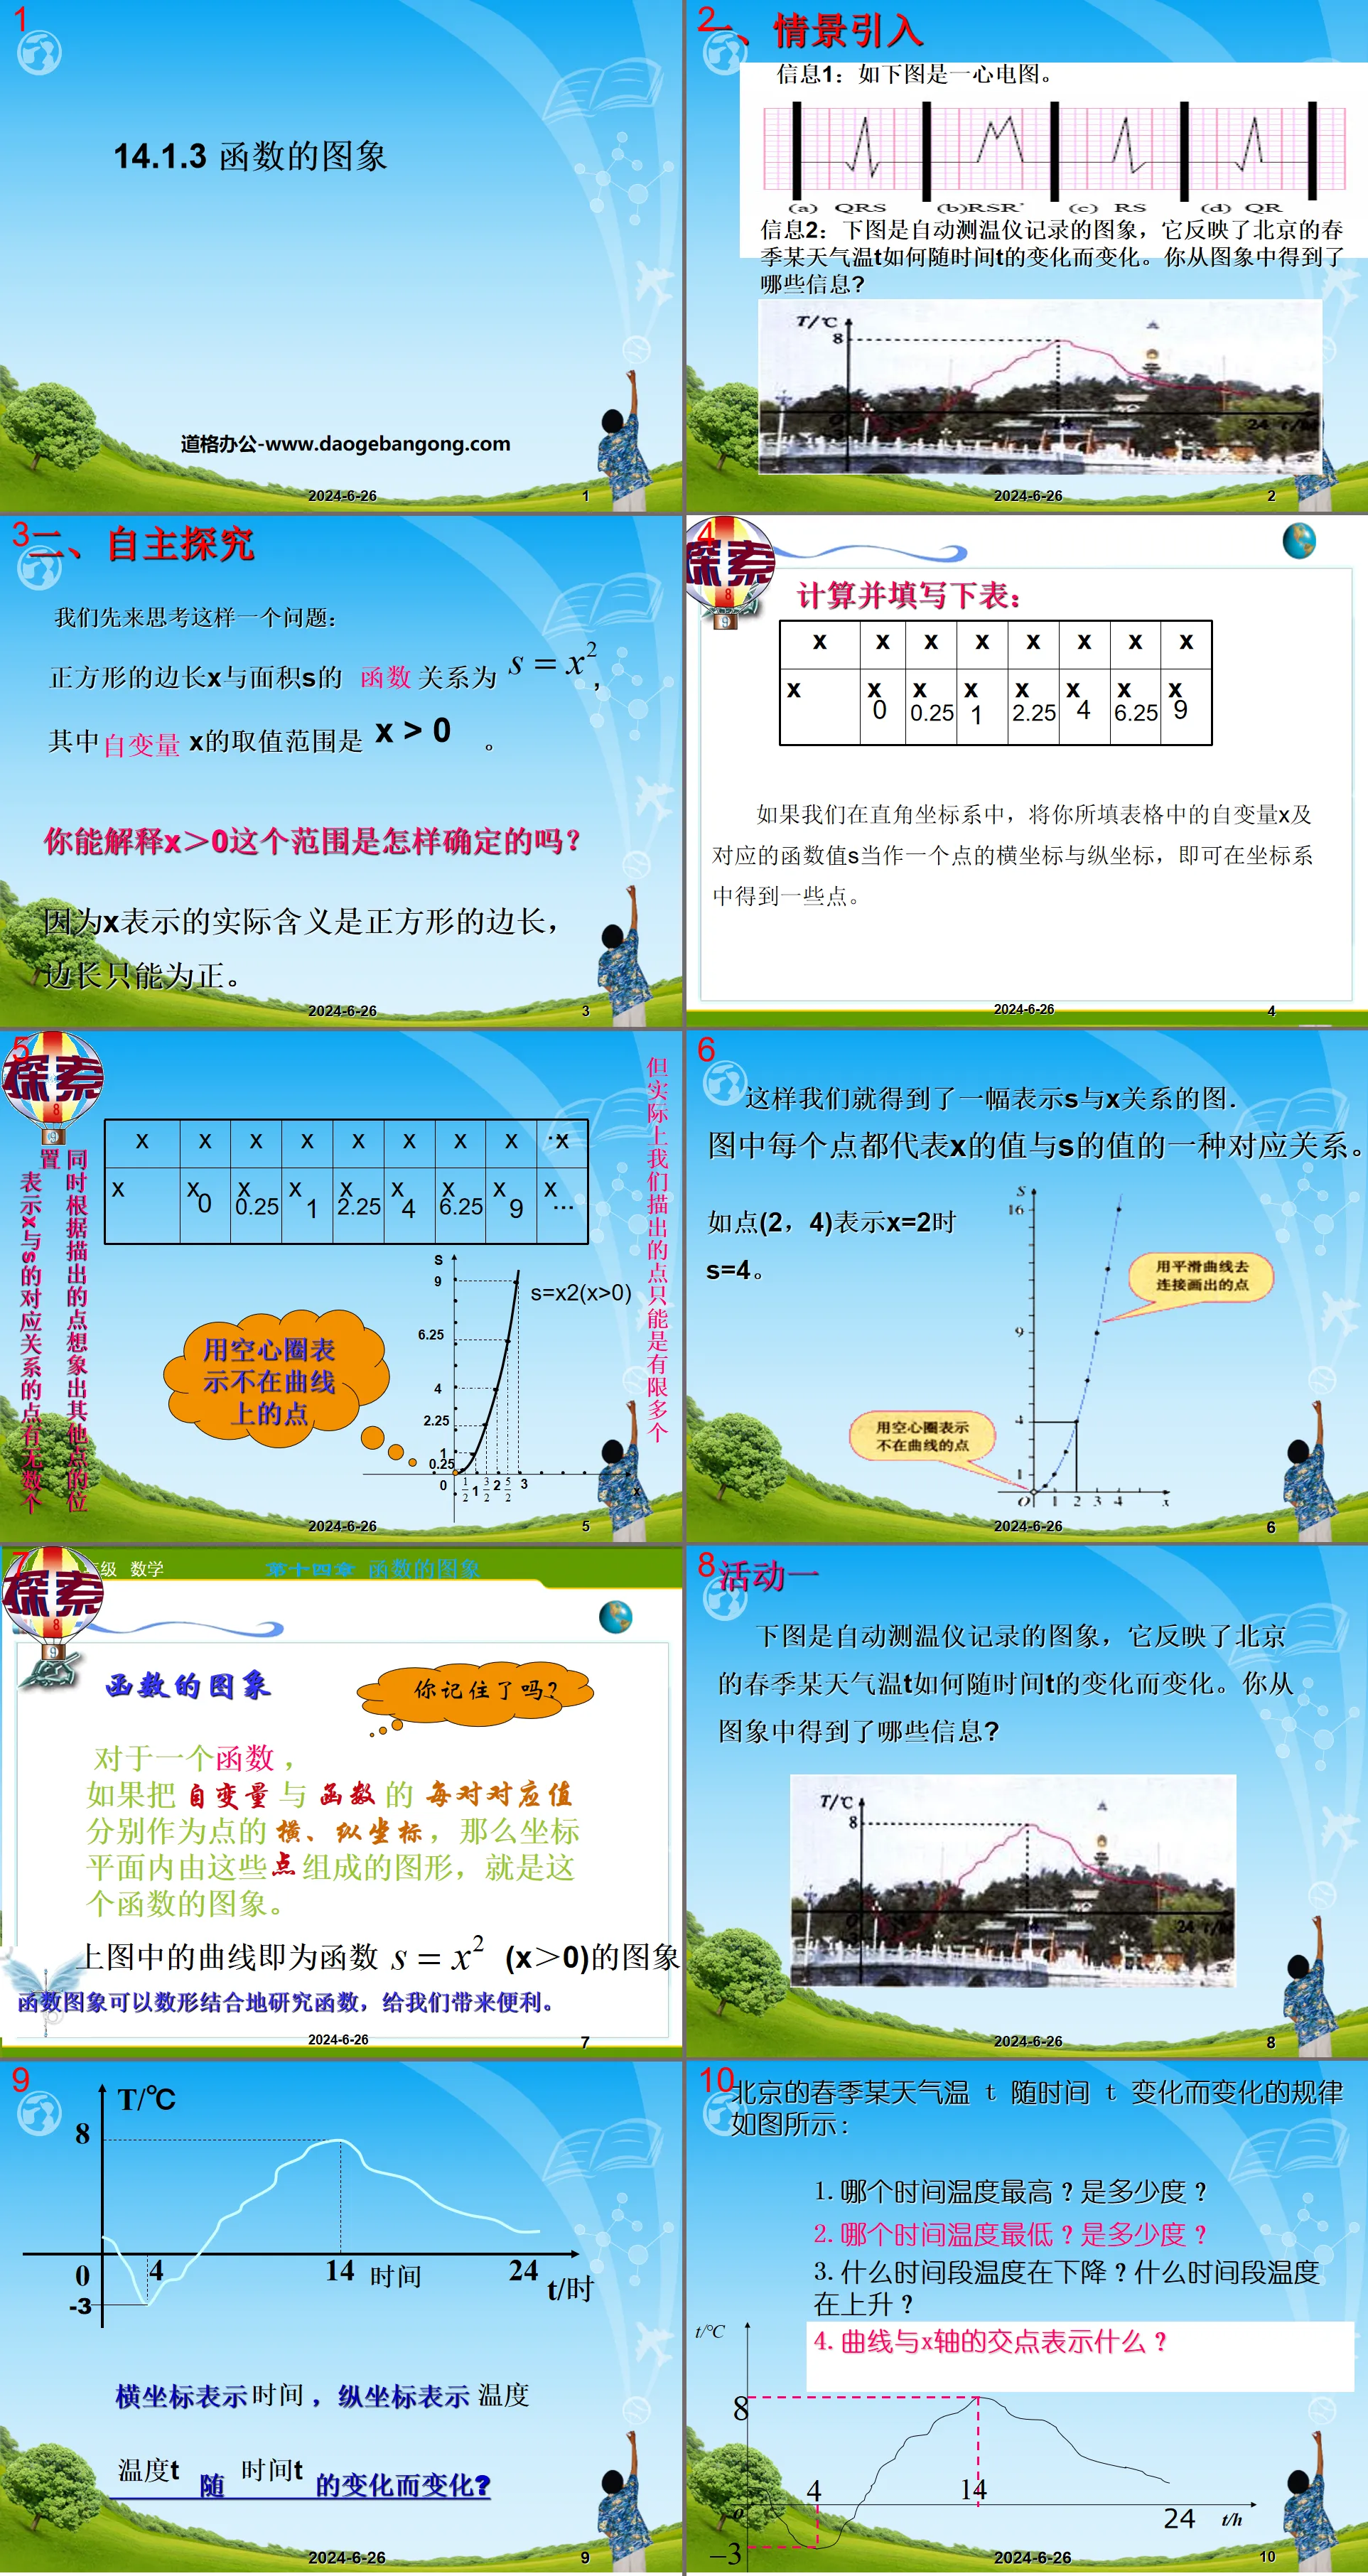
Let’s first think about this question:
The functional relationship between the side length x and the area S of the square is S=X²,
The value range of the independent variable x is x > 0.
Can you explain how the range x>0 is determined?
Because the actual meaning expressed by x is the side length of the square, the side length can only be positive.
For a function, if each pair of corresponding values of the independent variable and the function is used as the horizontal and vertical coordinates of the point, then the graph composed of these points in the coordinate plane is the image of the function.
The curve in the above figure is the image of the function S=X² (x>0).
Activity conclusion:
1. Each time t in a day has a unique temperature T corresponding to it. It can be considered that the temperature T is a function of time t.
2. The lowest temperature of this day was -3℃ at 4 am, and the highest temperature was 8℃ at 14:00.
3. The temperature decreases from 0 o'clock to 4 o'clock, that is, the temperature decreases with the increase of time. The temperature rises from 4:00 to 14:00, and drops again from 14:00 to 24:00.
4. We can intuitively see from the image how the temperature changes throughout the day and what the temperature is approximately at any time.
5. If we observe such temperature images for a long time, we can get more information and understand more temperature change patterns.
We have learned how to observe and analyze image information through two activities. Now we will conduct consolidation exercises to see if you can read the information in the function graph quickly, comprehensively and accurately.
Let us summarize the general steps for drawing the graph of a function using the point drawing method.
Step one: list. Select some values within the value range of the independent variable. Find the corresponding function values through functional relationship expressions and list them in a table.
Step 2: Draw points. In the rectangular coordinate system, with the value of the independent variable as the abscissa and the corresponding function value as the ordinate, draw the corresponding points in the table.
Step 3: Connect. Connect all points with smooth curves in order of coordinates from small to large.
Summary and improvement
1. The horizontal and vertical coordinates of the points on the function graph correspond to the independent variable value and the function value respectively.
2. The key to studying practical problems from the information obtained from the function graph is to distinguish the actual meaning of the horizontal and vertical axes.
Keywords: One-time function courseware, image courseware of function, New People's Education Edition eighth-grade mathematics PPT courseware, eighth-grade mathematics slide courseware download, one-time function PPT courseware download, image of function PPT courseware download, .ppt format
For more information about the "Graph of a linear function function" PPT courseware, please click on the image ppt tag of a linear function ppt function.
"Graphics and Properties of Quadratic Functions" PPT:
"Image and Properties of Quadratic Functions" PPT Part One: Knowledge Review: 1. Image and properties of parabola y=a(x-h)2+k: 1. When a�0, the opening _______, when a�0 When, the opening _______, 2. The axis of symmetry is _______; 3. The coordinates of the vertex are..
Download the PPT courseware of "The Image and Properties of a Linear Function":
"The Image and Properties of a Linear Function" PPT courseware download part one content: The image of a function takes the values of the independent variable x and the corresponding dependent variable y of a function as the abscissa and ordinate of the point respectively, and depicts them in the rectangular coordinate system Its corresponding points, all these point groups..
"Image and Properties of a Linear Function" PPT download:
"Image and Properties of a linear function" PPT download Part 1: Learning objectives 1. Master the drawing method of the image of a linear function, and get a preliminary feel for its image. 2. Further understand the concepts and images of proportional functions and linear functions in the comparison of special and general key points..
File Info
Update Time: 2024-11-22
This template belongs to Mathematics courseware People's Education Press Eighth Grade Mathematics Volume 1 industry PPT template
"Image of Function" First-time Function PPT Courseware 2 Simple campus recruitment activity planning plan summary enterprise and institution recruitment publicity lecture PPT template is a general PPT template for business post competition provided by the manuscript PPT, simple campus recruitment activity planning plan summary enterprise and institution recruitment promotion Lecture PPT template, you can edit and modify the text and pictures in the source file by downloading the source file. If you want more exquisite business PPT templates, you can come to grid resource. Doug resource PPT, massive PPT template slide material download, we only make high-quality PPT templates!
Tips: If you open the template and feel that it is not suitable for all your needs, you can search for related content "Image of Function" First-time Function PPT Courseware 2 is enough.
How to use the Windows system template
Directly decompress the file and use it with office or wps
How to use the Mac system template
Directly decompress the file and use it Office or wps can be used
Related reading
For more detailed PPT-related tutorials and font tutorials, you can view: Click to see
How to create a high-quality technological sense PPT? 4 ways to share the bottom of the box
Notice
Do not download in WeChat, Zhihu, QQ, built-in browsers, please use mobile browsers to download! If you are a mobile phone user, please download it on your computer!
1. The manuscript PPT is only for study and reference, please delete it 24 hours after downloading.
2. If the resource involves your legitimate rights and interests, delete it immediately.
3. Contact information: service@daogebangong.com
"Image of Function" First-time Function PPT Courseware 2, due to usage restrictions, it is only for personal study and reference use. For commercial use, please go to the relevant official website for authorization.
(Personal non-commercial use refers to the use of this font to complete the display of personal works, including but not limited to the design of personal papers, resumes, etc.)
Preview


