Western Normal University Edition First Grade Mathematics Volume 1
Beijing Normal University Edition Seventh Grade Mathematics Volume 1
People's Education Press First Grade Mathematics Volume 1
People's Education Press Second Grade Mathematics Volume 1
Beijing Normal University Edition Seventh Grade Mathematics Volume 2
People's Education Press Third Grade Mathematics Volume 1
Beijing Normal University Edition Eighth Grade Mathematics Volume 1
Qingdao Edition Seventh Grade Mathematics Volume 1
Beijing Normal University Edition Fifth Grade Mathematics Volume 1
Hebei Education Edition Third Grade Mathematics Volume 1
Hebei Education Edition Seventh Grade Mathematics Volume 2
People's Education Press First Grade Mathematics Volume 2
People's Education High School Mathematics Edition B Compulsory Course 2
Qingdao Edition Seventh Grade Mathematics Volume 2
Beijing Normal University Edition Fifth Grade Mathematics Volume 2
Hebei Education Edition Fourth Grade Mathematics Volume 2
| Category | Format | Size |
|---|---|---|
| People's Education Press Seventh Grade Mathematics Volume 2 | pptx | 6 MB |

"Statistical Survey" data collection, arrangement and description PPT courseware 5
2024-11-25
Copyright statement: This material is compiled and released by the user of Daoge Resources. The copyright belongs to the author. For commercial use, please contact the copyright owner. If there is any infringement, please contact the webmaster to remove the resource.
Download Points: 0.00
Free Download
Upgrade VIP
Favorite
Views: 4408 / Downloads: 342
Description
"Statistical Survey" data collection, arrangement and description PPT courseware 5
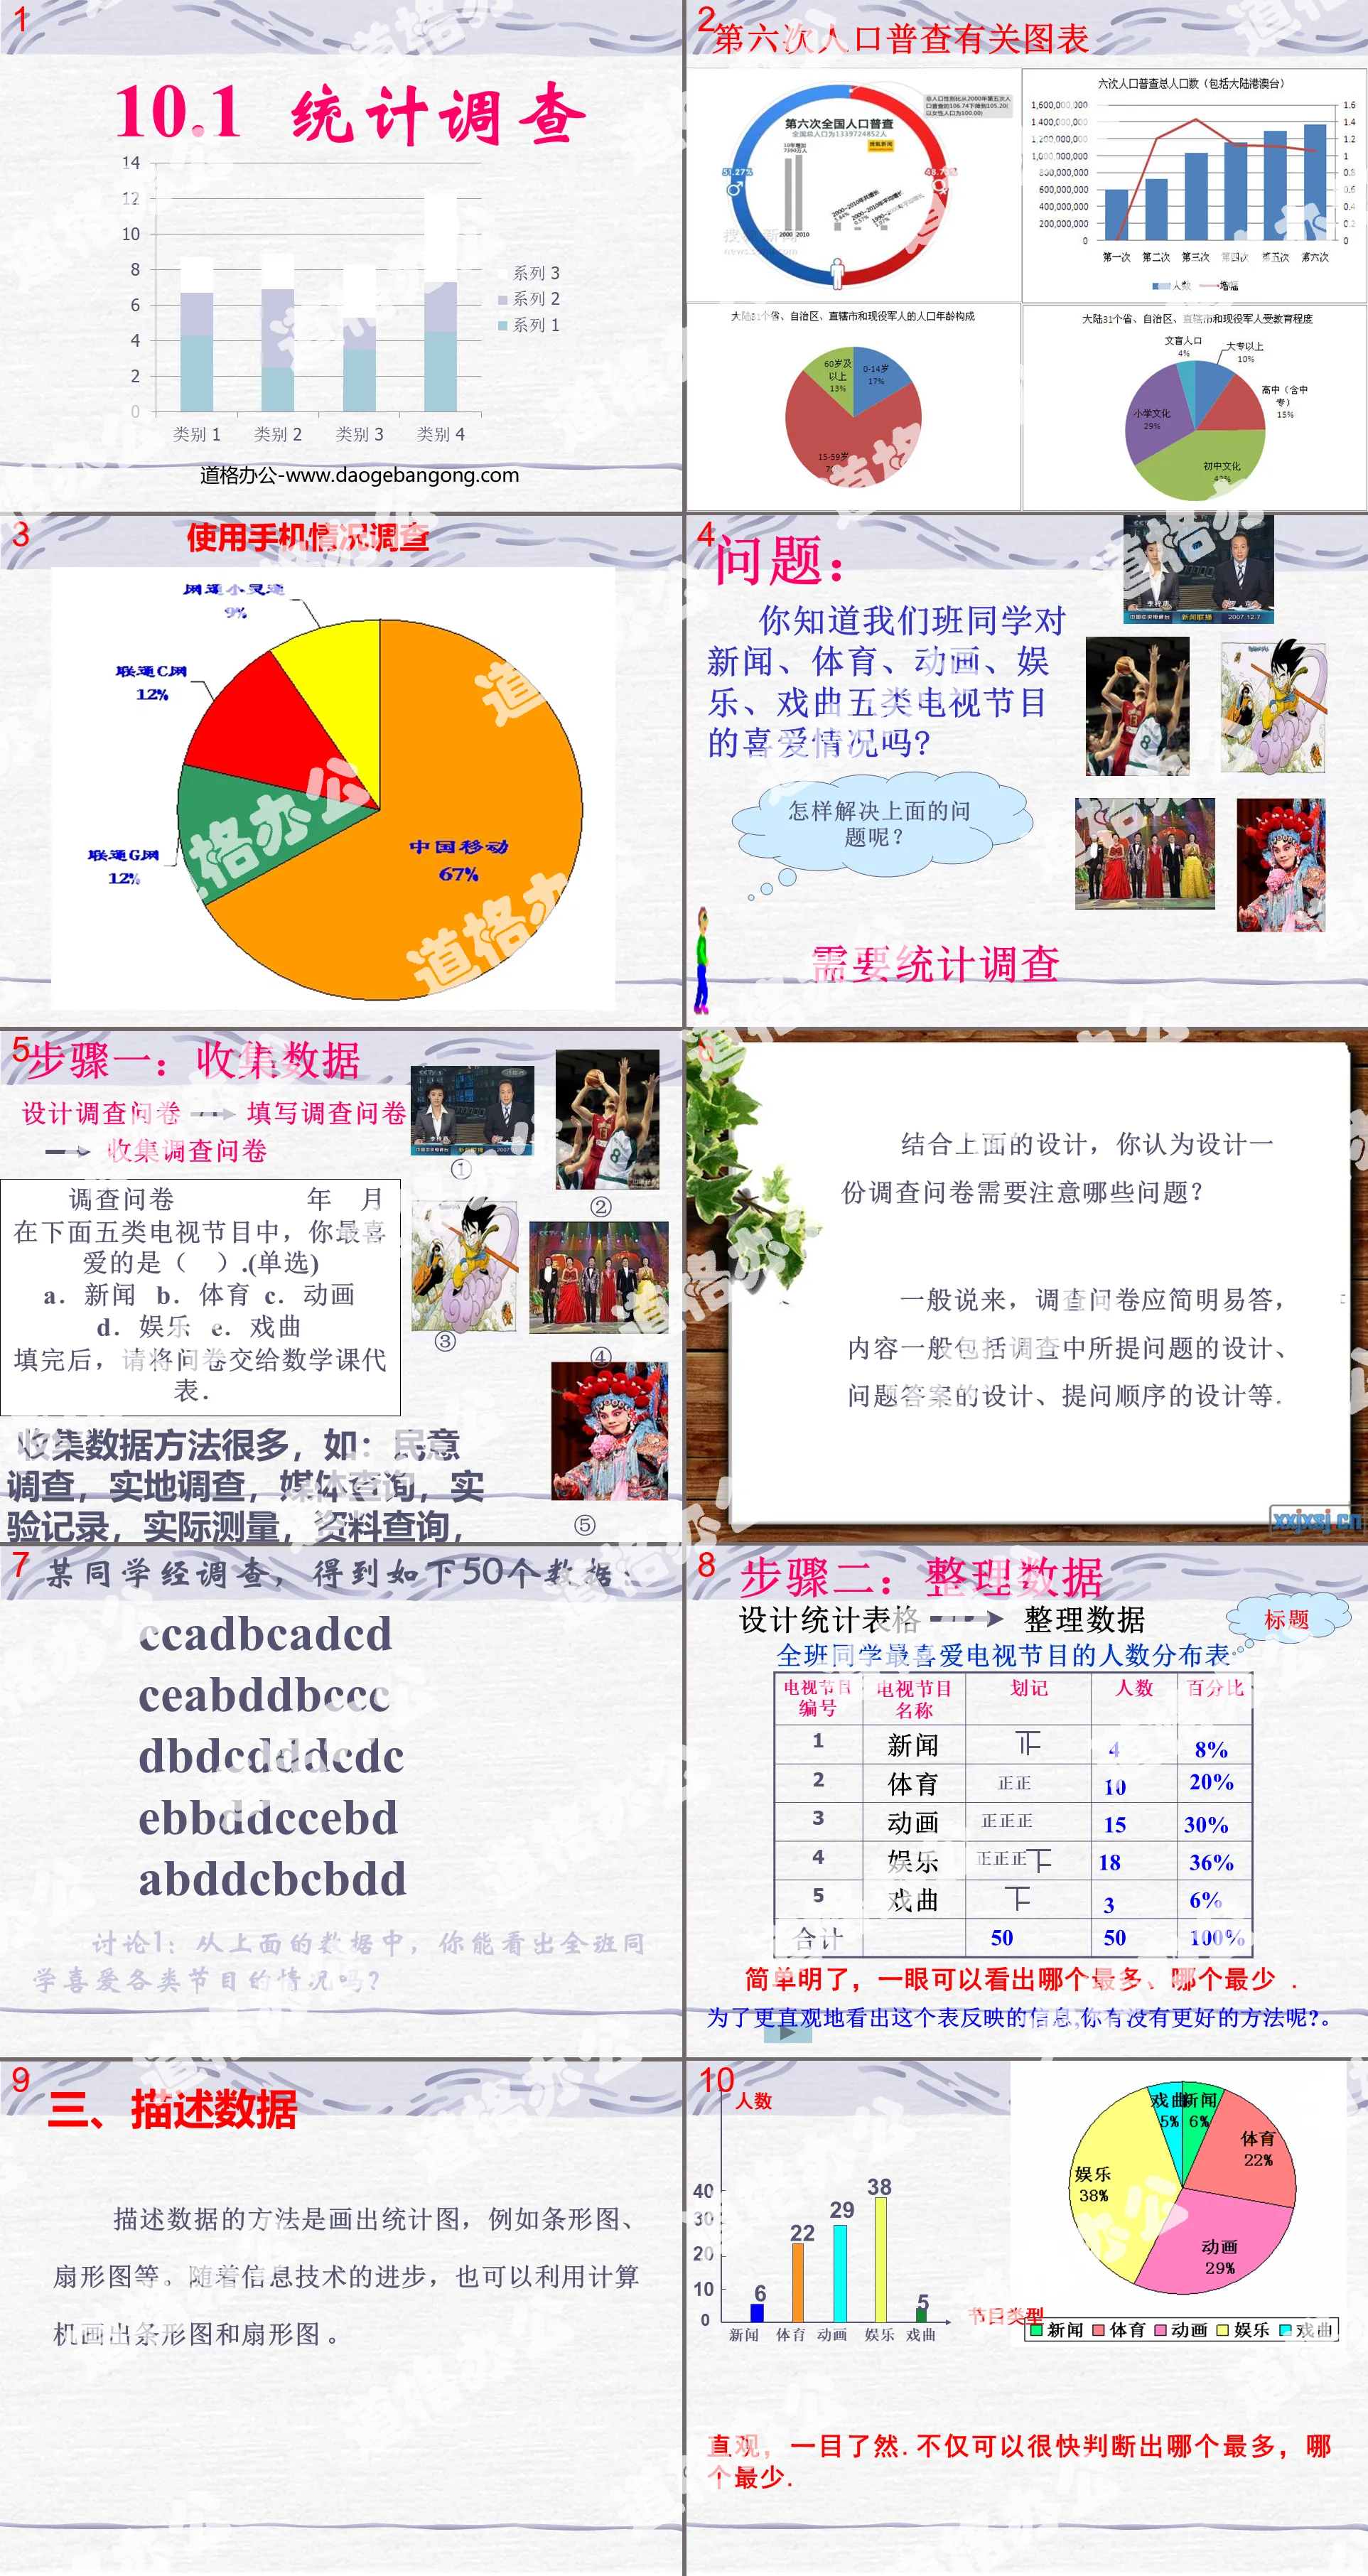
Step 1: Collect data
Questionnaire year month
Among the following five types of TV programs, which one is your favorite ( ). (Single choice)
A. News b. Sports c. animation d. entertainment e. drama
After filling out, please give the questionnaire to the math class representative.
There are many methods for collecting data, such as: public opinion surveys, field surveys, media inquiries, experimental records, actual measurements, data inquiries, visit surveys, and questionnaire surveys.
Based on the above design, what issues do you think need to be paid attention to when designing a questionnaire?
Generally speaking, questionnaires should be concise and easy to answer. The content generally includes the design of the questions asked in the survey, the design of the answers to the questions, the design of the order of questions, etc.
Describe data
The way to describe data is to draw statistical charts, such as bar charts, fan charts, etc. With the advancement of information technology, computers can also be used to draw bar charts and fan charts.
analyze data
1. What information can you get from these two statistical charts?
2. What is the difference between these two statistical charts?
The difference: the bar chart can show the number of people who like a specific program, and the fan chart can show the percentage of each type of people to the total number of people.
discuss:
How to draw the corresponding fan chart based on percentages?
What is a fan chart used to describe the percentage of each data to the total?
The relationship between the area of the sector and the central angle
1. The larger the area of the sector, the greater the central angle ( ).
2. What is the relationship between the degree and the percentage of the central angle subtended by the sector?
In the previous activities, the entire class was the entire class we wanted to investigate. We investigated all the subjects. An investigation that examines all the subjects like this is a comprehensive investigation.
1. It is advisable to conduct a comprehensive investigation
①\When the number of individuals in the population is small and the research problem requires real conditions and high accuracy.
②\Investigation work is more convenient and non-destructive
③\When there are special requirements for the survey results, or when the survey results have special significance, such as the national census, we still have to conduct it in the following way.
Consolidation exercise one:
Which of the following surveys are suitable for comprehensive surveys? Which ones are not suitable?
(1) Investigate the ratings of CCTV's "Windmill";
(2) Investigate the favorite colors of my classmates;
(3) Investigate the lethality of a batch of artillery shells;
(4) Investigate the favorite subjects of my classmates;
(5) Investigate the favorite sports activities of my classmates;
Compare who is the best
4. The "First General Report on China's Urban Household Property Survey" released by the National Bureau of Statistics in 2003 shows that as of June 2003, the average value of my country's urban household property exceeded 228,300 yuan. Among them, the average property value of households whose heads have the education level of elementary school, junior high school, high school, or college graduates is as shown in the figure:
①The education level of the head of the household with the most property per household is _______;
②The education level of the household head with the least property per household is _______;
③The education level of household heads above the average line of 228,300 yuan is _______;
Keywords: data collection, arrangement and description teaching courseware, statistical investigation teaching courseware, New People's Education Edition seventh grade mathematics volume 2 PPT courseware, seventh grade mathematics slide courseware download, data collection, arrangement and description PPT courseware download, statistical investigation PPT Courseware download, .ppt format
For more information about the PPT courseware "Data Collection, Arrangement and Description of Statistical Investigation", please click on the "Data Collection, Arrangement and Description of Statistical Investigation ppt" tab.
"Statistical Survey" data collection, organization and description PPT courseware 8:
"Statistical Survey" Data Collection, Arrangement and Description PPT Courseware 8 Learning Objectives 1. Be able to design appropriate survey plans according to specific situations and further understand the importance of the representativeness and breadth of samples in sampling surveys; 2. Understand the three types of statistical graphs Their respective characteristics can be adjusted according to...
"Statistical Survey" data collection, organization and description PPT courseware 7:
"Statistical Survey" Data Collection, Arrangement and Description PPT Courseware 7 Teaching Objectives Knowledge and Abilities 1. Master the method of data collection - questionnaire; 2. Master the methods of data organization - tables; 3. Master the methods of data depiction - bar charts, fan charts...
"Statistical Survey" data collection, organization and description PPT courseware 6:
"Statistical Survey" Data Collection, Arrangement and Description PPT Courseware 6 Concept Formation 1. Sampling survey: collecting data by surveying some objects and estimating the whole situation based on the parts is called sampling survey. 2. Overall: all the objects to be investigated It's called the overall...
File Info
Update Time: 2024-11-25
This template belongs to Mathematics courseware People's Education Press Seventh Grade Mathematics Volume 2 industry PPT template
"Statistical Survey" data collection, arrangement and description PPT courseware 5 Simple campus recruitment activity planning plan summary enterprise and institution recruitment publicity lecture PPT template is a general PPT template for business post competition provided by the manuscript PPT, simple campus recruitment activity planning plan summary enterprise and institution recruitment promotion Lecture PPT template, you can edit and modify the text and pictures in the source file by downloading the source file. If you want more exquisite business PPT templates, you can come to grid resource. Doug resource PPT, massive PPT template slide material download, we only make high-quality PPT templates!
Tips: If you open the template and feel that it is not suitable for all your needs, you can search for related content "Statistical Survey" data collection, arrangement and description PPT courseware 5 is enough.
How to use the Windows system template
Directly decompress the file and use it with office or wps
How to use the Mac system template
Directly decompress the file and use it Office or wps can be used
Related reading
For more detailed PPT-related tutorials and font tutorials, you can view: Click to see
How to create a high-quality technological sense PPT? 4 ways to share the bottom of the box
Notice
Do not download in WeChat, Zhihu, QQ, built-in browsers, please use mobile browsers to download! If you are a mobile phone user, please download it on your computer!
1. The manuscript PPT is only for study and reference, please delete it 24 hours after downloading.
2. If the resource involves your legitimate rights and interests, delete it immediately.
3. Contact information: service@daogebangong.com
"Statistical Survey" data collection, arrangement and description PPT courseware 5, due to usage restrictions, it is only for personal study and reference use. For commercial use, please go to the relevant official website for authorization.
(Personal non-commercial use refers to the use of this font to complete the display of personal works, including but not limited to the design of personal papers, resumes, etc.)
Preview
Related Search:
"Statistical Survey" data collection, arrangement and description PPT courseware 5
2024-11-25
Copyright statement: This material is compiled and released by the user of Daoge Resources. The copyright belongs to the author. For commercial use, please contact the copyright owner. If there is any infringement, please contact the webmaster to remove the resource.
Download Points: 0.00
Free Download
Upgrade VIP
Favorite
Views: 4408 / Downloads: 342


