Western Normal University Edition First Grade Mathematics Volume 1
Beijing Normal University Edition Seventh Grade Mathematics Volume 1
People's Education Press First Grade Mathematics Volume 1
People's Education Press Second Grade Mathematics Volume 1
Beijing Normal University Edition Seventh Grade Mathematics Volume 2
People's Education Press Third Grade Mathematics Volume 1
Beijing Normal University Edition Eighth Grade Mathematics Volume 1
Qingdao Edition Seventh Grade Mathematics Volume 1
Hebei Education Edition Third Grade Mathematics Volume 1
Beijing Normal University Edition Fifth Grade Mathematics Volume 1
Hebei Education Edition Seventh Grade Mathematics Volume 2
People's Education Press First Grade Mathematics Volume 2
People's Education High School Mathematics Edition B Compulsory Course 2
Qingdao Edition Seventh Grade Mathematics Volume 2
Beijing Normal University Edition Fifth Grade Mathematics Volume 2
Hebei Education Edition Fourth Grade Mathematics Volume 2
| Category | Format | Size |
|---|---|---|
| People's Education Press Seventh Grade Mathematics Volume 2 | pptx | 6 MB |

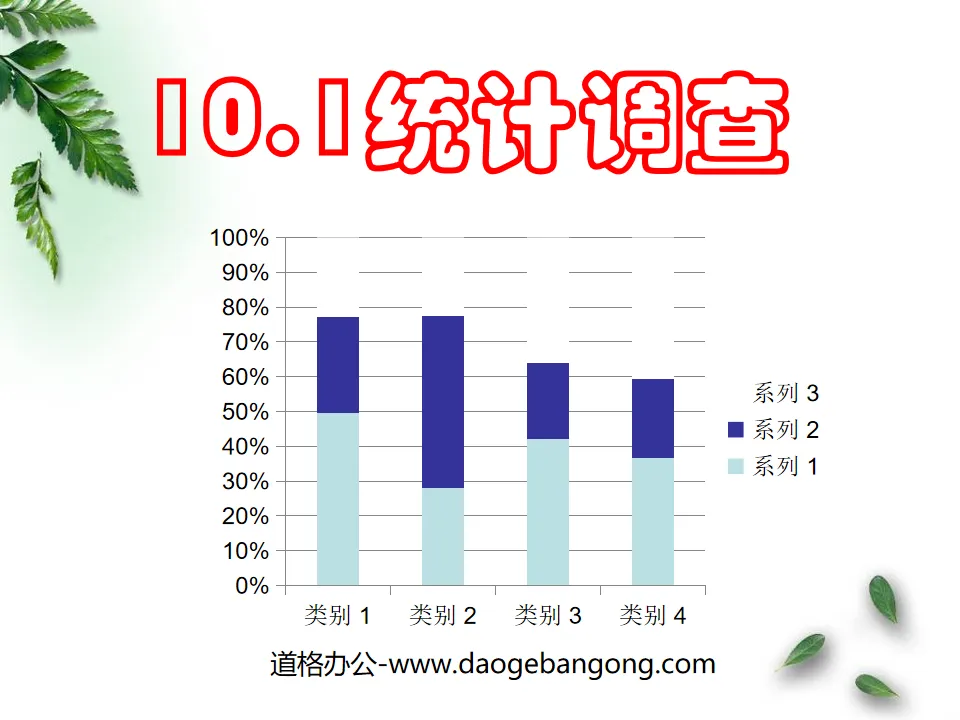
"Statistical Survey" data collection, organization and description PPT courseware 3
2024-11-19
Copyright statement: This material is compiled and released by the user of Daoge Resources. The copyright belongs to the author. For commercial use, please contact the copyright owner. If there is any infringement, please contact the webmaster to remove the resource.
Download Points: 0.00
Free Download
Upgrade VIP
Favorite
Views: 4686 / Downloads: 261
Description
"Statistical Survey" data collection, organization and description PPT courseware 3
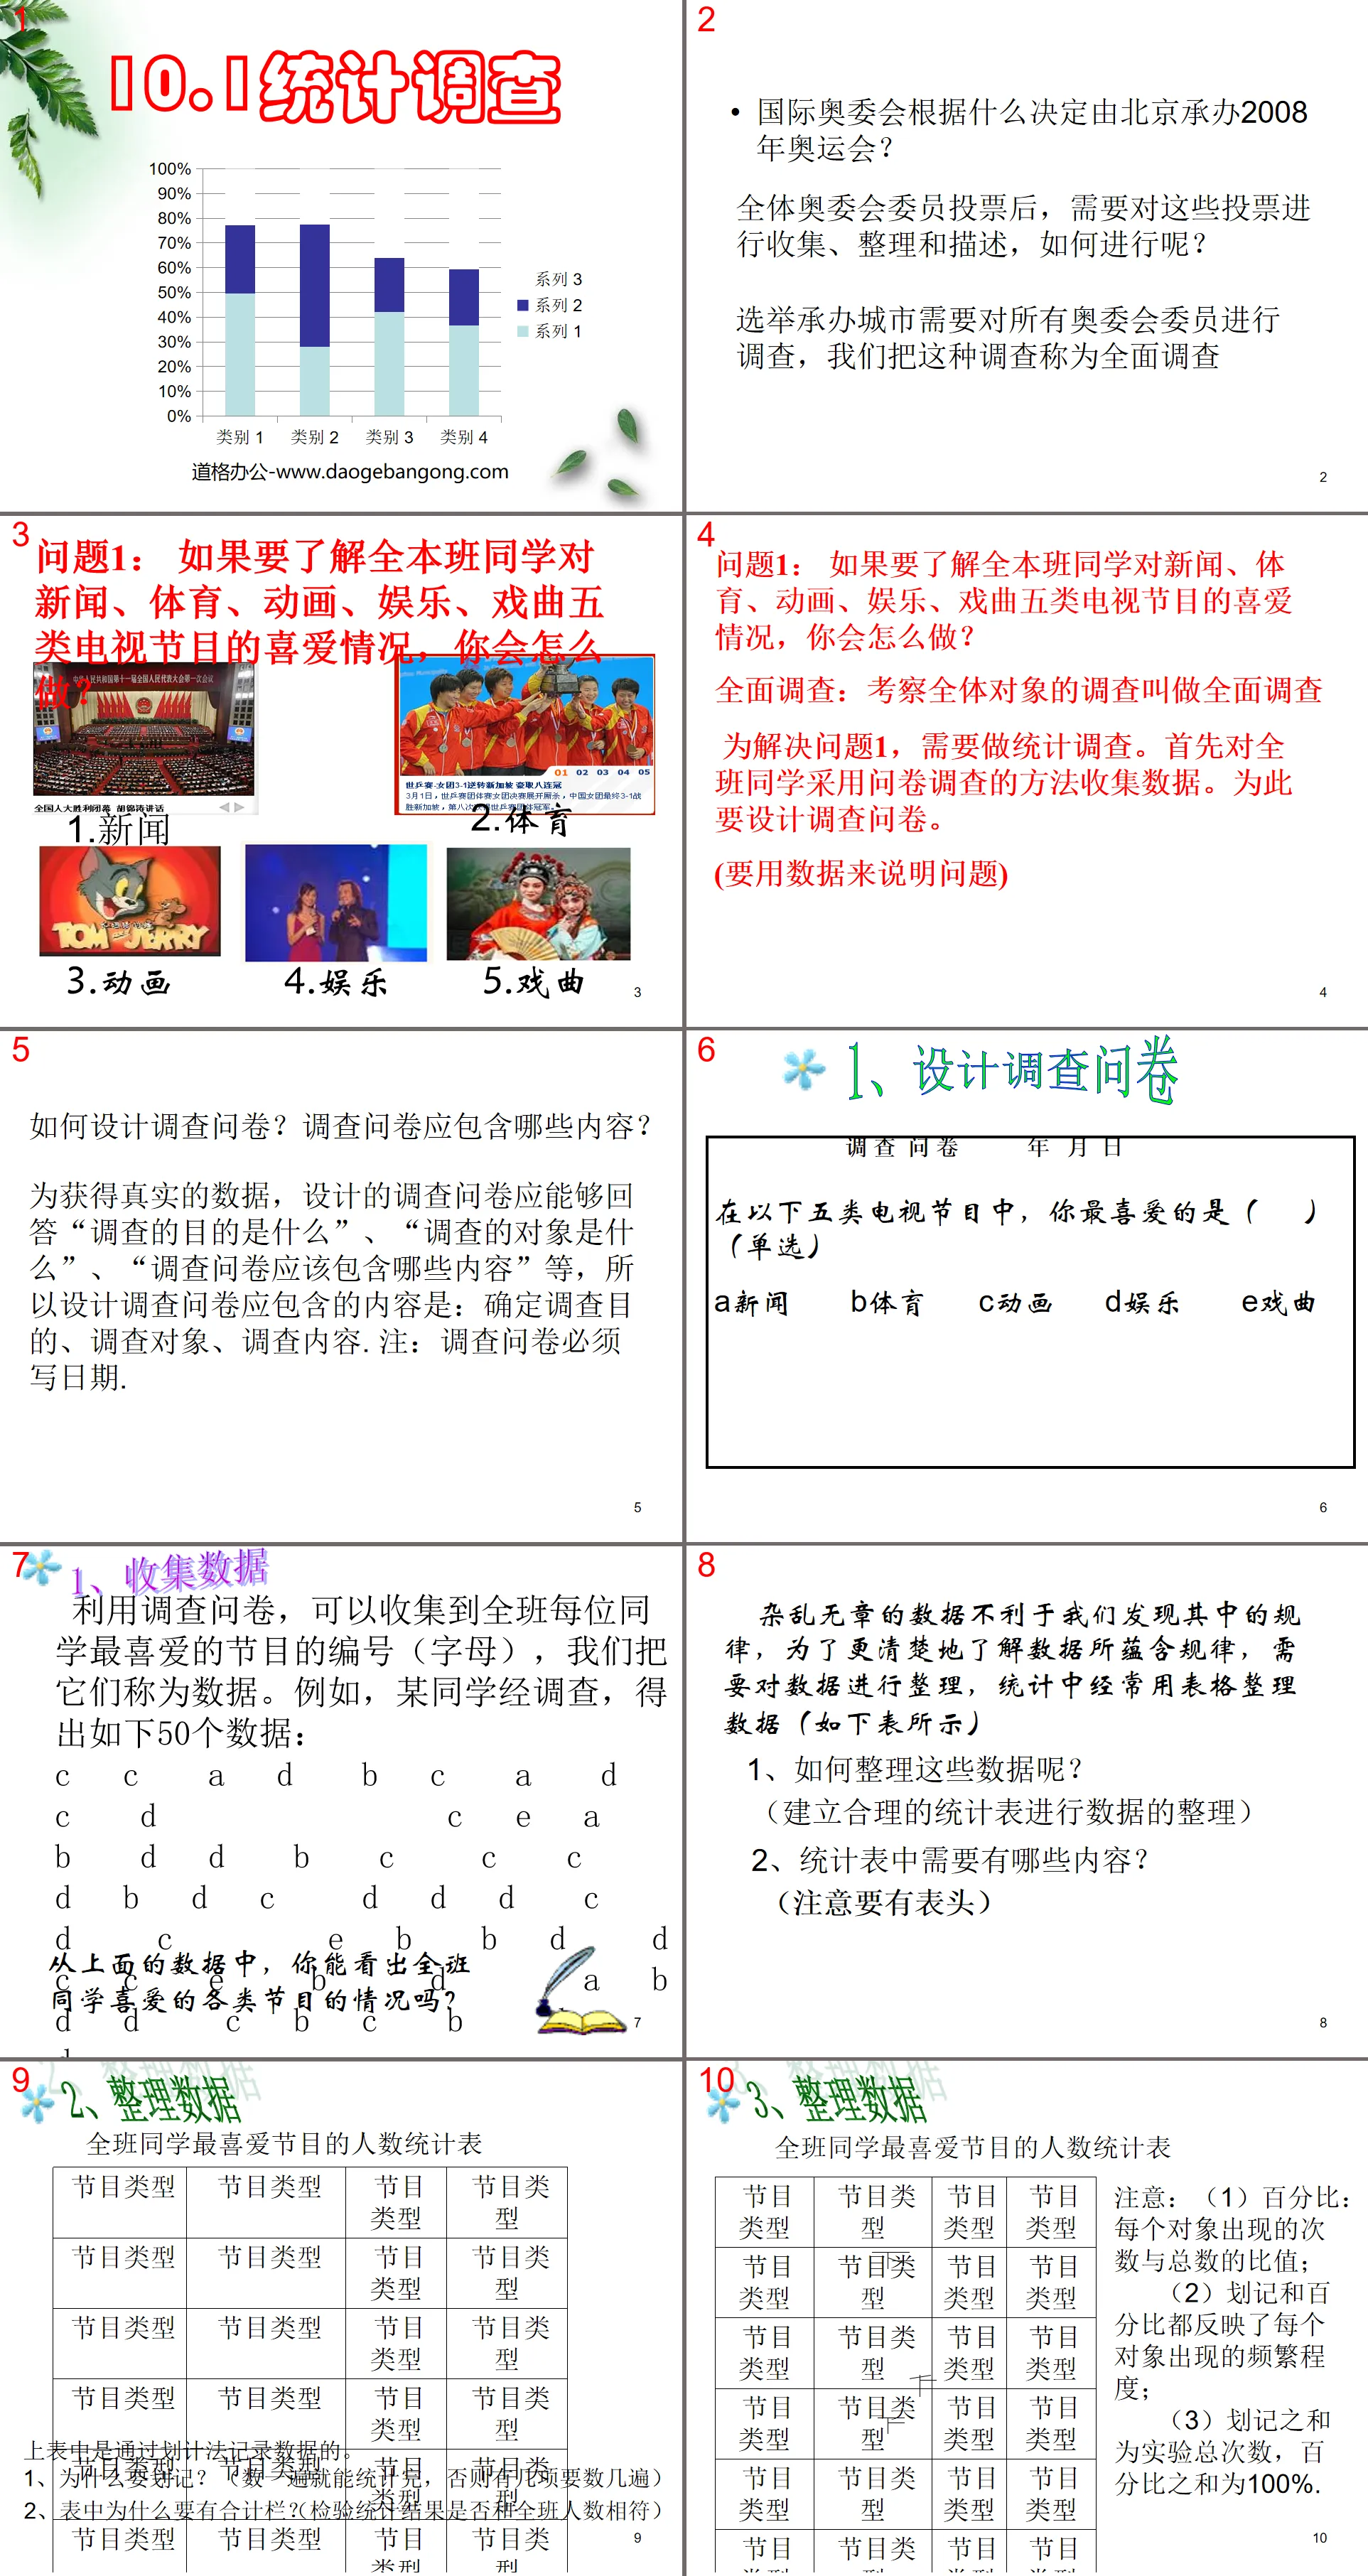
On what basis did the International Olympic Committee decide that Beijing would host the 2008 Olympic Games?
After all Olympic Committee members vote, these votes need to be collected, organized and described. How to do this?
The city hosting the election needs to investigate all Olympic Committee members. We call this investigation a comprehensive investigation.
Question 1: What would you do if you wanted to know how much the entire class loves TV programs in five categories: news, sports, animation, entertainment, and opera?
Comprehensive investigation: An investigation that examines all objects is called a comprehensive investigation.
To solve question 1, a statistical survey is needed. First, use a questionnaire survey method to collect data from the entire class. A questionnaire should be designed for this purpose.
(Use data to illustrate the problem)
How to design a questionnaire? What should the questionnaire contain?
In order to obtain real data, the designed questionnaire should be able to answer "What is the purpose of the survey", "What is the object of the survey", "What content should the questionnaire contain", etc. Therefore, the content that should be included in the designed questionnaire is: Determine The purpose of the survey, the objects of the survey, and the content of the survey. Note: The date must be written on the questionnaire.
design the research survey
Survey Questionnaire Year Month Day
Among the following five types of TV programs, which one is your favorite ( ) (single choice)
ANews BSports CAnimation DEntertainment EDrama
1. Collect data
Using a questionnaire, you can collect the numbers (letters) of each student's favorite program in the class, which we call data. For example, a classmate obtained the following 50 data after investigation:
C C A D B C A D C D
C E A B D D B C C C
D B D C D D D C D C
E B B D D C C E B D
A B D D C B C B D D
Messy data is not conducive to our discovery of patterns. In order to understand the patterns contained in the data more clearly, the data needs to be organized. Tables are often used to organize the data in statistics (as shown in the table below)
1. How to organize these data? (Establish reasonable statistical tables to organize data)
2. What content is needed in the statistical table? (Note that there must be a header)
3. Describe data
① Bar chart: It can clearly show the specific data of each project, making it easy to compare the differences between the data.
② Sector chart: The size of the sector is used to represent the percentage of a part in the whole. It is easy to display the size of each group of data relative to the total number, but it is impossible to judge the absolute size of each group of data.
③ Line chart: It can show the changing trend of data and reflect the changing laws and trends of the development of things.
Ⅰ. Make two coordinate axes perpendicular to each other. The horizontal axis represents different years, months and other times or different items; the vertical axis represents the number of statistical items;
Ⅱ. Draw corresponding points based on the number of each statistical item;
Ⅲ. Use line segments to connect the drawn points in sequence.
General process of data processing
(1) Collect data: generally use questionnaire survey
(2) Organize data: often use tables
(3) Describe data: use statistical charts
① Bar chart: It can display the specific data in each group and make it easy to compare the differences between the data;
② Sector chart: The size of the sector is used to represent the percentage of a part in the whole. It is easy to display the size of each group of data relative to the total, but it is impossible to judge the absolute size of each group of data.
③ Line statistical chart: It can show the changing trend of data and reflect the changing laws and trends of the development of things.
(4) Analyze data: meter reading chart
Class exercises
1. Two students used the following two questioning methods during the investigation. Which one do you think is better?
①Don’t you think science fiction movies are more interesting than martial arts movies?
②Which type of movie do you prefer--science fiction movies or martial arts movies?
2. The statistical chart is as shown in the figure:
①This statistical chart is a _____ shaped statistical chart;
②Xiao Ming did __ more pull-ups on Sunday than on Monday;
③If you want to show the changes in the number of pull-ups that Xiao Ming does continuously this week, you should use ____ statistical chart.
summary
What did we learn in today’s lesson?
1. Know how to record data using scratch notation.
2. Know how to use bar charts, fan charts, and line charts to describe data. Master related concepts;
3. Understand and compare the advantages and characteristics of bar charts, fan charts, and line charts;
4. Learn how to obtain information from charts and solve practical problems.
Keywords: data collection, arrangement and description teaching courseware, statistical investigation teaching courseware, New People's Education Edition seventh grade mathematics volume 2 PPT courseware, seventh grade mathematics slide courseware download, data collection, arrangement and description PPT courseware download, statistical investigation PPT Courseware download, .ppt format
For more information about the PPT courseware "Data Collection, Arrangement and Description of Statistical Investigation", please click on the "Data Collection, Arrangement and Description of Statistical Investigation ppt" tab.
"Statistical Survey" data collection, organization and description PPT courseware 8:
"Statistical Survey" Data Collection, Arrangement and Description PPT Courseware 8 Learning Objectives 1. Be able to design appropriate survey plans according to specific situations and further understand the importance of the representativeness and breadth of samples in sampling surveys; 2. Understand the three types of statistical graphs Their respective characteristics can be adjusted according to...
"Statistical Survey" data collection, organization and description PPT courseware 7:
"Statistical Survey" Data Collection, Arrangement and Description PPT Courseware 7 Teaching Objectives Knowledge and Abilities 1. Master the method of data collection - questionnaire; 2. Master the methods of data organization - tables; 3. Master the methods of data depiction - bar charts, fan charts...
"Statistical Survey" data collection, organization and description PPT courseware 6:
"Statistical Survey" Data Collection, Arrangement and Description PPT Courseware 6 Concept Formation 1. Sampling survey: collecting data by surveying some objects and estimating the whole situation based on the parts is called sampling survey. 2. Overall: all the objects to be investigated It's called the overall...
File Info
Update Time: 2024-11-19
This template belongs to Mathematics courseware People's Education Press Seventh Grade Mathematics Volume 2 industry PPT template
"Statistical Survey" data collection, organization and description PPT courseware 3 Simple campus recruitment activity planning plan summary enterprise and institution recruitment publicity lecture PPT template is a general PPT template for business post competition provided by the manuscript PPT, simple campus recruitment activity planning plan summary enterprise and institution recruitment promotion Lecture PPT template, you can edit and modify the text and pictures in the source file by downloading the source file. If you want more exquisite business PPT templates, you can come to grid resource. Doug resource PPT, massive PPT template slide material download, we only make high-quality PPT templates!
Tips: If you open the template and feel that it is not suitable for all your needs, you can search for related content "Statistical Survey" data collection, organization and description PPT courseware 3 is enough.
How to use the Windows system template
Directly decompress the file and use it with office or wps
How to use the Mac system template
Directly decompress the file and use it Office or wps can be used
Related reading
For more detailed PPT-related tutorials and font tutorials, you can view: Click to see
How to create a high-quality technological sense PPT? 4 ways to share the bottom of the box
Notice
Do not download in WeChat, Zhihu, QQ, built-in browsers, please use mobile browsers to download! If you are a mobile phone user, please download it on your computer!
1. The manuscript PPT is only for study and reference, please delete it 24 hours after downloading.
2. If the resource involves your legitimate rights and interests, delete it immediately.
3. Contact information: service@daogebangong.com
"Statistical Survey" data collection, organization and description PPT courseware 3, due to usage restrictions, it is only for personal study and reference use. For commercial use, please go to the relevant official website for authorization.
(Personal non-commercial use refers to the use of this font to complete the display of personal works, including but not limited to the design of personal papers, resumes, etc.)
Preview
Related Search:
"Statistical Survey" data collection, organization and description PPT courseware 3
2024-11-19
Copyright statement: This material is compiled and released by the user of Daoge Resources. The copyright belongs to the author. For commercial use, please contact the copyright owner. If there is any infringement, please contact the webmaster to remove the resource.
Download Points: 0.00
Free Download
Upgrade VIP
Favorite
Views: 4686 / Downloads: 261


