Western Normal University Edition First Grade Mathematics Volume 1
Beijing Normal University Edition Seventh Grade Mathematics Volume 1
People's Education Press First Grade Mathematics Volume 1
People's Education Press Third Grade Mathematics Volume 1
People's Education Press Second Grade Mathematics Volume 1
Hebei Education Edition Third Grade Mathematics Volume 1
Beijing Normal University Edition Seventh Grade Mathematics Volume 2
Beijing Normal University Edition Fifth Grade Mathematics Volume 1
Qingdao Edition Seventh Grade Mathematics Volume 1
Beijing Normal University Edition Eighth Grade Mathematics Volume 1
Hebei Education Edition Seventh Grade Mathematics Volume 2
People's Education High School Mathematics Edition B Compulsory Course 2
People's Education Press First Grade Mathematics Volume 2
Jiangsu Education Edition Fourth Grade Mathematics Volume 1
Qingdao Edition Seventh Grade Mathematics Volume 2
Beijing Normal University Edition Fifth Grade Mathematics Volume 2

| Category | Format | Size |
|---|---|---|
| People's Education Press Seventh Grade Mathematics Volume 2 | pptx | 6 MB |

"Statistical Survey" data collection, arrangement and description PPT courseware 4
2024-10-03
Copyright statement: This material is compiled and released by the user of Daoge Resources. The copyright belongs to the author. For commercial use, please contact the copyright owner. If there is any infringement, please contact the webmaster to remove the resource.
Download Points: 0.00
Free Download
Upgrade VIP
Favorite
Views: 3080 / Downloads: 118
Description
"Statistical Survey" data collection, arrangement and description PPT courseware 4
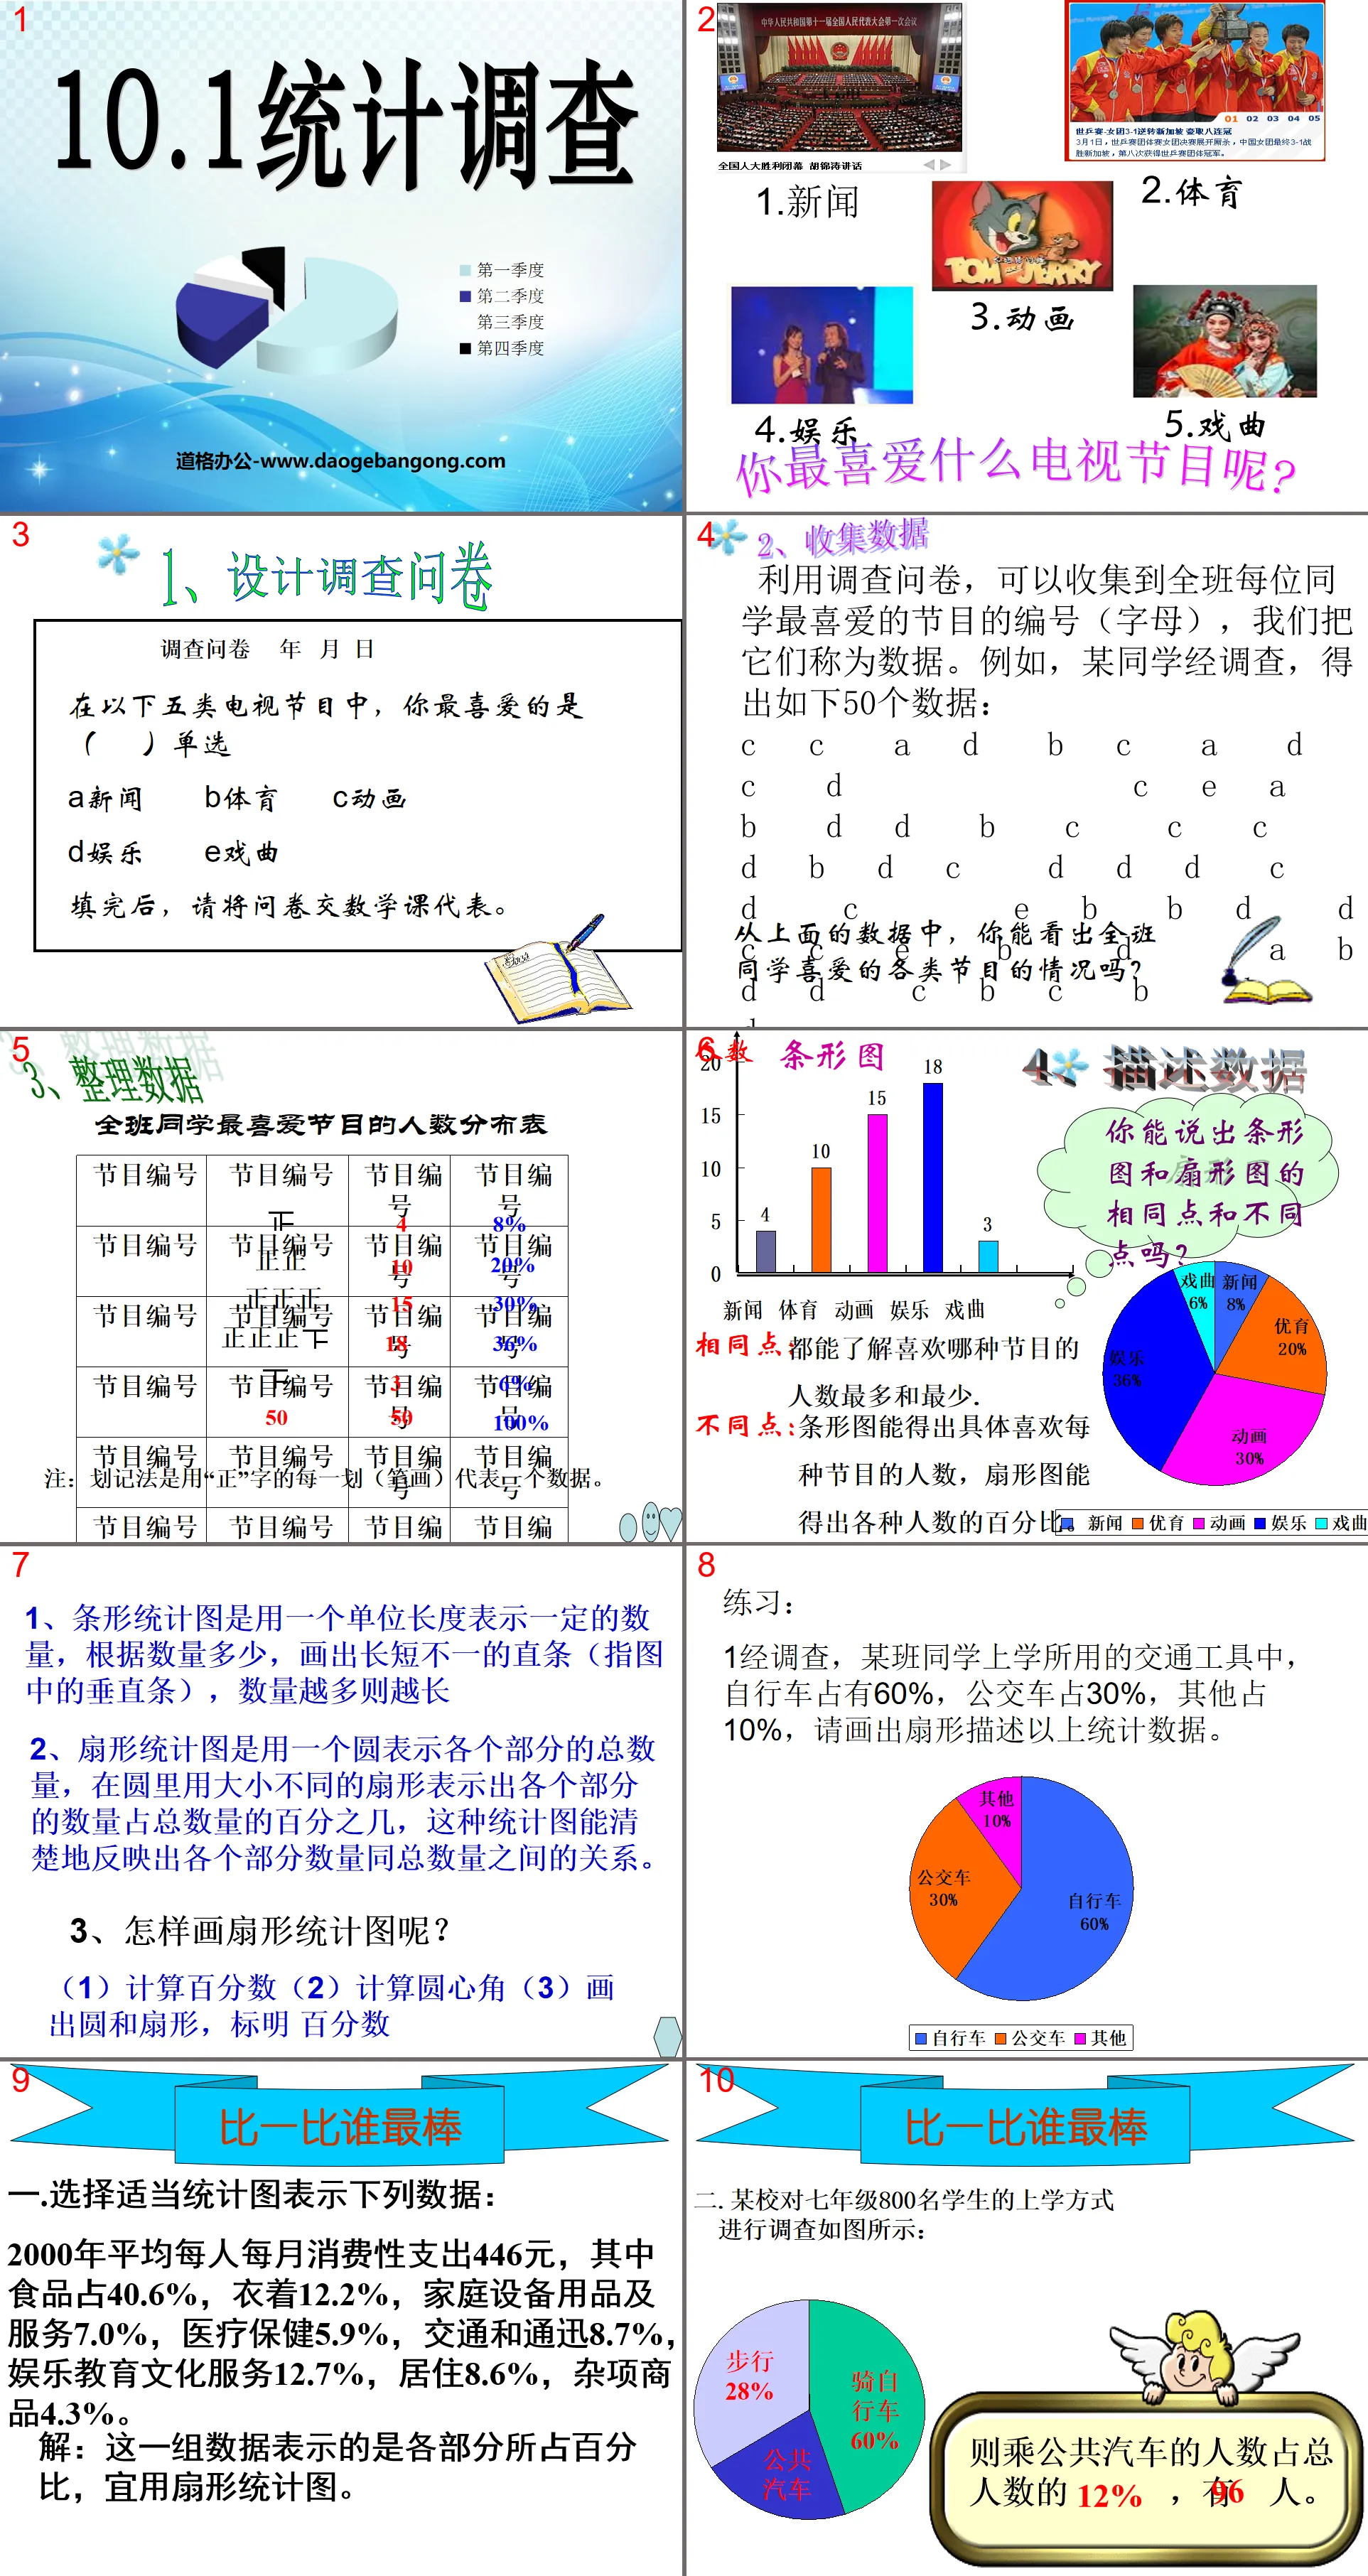
design the research survey
Questionnaire year month day
Among the following five types of TV programs, which one is your favorite ( )?
A News B Sports C Animation
D entertainment E opera
When completed, please return the questionnaire to your math class representative.
1. A bar chart uses one unit length to represent a certain quantity. According to the quantity, straight bars of different lengths are drawn (referring to the vertical bars in the picture). The greater the quantity, the longer it will be.
2. A sector chart uses a circle to represent the total quantity of each part, and uses sectors of different sizes in the circle to show how many percent of the total quantity each part accounts for. This statistical chart can clearly reflect each part. The relationship between quantity and total quantity.
3. How to draw a fan chart?
(1) Calculate the percentage (2) Calculate the central angle of the circle (3) Draw the circle and sector and indicate the percentage
Compare who is the best
1. Select appropriate statistical charts to represent the following data:
In 2000, the average monthly consumer expenditure per person was 446 yuan, of which food accounted for 40.6%, clothing 12.2%, household equipment, supplies and services 7.0%, medical care 5.9%, transportation and communications 8.7%, entertainment, education and cultural services 12.7%. Residence 8.6%, miscellaneous goods 4.3%.
Solution: This set of data represents the percentage of each part, and it is appropriate to use a fan chart.
2. A school conducted a survey on the schooling methods of 800 seventh-grade students, as shown in the figure:
Then the number of people taking the bus accounts for _____ of the total number of people, and there are _____ people.
3. Through the investigation of the development of fast food companies in a certain area from 1998 to 2000, Xiao Li made a bar chart of the number of fast food companies in the area ① and a bar chart of the average annual sales of lunch boxes of fast food companies ②. Use the information provided by Figure ① and Figure ② to answer the following questions.
(1) In 2000, there were ____ fast food companies in the area;
(2) In 1999, the average annual sales volume of lunch boxes of each fast food company was ( ) million boxes. In 2000, the annual sales volume of box lunch boxes of each fast food company was ( ) million boxes.
(3) In 2000, fast food companies in this region sold a total of ( ) million boxes of lunch boxes.
summary
What did we learn in today’s lesson?
1. Know how to record data using scratch notation.
2. Know how to use bar charts and fan charts to describe data. Master related concepts;
3. Understand and compare the advantages and characteristics of bar charts and fan charts;
4. Learn how to obtain information from charts and solve practical problems.
Keywords: data collection, arrangement and description teaching courseware, statistical investigation teaching courseware, New People's Education Edition seventh grade mathematics volume 2 PPT courseware, seventh grade mathematics slide courseware download, data collection, arrangement and description PPT courseware download, statistical investigation PPT Courseware download, .ppt format
For more information about the PPT courseware "Data Collection, Arrangement and Description of Statistical Investigation", please click on the "Data Collection, Arrangement and Description of Statistical Investigation ppt" tab.
"Statistical Survey" data collection, organization and description PPT courseware 8:
"Statistical Survey" Data Collection, Arrangement and Description PPT Courseware 8 Learning Objectives 1. Be able to design appropriate survey plans according to specific situations and further understand the importance of the representativeness and breadth of samples in sampling surveys; 2. Understand the three types of statistical graphs Their respective characteristics can be adjusted according to...
"Statistical Survey" data collection, organization and description PPT courseware 7:
"Statistical Survey" Data Collection, Arrangement and Description PPT Courseware 7 Teaching Objectives Knowledge and Abilities 1. Master the method of data collection - questionnaire; 2. Master the methods of data organization - tables; 3. Master the methods of data depiction - bar charts, fan charts...
"Statistical Survey" data collection, organization and description PPT courseware 6:
"Statistical Survey" Data Collection, Arrangement and Description PPT Courseware 6 Concept Formation 1. Sampling survey: collecting data by surveying some objects and estimating the whole situation based on the parts is called sampling survey. 2. Overall: all the objects to be investigated It's called the overall...
File Info
Update Time: 2024-10-03
This template belongs to Mathematics courseware People's Education Press Seventh Grade Mathematics Volume 2 industry PPT template
"Statistical Survey" data collection, arrangement and description PPT courseware 4 Simple campus recruitment activity planning plan summary enterprise and institution recruitment publicity lecture PPT template is a general PPT template for business post competition provided by the manuscript PPT, simple campus recruitment activity planning plan summary enterprise and institution recruitment promotion Lecture PPT template, you can edit and modify the text and pictures in the source file by downloading the source file. If you want more exquisite business PPT templates, you can come to grid resource. Doug resource PPT, massive PPT template slide material download, we only make high-quality PPT templates!
Tips: If you open the template and feel that it is not suitable for all your needs, you can search for related content "Statistical Survey" data collection, arrangement and description PPT courseware 4 is enough.
How to use the Windows system template
Directly decompress the file and use it with office or wps
How to use the Mac system template
Directly decompress the file and use it Office or wps can be used
Related reading
For more detailed PPT-related tutorials and font tutorials, you can view: Click to see
How to create a high-quality technological sense PPT? 4 ways to share the bottom of the box
Notice
Do not download in WeChat, Zhihu, QQ, built-in browsers, please use mobile browsers to download! If you are a mobile phone user, please download it on your computer!
1. The manuscript PPT is only for study and reference, please delete it 24 hours after downloading.
2. If the resource involves your legitimate rights and interests, delete it immediately.
3. Contact information: service@daogebangong.com
"Statistical Survey" data collection, arrangement and description PPT courseware 4, due to usage restrictions, it is only for personal study and reference use. For commercial use, please go to the relevant official website for authorization.
(Personal non-commercial use refers to the use of this font to complete the display of personal works, including but not limited to the design of personal papers, resumes, etc.)
Preview
Related Search:
"Statistical Survey" data collection, arrangement and description PPT courseware 4
2024-10-03
Copyright statement: This material is compiled and released by the user of Daoge Resources. The copyright belongs to the author. For commercial use, please contact the copyright owner. If there is any infringement, please contact the webmaster to remove the resource.
Download Points: 0.00
Free Download
Upgrade VIP
Favorite
Views: 3080 / Downloads: 118


