
| Category | Format | Size |
|---|---|---|
| Hebei Education Edition Ninth Grade Mathematics Volume 2 | pptx | 6 MB |

"Using Frequency to Estimate Probability" PPT courseware download
Description
"Using Frequency to Estimate Probability" PPT courseware download
Part One: Learning Objectives
Experience experiments, statistics and other activities, and be able to use experimental methods to estimate the probability of some complex random events.
New course introduction
Which of the following events is a definite event ( )
A. Throwing a thumbtack has the same probability of pointing up or down.
B. Randomly draw a card from a deck of cards, the suit is hearts
C. Select a channel on the TV and a cartoon is playing
D. Among the 367 students born in the same year, at least two have the same birthday
Using frequency to estimate probability PPT, part 2: knowledge explanation
How many classmates do you think must have two classmates with the same birthday?
Are there definitely 2 students out of 300 students with the same birthday?
What about 400 people?
what are you thinking?
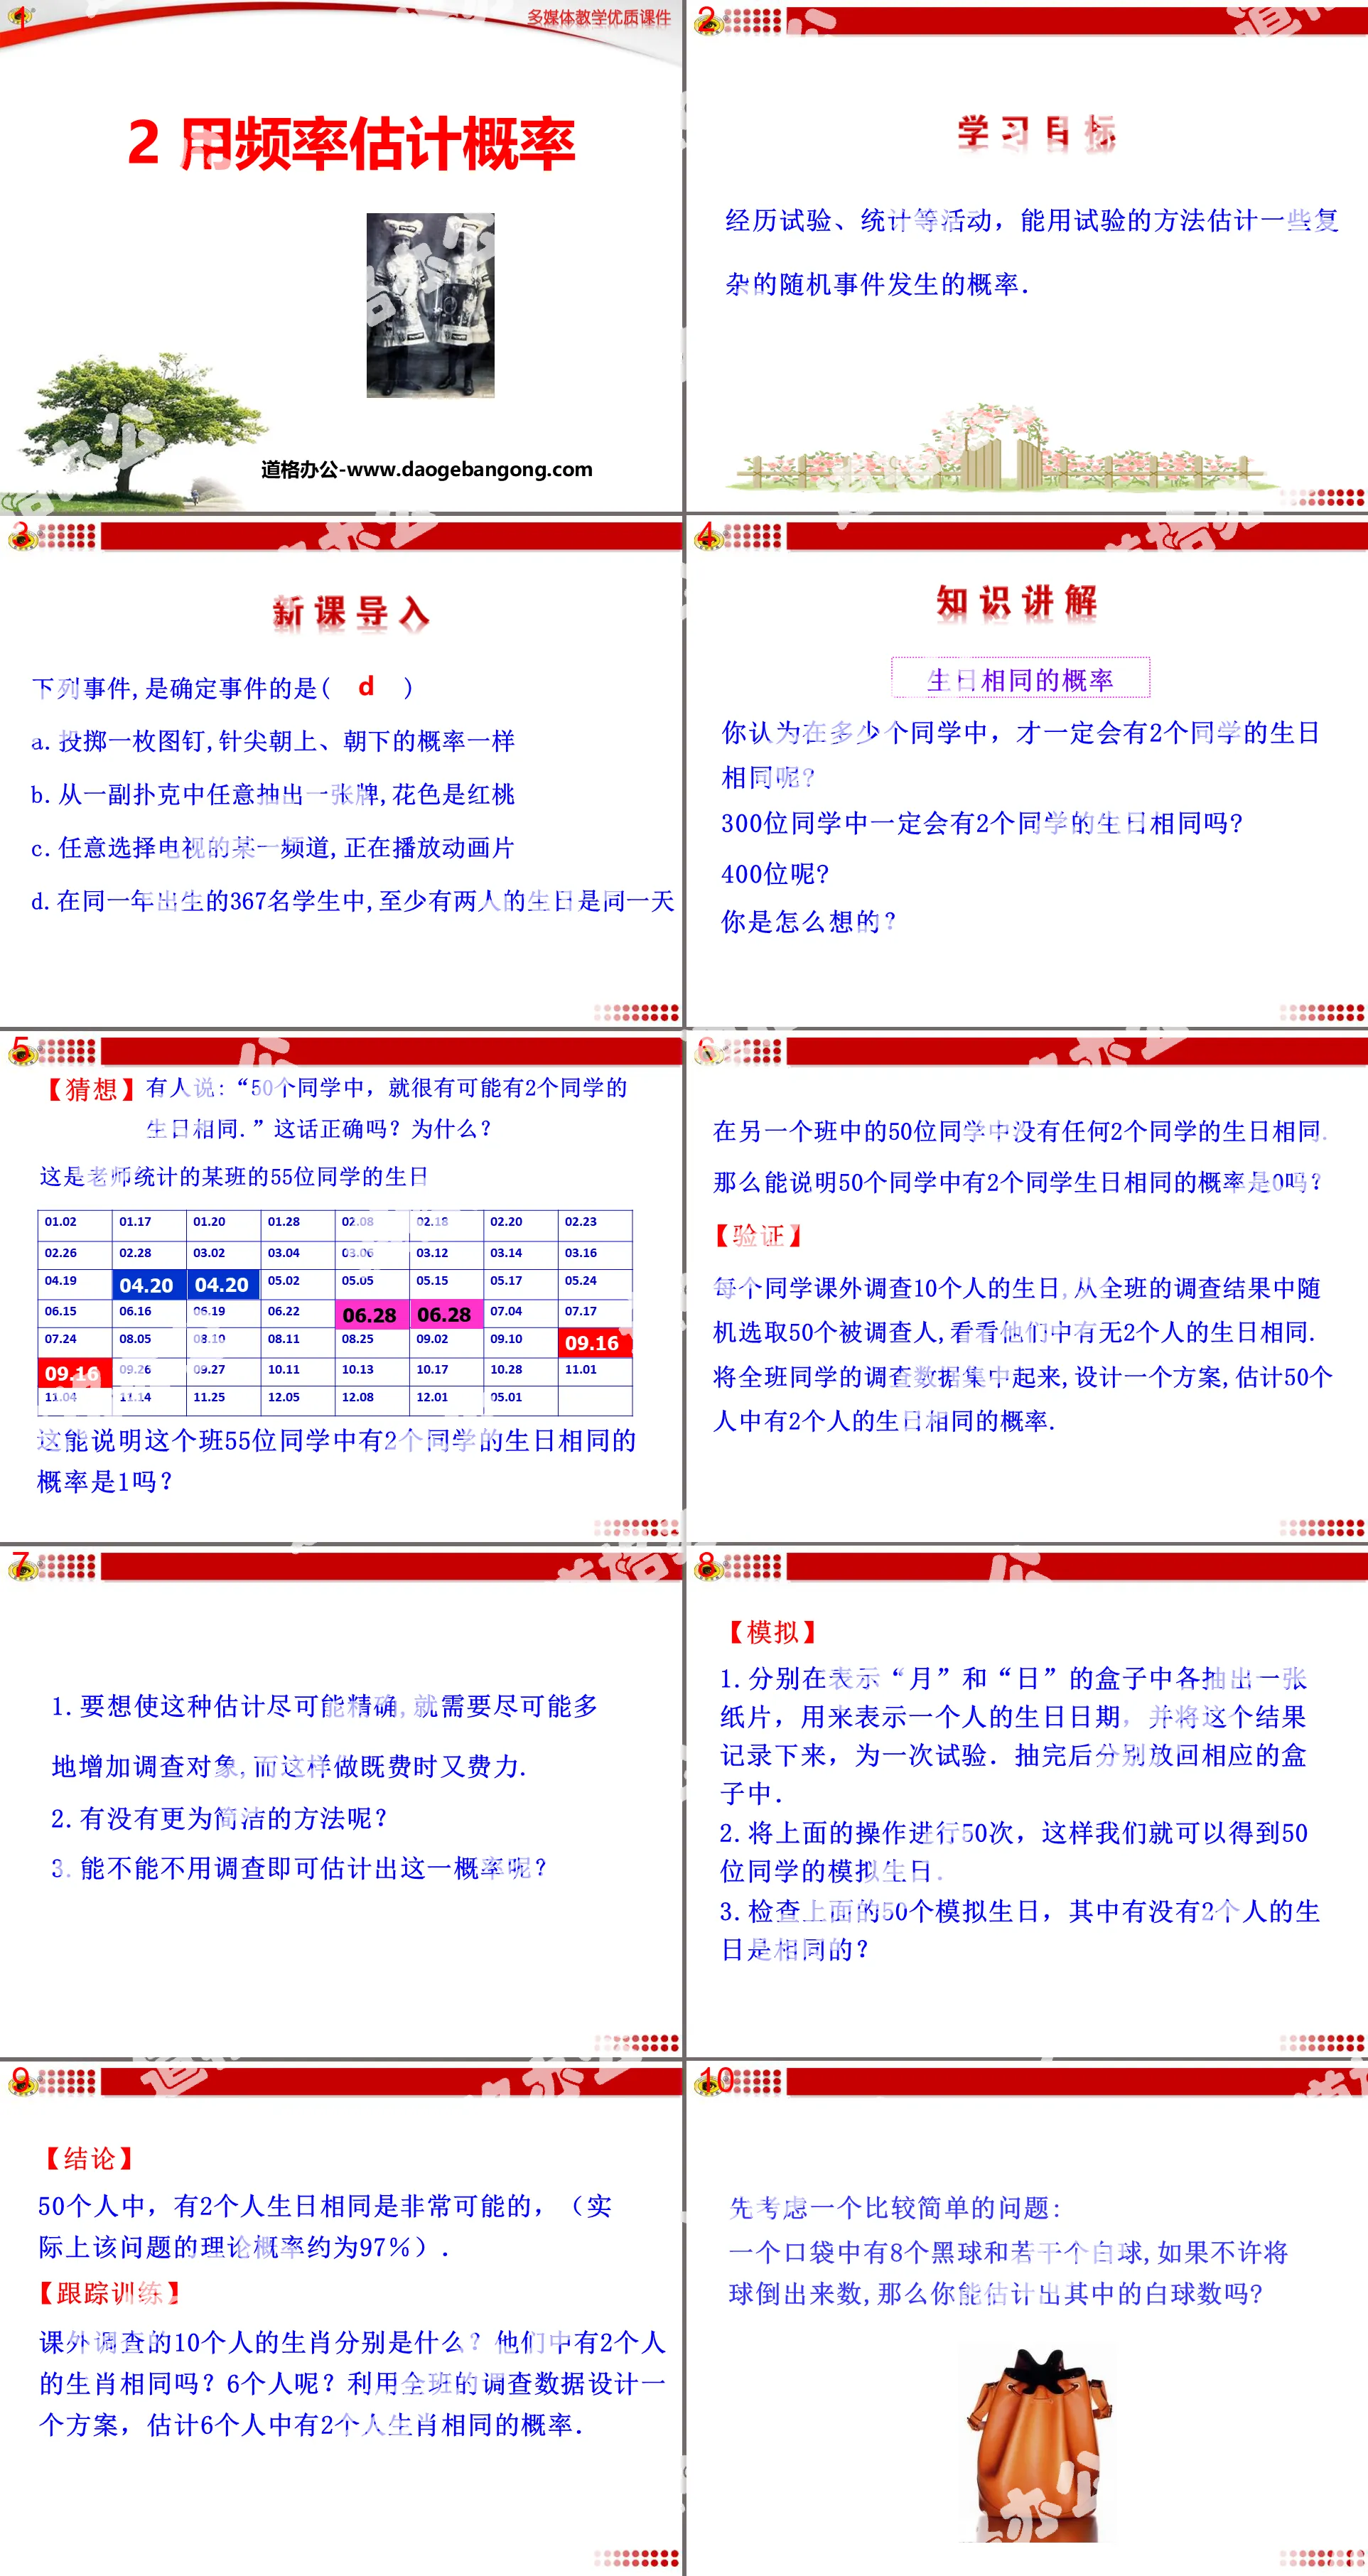
[Guess] Someone said: "Among 50 classmates, it is very likely that 2 classmates have the same birthday." Is this correct? Why?
This is the birthday of 55 students in a certain class counted by the teacher
Does this mean that the probability that 2 of the 55 students in this class have the same birthday is 1?
Among the 50 students in another class, no two students have the same birthday.
So can it be said that the probability that 2 out of 50 classmates have the same birthday is 0?
【verify】
Each classmate investigates the birthdays of 10 people after class. Randomly select 50 respondents from the survey results of the whole class to see if 2 of them have the same birthday. Collect the survey data of the whole class and design a plan , estimate the probability that 2 out of 50 people have the same birthday.
1. To make this estimate as accurate as possible, it is necessary to increase the number of survey subjects as much as possible, and doing so is time-consuming and labor-intensive.
2. Is there a simpler method?
3. Can this probability be estimated without survey?
Using frequency to estimate probability PPT, part three: classroom experiment
Group activities:
Place a known number of black balls and a number of white balls into each team's pocket.
(1) Use the above two methods to estimate the number of white balls in the pocket.
(2) Each group records the number of tests and test data.
(3) Based on the data collected by the team, estimate the white ball in the pocket.
(4) Open the pocket and count the number of white balls in the pocket. Is your estimate consistent with the actual number? Why?
(5) Summarize the data of each group, and estimate the number of white balls in a pocket based on this data, and see what the estimation results are.
(6) In order to make the estimation results more accurate, what should we pay attention to?
Theoretically, if the total number of tests is large enough, then Xiao Ming's method should be relatively accurate, but in practice, people cannot repeat tests indefinitely, so its practical significance is of little practical significance.
What is applied is: test frequency ≈ theoretical probability.
In comparison, Xiaoliang's method has practical significance. Of course, when the total number is small, the accuracy of estimation using Xiaoliang's method may be poor, but for many practical problems (the total number is often large), this accuracy is The degree is allowed, and this method is convenient and feasible.
The application is: sample mean ≈ population mean.
Using frequency to estimate probability PPT, part 4: tracking training
1. If there are only a few white balls in the pocket and no balls of other colors, and the balls are not allowed to be poured out, how do you estimate the number of white balls in it?
Method 1: Put a few more black balls into the pocket;
Method 2: Take a few balls out of the pocket and dye them black or mark them.
2. Now can you design a plan to estimate the total number of fish in a certain fish pond? Please write down your plan.
Solution: You can first fish out m fish, mark them, and then put them back into the pond. After a period of time, you can randomly fish out b fish. Among them, a is the marked fish, and the a/b ratio is used as The proportion of tagged fish in the entire fish pond, based on which the number of fish in the fish pond is estimated.
Using frequency to estimate probability PPT, part 5: practice in class
1. (Chenzhou High School Entrance Examination) The toy store run by Xiaoying’s mother once received a box of 3,000 plastic balls in black and white. In order to estimate how many balls of each color there were, she mixed the balls in the box. After mixing, she randomly picked out a ball and noted the color, then put it back into the box. After repeating the above process many times, she found that the frequency of black balls fluctuated around 0.7. Based on this, she could estimate that the number of black balls was approximately yes.
2. Xiao Ming’s family is a professional duck farmer. One day Xiao Liang went to his house to play and saw a group of dark ducks in the reservoir in front of his house. He first caught 100 ducks and marked them, and then put them back into the reservoir. After After a period of time, 100 ducks were caught for the second time, including 2 tagged ducks. Can Xiao Liang estimate how many ducks there are in Xiao Ming's family?
3. A certain fish pond is stocked with 100,000 fry. According to the experience of the past few years, the survival rate of the fry is 95%. After a period of time, they will be salvaged and sold. The first net catches 40 fish, and the average weight of each fish is 2.5kg. , the second net fished out 25 fish, and the average weight of each fish was 2.2kg. The third net fished out 35 fish, and the average weight of each fish was 2.8kg. Try to estimate the total mass of fish in the fish pond.
Estimating probability using frequency PPT, Part 6 content: Class summary
1. What gains and experiences have you gained from studying this class?
2. This section mainly studies the connection between statistics and probability, and the rationality of statistical inference.
3. Two ways to solve practical problems.
(1) Test frequency ≈ theoretical probability.
(2) Sample estimation of the population: sample mean ≈ population mean.
Keywords: Free download of Hebei Education Edition mathematics PPT courseware for the second volume of the ninth grade, using frequency to estimate probability PPT download, .PPT format;
For more information about the PPT courseware "Estimating Probability Using Frequency", please click the Estimating Probability Using Frequency ppt tag.
"Estimating Probability Using Frequency" PPT download:
"Using Frequency to Estimate Probability" PPT Download Part One Content: Teaching Objectives 1. Through experiments and operations, understand the uncertainty of whether random events will occur in each experiment, and understand the relationship between the number of repeated experiments and the frequency of events. relation. 2. Ability to follow frequency...
"Estimating Probability Using Frequency" PPT courseware:
Contents of the first part of the PPT courseware "Using Frequency to Estimate Probability": Do it (1) Toss an even coin 400 times. Every 50 times, record the number of heads and tails. After summarizing the data, complete the following table : (2) Based on the data in the above table, draw a polyline in the graph..
"Estimating Probability Using Frequency" PPT:
"Using Frequency to Estimate Probability" PPT Part One Content: Knowledge Review Questions (choose one of the two questions): 1. Toss a die, the probability that the number on the upward side is 6 is_. Equally possible events. Various outcomes are equally likely to occur. The results of an experiment are finite..
File Info
Update Time: 2024-07-04
This template belongs to Mathematics courseware Hebei Education Edition Ninth Grade Mathematics Volume 2 industry PPT template
"Using Frequency to Estimate Probability" PPT courseware download Simple campus recruitment activity planning plan summary enterprise and institution recruitment publicity lecture PPT template is a general PPT template for business post competition provided by the manuscript PPT, simple campus recruitment activity planning plan summary enterprise and institution recruitment promotion Lecture PPT template, you can edit and modify the text and pictures in the source file by downloading the source file. If you want more exquisite business PPT templates, you can come to grid resource. Doug resource PPT, massive PPT template slide material download, we only make high-quality PPT templates!
Tips: If you open the template and feel that it is not suitable for all your needs, you can search for related content "Using Frequency to Estimate Probability" PPT courseware download is enough.
How to use the Windows system template
Directly decompress the file and use it with office or wps
How to use the Mac system template
Directly decompress the file and use it Office or wps can be used
Related reading
For more detailed PPT-related tutorials and font tutorials, you can view: Click to see
How to create a high-quality technological sense PPT? 4 ways to share the bottom of the box
Notice
Do not download in WeChat, Zhihu, QQ, built-in browsers, please use mobile browsers to download! If you are a mobile phone user, please download it on your computer!
1. The manuscript PPT is only for study and reference, please delete it 24 hours after downloading.
2. If the resource involves your legitimate rights and interests, delete it immediately.
3. Contact information: service@daogebangong.com
"Using Frequency to Estimate Probability" PPT courseware download, due to usage restrictions, it is only for personal study and reference use. For commercial use, please go to the relevant official website for authorization.
(Personal non-commercial use refers to the use of this font to complete the display of personal works, including but not limited to the design of personal papers, resumes, etc.)
Preview
Related Search: