| Category | Format | Size |
|---|---|---|
| Hebei Education Edition Ninth Grade Mathematics Volume 1 | pptx | 6 MB |

"Average and Weighted Average" PPT courseware 3
Description
"Average and Weighted Average" PPT courseware 3
(1) Observation and thinking
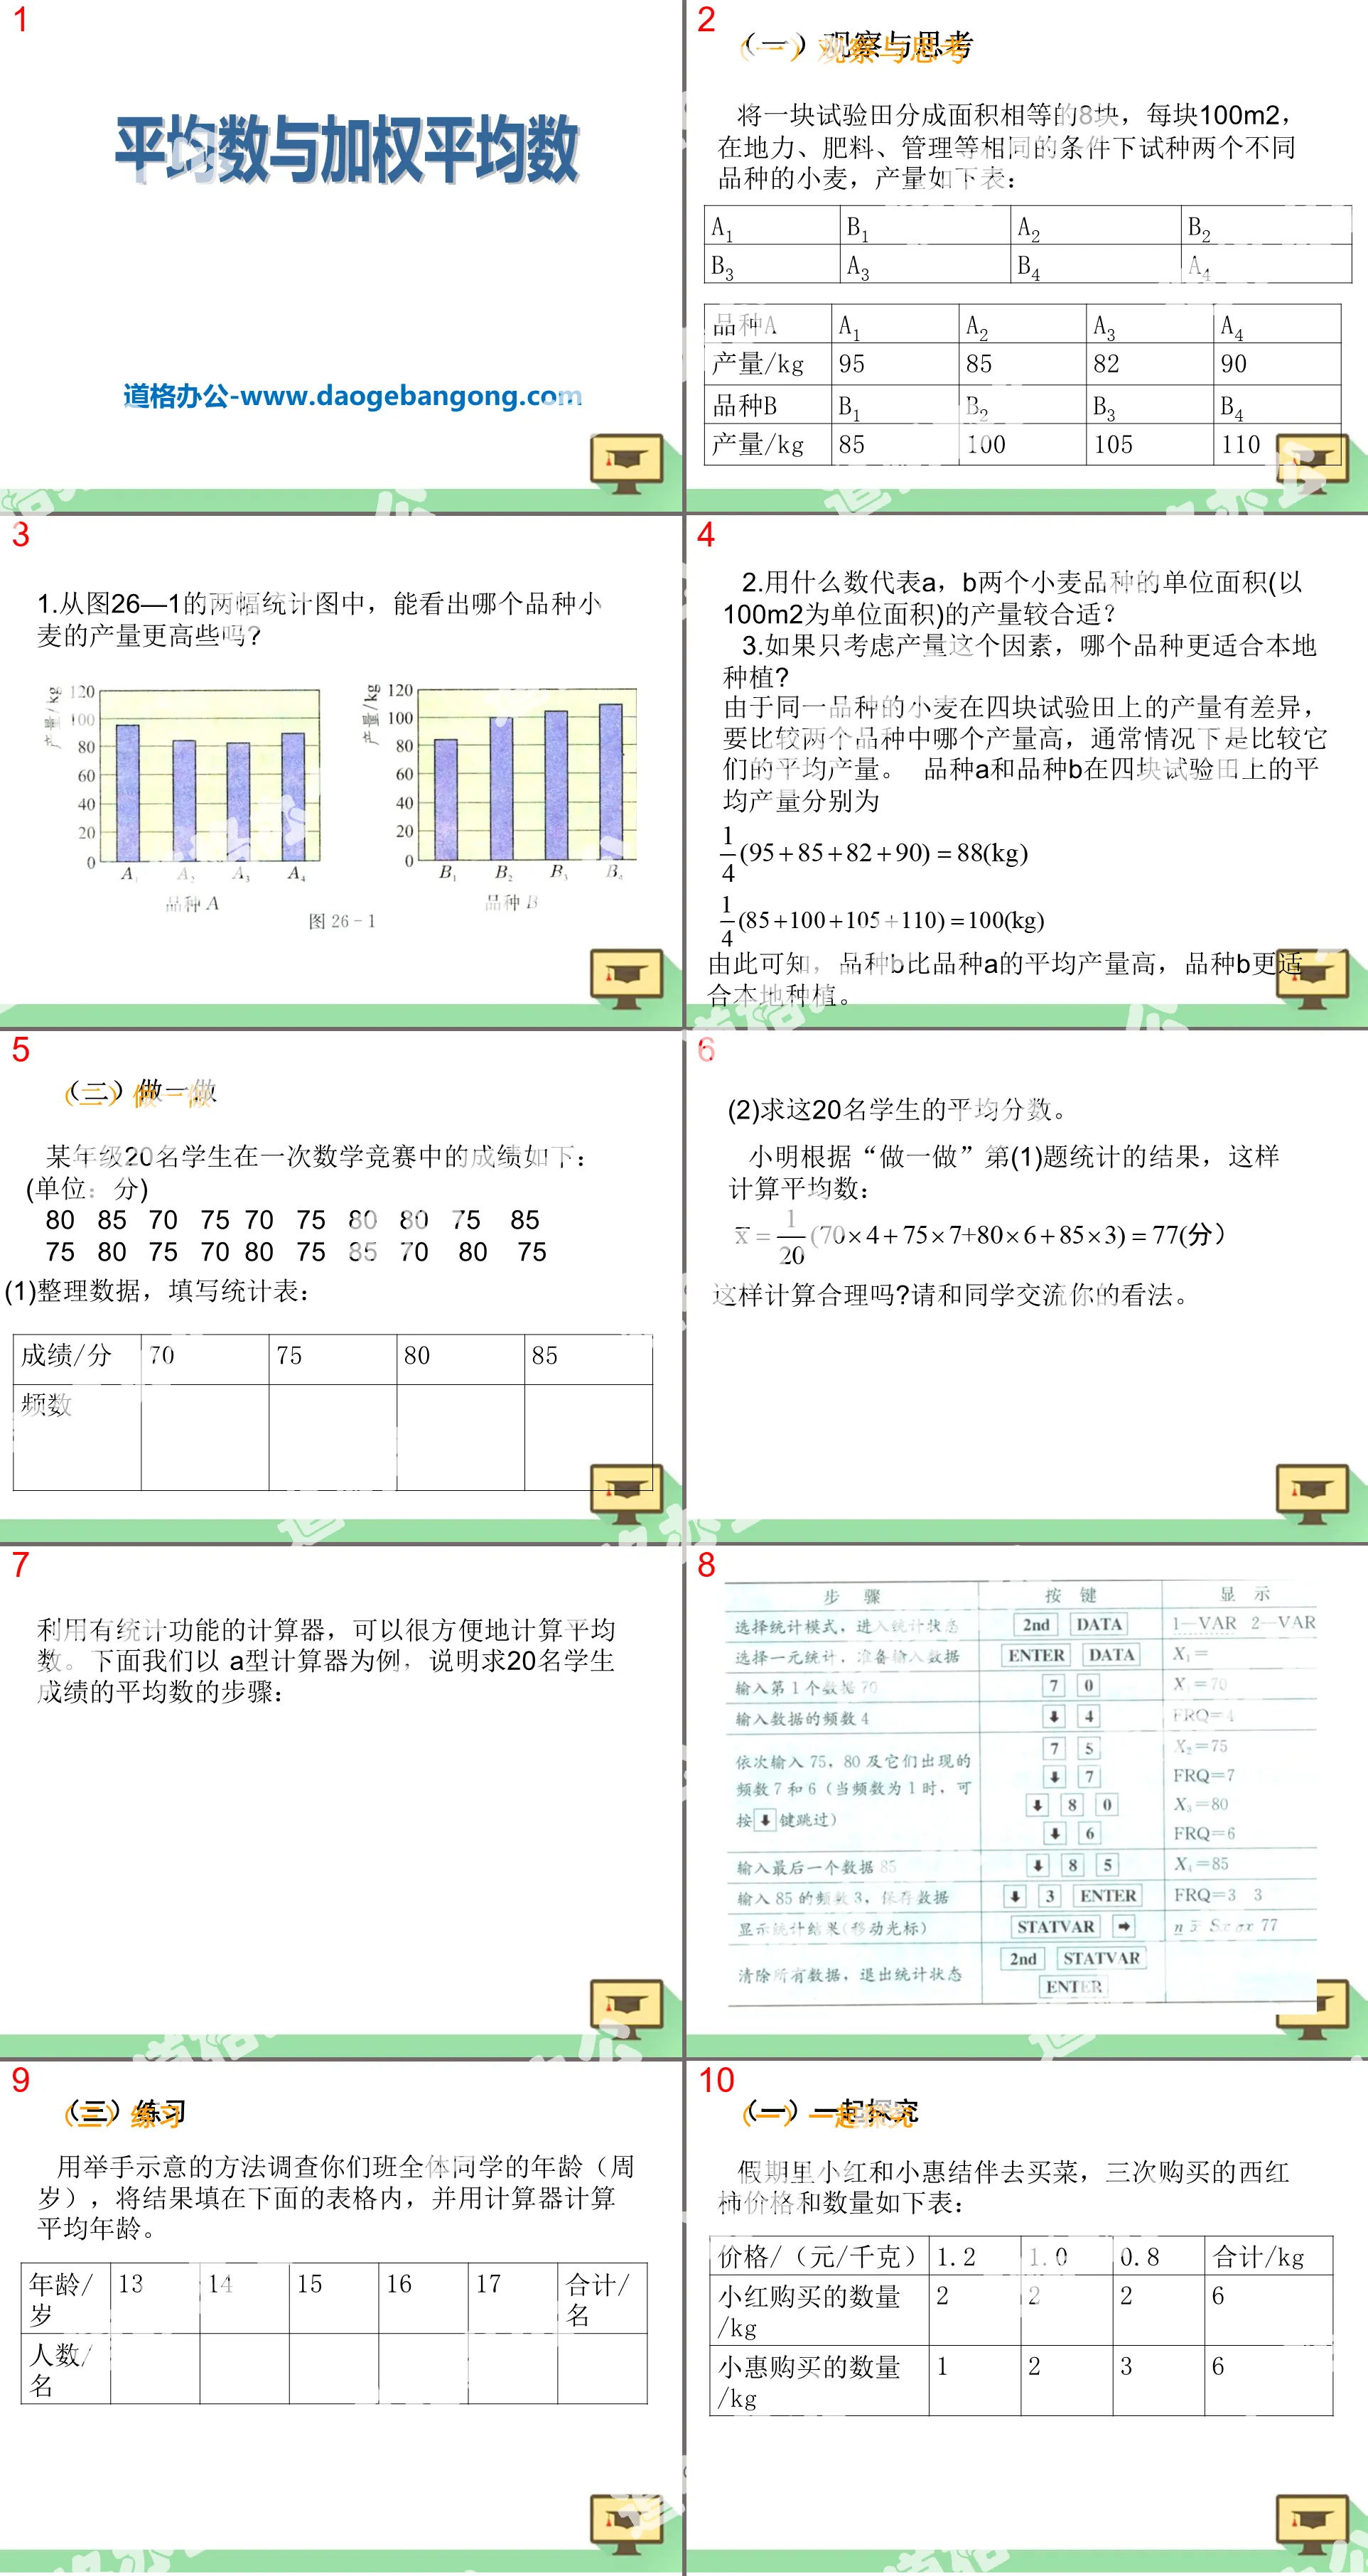
Divide an experimental field into 8 equal areas, each 100m2, and try to plant two different varieties of wheat under the same conditions such as soil fertility, fertilizer, and management. The yields are as follows:
1. From the two statistical graphs in Figure 26-1, can you tell which variety of wheat has a higher yield?
2. What number should be used to represent the yield per unit area (100m2 as the unit area) of the two wheat varieties A and B?
3. If we only consider the factor of yield, which variety is more suitable for local planting?
Since the yields of the same variety of wheat on the four test fields are different, to compare which of the two varieties has higher yield, usually compare their average yields. The average yields of variety A and variety B on the four test fields are respectively
It can be seen that variety B has a higher average yield than variety A, and variety B is more suitable for local planting.
(2) Do it
The results of 20 students of a certain grade in a mathematics competition are as follows: (unit: points)
80 85 70 75 70 75 80 80 75 85
75 80 75 70 80 75 85 70 80 75
(1) Organize data and fill in statistical tables:
(2) Find the average score of these 20 students.
Xiao Ming calculated the average based on the statistical results of question (1) of "Do it":
Is this calculation reasonable? Please share your views with your classmates.
(1) Explore together
During the holidays, Xiaohong and Xiaohui went shopping together. The prices and quantities of tomatoes purchased three times are as follows:
1. From the perspective of average price, which one is more cost-effective?
2. Thinking about what Xiaoliang and Xiaoming said, who do you think is right?
Xiaoliang said: The unit price of each purchase is the same, the total amount of the three purchases is also the same, and the average price should be the same, both (1.2+1.0+0.8)÷3=1.0 (yuan/kg).
Xiao Ming said: Although the total amount of the three purchases is the same, the amount spent is not the same, so the average price is different.
(1) Do it
Ask the whole class to visually inspect the blackboard for 20 seconds and estimate the width of the blackboard (unit: cm): record each person's estimation results.
(1) Group 8 to 10 people, group statistics on estimated data, and calculate the average of the estimated data.
(2) Summarize the number of people in each group and the average of the estimated data of each group, and calculate the average of the estimated data of the whole class.
(3) Actually measure the width of the blackboard (unit, cm) and write the result on the blackboard.
(4) Subtract the measured result from your estimated result to find the error of the estimate. Use the method of raising hands to count the estimation errors and fill in the statistical table:
(2) Let’s talk
1. Which of your estimated results, the group average or the class average, is closer to the measured result?
2. What percentage of students have an absolute value of estimation error not exceeding 10cm? What percentage of students have an absolute value of estimation error exceeding 20cm?
3. Which number is a better estimate of the actual width?
(3) Example questions
Example 2: 50 students in a class used visual inspection to estimate the length of a book (unit: cm), and organized the estimated data into groups. The results are as follows:
Using the average of these 50 data, estimate the length of the book.
(4) Practice
Now use the odometers on 10 cars to measure the length of the same section of road. The measurement results are as follows: (unit; km)
110.5 109.8 109.6 108.9 111.0
109.3 110.4 110.7 110.2 110.6:
Based on the above data, please estimate the approximate length of this section of road.
Answer
Use the arithmetic mean of 10 measurements to estimate the length of this section of road. The arithmetic mean of 10 data is 110.1 km, so the length of the road is approximately 110.1 km.
Keywords: average and weighted average teaching courseware, Hebei Education Edition ninth grade mathematics volume PPT courseware download, ninth grade mathematics slide courseware download, average and weighted average PPT courseware download, .PPT format;
For more information about the "Average and Weighted Average" PPT courseware, please click the "Average and Weighted Average" ppt tab.
"Average and Weighted Average" PPT Courseware 2:
"Average and Weighted Average" PPT Courseware 2 When calculating the weighted average based on the frequency distribution table, the ________ of each group is commonly used in statistics to represent the actual value of each group, and the ______ of each group is regarded as the value in the corresponding group The right of value. 1. (4 points) Among the following sets of data, in the group...
"Average and Weighted Average" PPT courseware:
"Average and Weighted Average" PPT courseware 1. Generally, we call the ratio of the sum of n numbers x1, x2, and xn to n the arithmetic mean of these n numbers. The abbreviated mean is recorded as x and pronounced as x. 2. The importance of each data in a set of data is not necessarily the same...
File Info
Update Time: 2024-07-06
This template belongs to Mathematics courseware Hebei Education Edition Ninth Grade Mathematics Volume 1 industry PPT template
"Average and Weighted Average" PPT courseware 3 Simple campus recruitment activity planning plan summary enterprise and institution recruitment publicity lecture PPT template is a general PPT template for business post competition provided by the manuscript PPT, simple campus recruitment activity planning plan summary enterprise and institution recruitment promotion Lecture PPT template, you can edit and modify the text and pictures in the source file by downloading the source file. If you want more exquisite business PPT templates, you can come to grid resource. Doug resource PPT, massive PPT template slide material download, we only make high-quality PPT templates!
Tips: If you open the template and feel that it is not suitable for all your needs, you can search for related content "Average and Weighted Average" PPT courseware 3 is enough.
How to use the Windows system template
Directly decompress the file and use it with office or wps
How to use the Mac system template
Directly decompress the file and use it Office or wps can be used
Related reading
For more detailed PPT-related tutorials and font tutorials, you can view: Click to see
How to create a high-quality technological sense PPT? 4 ways to share the bottom of the box
Notice
Do not download in WeChat, Zhihu, QQ, built-in browsers, please use mobile browsers to download! If you are a mobile phone user, please download it on your computer!
1. The manuscript PPT is only for study and reference, please delete it 24 hours after downloading.
2. If the resource involves your legitimate rights and interests, delete it immediately.
3. Contact information: service@daogebangong.com
"Average and Weighted Average" PPT courseware 3, due to usage restrictions, it is only for personal study and reference use. For commercial use, please go to the relevant official website for authorization.
(Personal non-commercial use refers to the use of this font to complete the display of personal works, including but not limited to the design of personal papers, resumes, etc.)
Preview
Related Search: