Western Normal University Edition First Grade Mathematics Volume 1
Beijing Normal University Edition Seventh Grade Mathematics Volume 1
People's Education Press First Grade Mathematics Volume 1
People's Education Press Third Grade Mathematics Volume 1
People's Education Press Second Grade Mathematics Volume 1
Hebei Education Edition Third Grade Mathematics Volume 1
Beijing Normal University Edition Seventh Grade Mathematics Volume 2
Beijing Normal University Edition Fifth Grade Mathematics Volume 1
Qingdao Edition Seventh Grade Mathematics Volume 1
Beijing Normal University Edition Eighth Grade Mathematics Volume 1
Hebei Education Edition Seventh Grade Mathematics Volume 2
People's Education High School Mathematics Edition B Compulsory Course 2
People's Education Press First Grade Mathematics Volume 2
Jiangsu Education Edition Fourth Grade Mathematics Volume 1
Qingdao Edition Seventh Grade Mathematics Volume 2
Beijing Normal University Edition Fifth Grade Mathematics Volume 2

| Category | Format | Size |
|---|---|---|
| Hebei Education Edition Fifth Grade Mathematics Volume 2 | pptx | 6 MB |

"Understanding Special Single Line Statistical Charts" PPT
2024-10-02
Copyright statement: This material is compiled and released by the user of Daoge Resources. The copyright belongs to the author. For commercial use, please contact the copyright owner. If there is any infringement, please contact the webmaster to remove the resource.
Download Points: 0.00
Free Download
Upgrade VIP
Favorite
Views: 4407 / Downloads: 420
Description
"Understanding Special Single Line Statistical Charts" PPT
Part One: Analysis of Examples
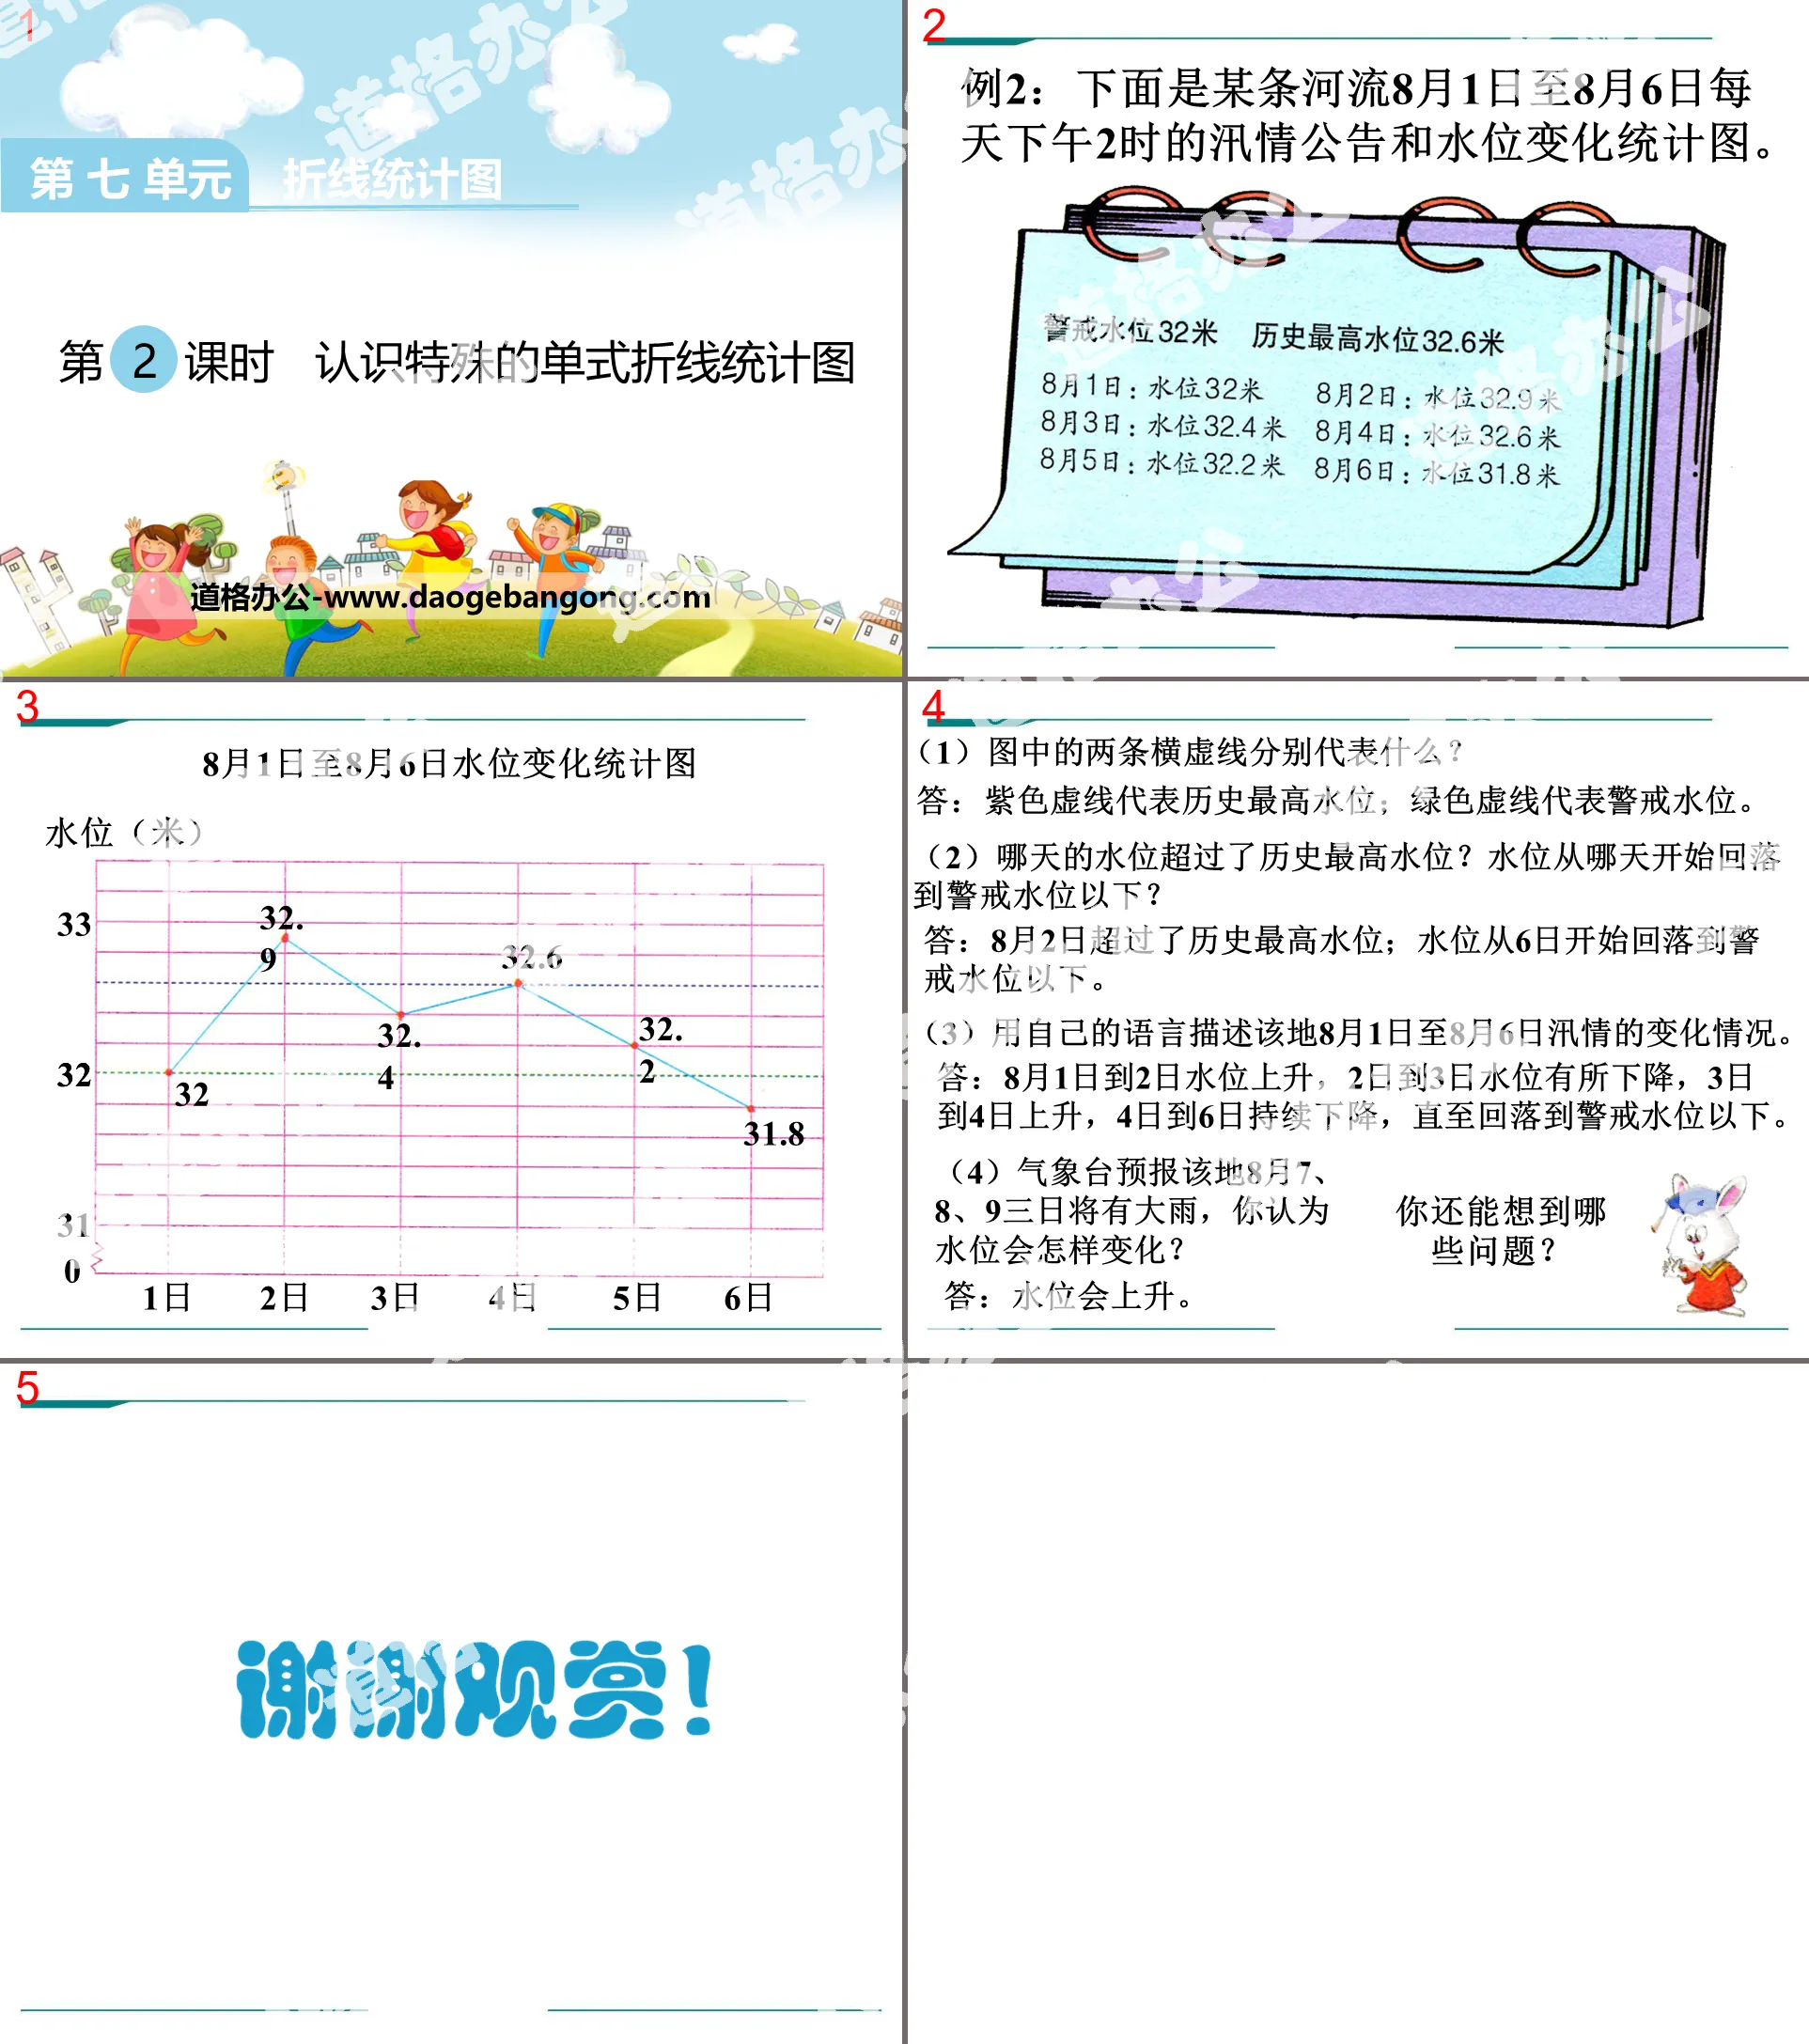
Example 2: The following is the flood situation announcement and water level change statistical chart of a certain river from August 1 to August 6 at 2 pm every day.
(1) What do the two horizontal dotted lines in the picture represent?
Answer: The purple dotted line represents the historical highest water level; the green dotted line represents the warning water level.
(2) On which day did the water level exceed the historical high? When did the water level begin to fall below the warning level?
Answer: The highest water level in history was exceeded on August 2; the water level began to fall below the warning level on the 6th.
(3) Use your own words to describe the changes in flood conditions in the area from August 1 to August 6.
Answer: The water level rose from August 1st to 2nd, dropped from the 2nd to 3rd, rose from the 3rd to 4th, and continued to drop from the 4th to 6th until it fell back below the warning level.
(4) The meteorological observatory predicts heavy rain in this area on August 7, 8, and 9. How do you think the water level will change?
Answer: The water level will rise.
Keywords: Free download of Hebei Education Edition mathematics PPT courseware for fifth grade volume 2, understanding of special single-form polyline statistical charts PPT download, .PPT format;
For more information about the PPT courseware "Line Statistical Chart Understanding Special Single-Type Line Statistical Chart", please click the Line Statistical Chart PPT Understanding Special Single-Type Line Statistical Chart PPT tag.
File Info
Update Time: 2024-10-02
This template belongs to Mathematics courseware Hebei Education Edition Fifth Grade Mathematics Volume 2 industry PPT template
"Understanding Special Single Line Statistical Charts" PPT Simple campus recruitment activity planning plan summary enterprise and institution recruitment publicity lecture PPT template is a general PPT template for business post competition provided by the manuscript PPT, simple campus recruitment activity planning plan summary enterprise and institution recruitment promotion Lecture PPT template, you can edit and modify the text and pictures in the source file by downloading the source file. If you want more exquisite business PPT templates, you can come to grid resource. Doug resource PPT, massive PPT template slide material download, we only make high-quality PPT templates!
Tips: If you open the template and feel that it is not suitable for all your needs, you can search for related content "Understanding Special Single Line Statistical Charts" PPT is enough.
How to use the Windows system template
Directly decompress the file and use it with office or wps
How to use the Mac system template
Directly decompress the file and use it Office or wps can be used
Related reading
For more detailed PPT-related tutorials and font tutorials, you can view: Click to see
How to create a high-quality technological sense PPT? 4 ways to share the bottom of the box
Notice
Do not download in WeChat, Zhihu, QQ, built-in browsers, please use mobile browsers to download! If you are a mobile phone user, please download it on your computer!
1. The manuscript PPT is only for study and reference, please delete it 24 hours after downloading.
2. If the resource involves your legitimate rights and interests, delete it immediately.
3. Contact information: service@daogebangong.com
"Understanding Special Single Line Statistical Charts" PPT, due to usage restrictions, it is only for personal study and reference use. For commercial use, please go to the relevant official website for authorization.
(Personal non-commercial use refers to the use of this font to complete the display of personal works, including but not limited to the design of personal papers, resumes, etc.)
Preview
Related Search:
"Understanding Special Single Line Statistical Charts" PPT
2024-10-02
Copyright statement: This material is compiled and released by the user of Daoge Resources. The copyright belongs to the author. For commercial use, please contact the copyright owner. If there is any infringement, please contact the webmaster to remove the resource.
Download Points: 0.00
Free Download
Upgrade VIP
Favorite
Views: 4407 / Downloads: 420


