


| Category | Format | Size |
|---|---|---|
| Hebei Education Edition Fifth Grade Mathematics Volume 2 | pptx | 6 MB |

"Complex Line Statistical Chart" PPT
2024-06-29
Copyright statement: This material is compiled and released by the user of Daoge Resources. The copyright belongs to the author. For commercial use, please contact the copyright owner. If there is any infringement, please contact the webmaster to remove the resource.
Download Points: 0.00
Free Download
Upgrade VIP
Favorite
Views: 2760 / Downloads: 669
Description
"Complex Line Statistical Chart" PPT
Part One: Analysis of Examples
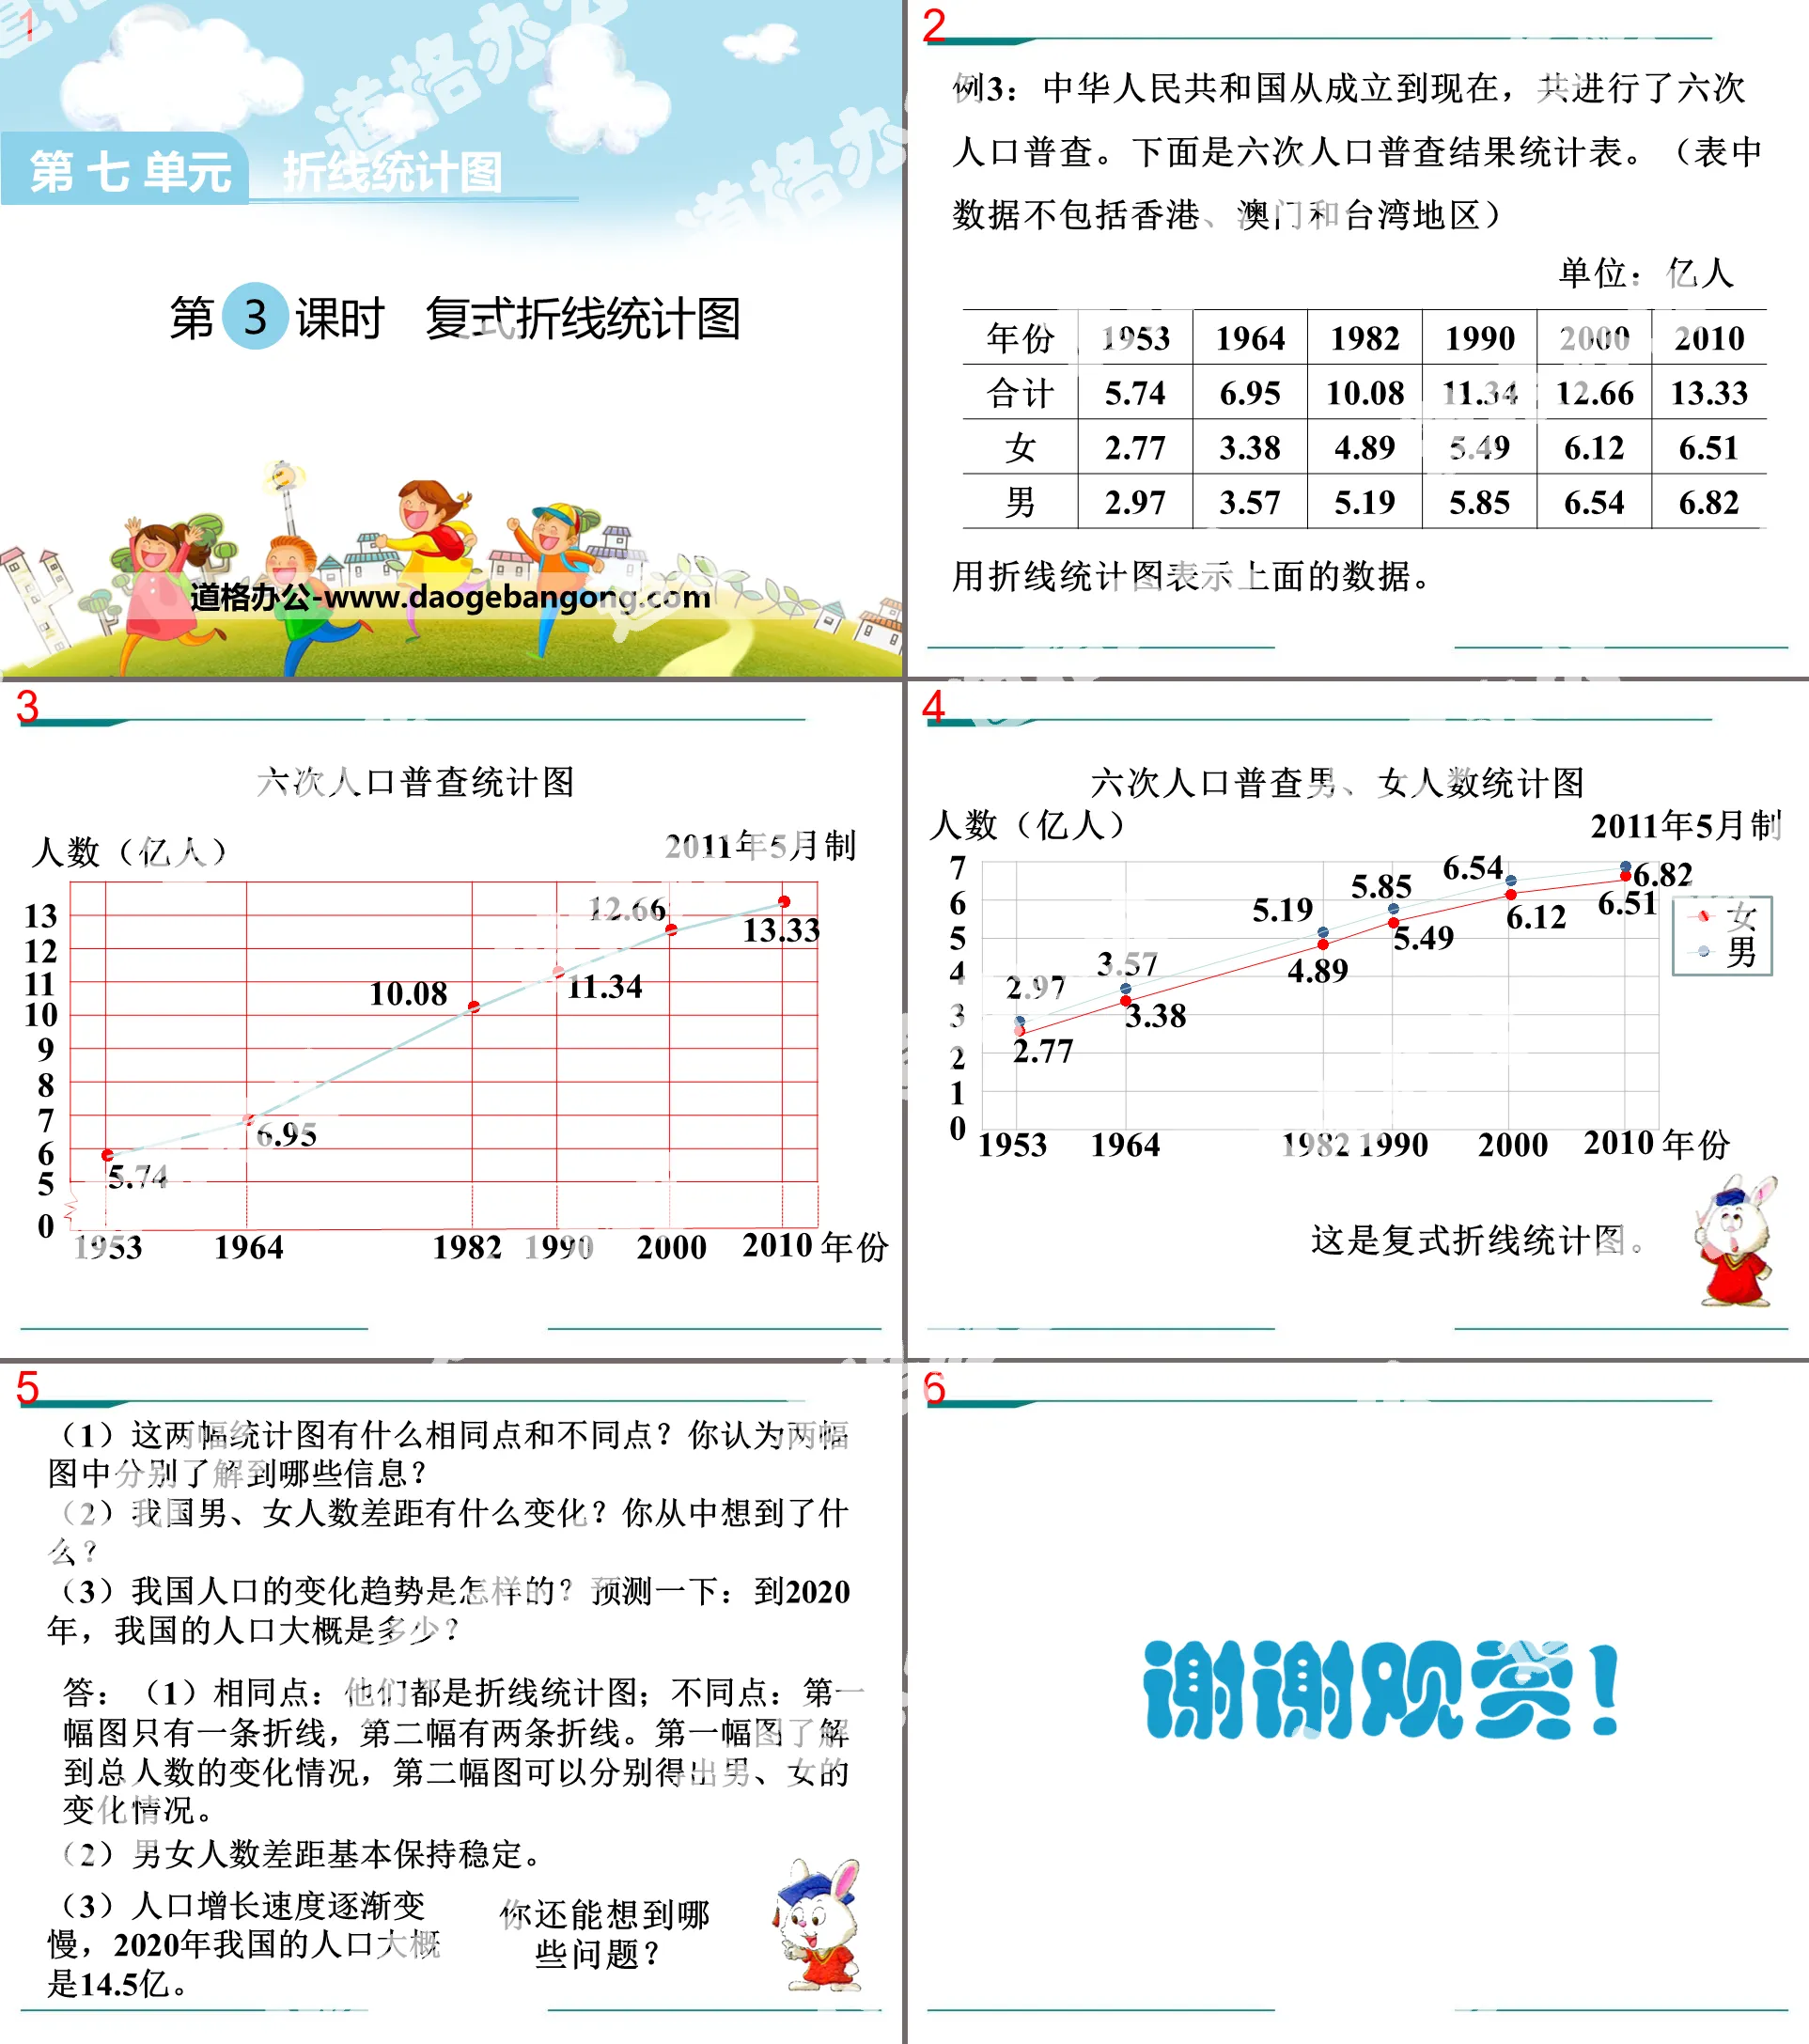
Example 3: From the founding of the People's Republic of China to the present, a total of six censuses have been conducted. The following is a statistical table of the results of the six censuses. (The data in the table does not include Hong Kong, Macau and Taiwan)
(1) What are the similarities and differences between these two statistical charts? What information do you think you can learn from the two pictures?
(2) What changes have occurred in the gap between the number of men and women in my country? What do you think of it?
(3) What is the changing trend of my country’s population? Let’s make a prediction: What will be our country’s population by 2020?
Answer: (1) Similar points: they are both line statistical charts; different points: the first picture has only one polyline, and the second picture has two polylines. The first picture shows the changes in the total number of people, and the second picture shows the changes in the number of men and women respectively.
(2) The gap in the number of men and women remains basically stable.
(3) The population growth rate is gradually slowing down. In 2020, my country’s population will be approximately 1.45 billion.
Keywords: Free download of Hebei Education Edition fifth grade mathematics PPT courseware for the second volume, download of compound polyline statistical chart PPT, .PPT format;
For more information about the "Line Statistical Chart Compound Line Statistical Chart" PPT courseware, please click the "Line Line Statistical Chart ppt Compound Line Statistical Chart ppt" tag.
"Compound Line Statistical Chart" Line Statistical Chart PPT Courseware 3:
"Compound Line Statistical Chart" Line Statistical Chart PPT Courseware 3 What kind of statistical chart can the above statistical table be made into? What's the reason? If you want to see the changing trend of data, what kind of statistical chart is more suitable? Can you tell me how to draw it? ... ... ... In order to enhance...
"Compound Line Statistical Chart" Line Statistical Chart PPT Courseware 2:
"Multiple Line Statistical Chart" Broken Line Statistical Chart PPT Courseware 2 If you want to see the changes in the number of gold medals won by two countries in each Asian Games, what should you do? Because the line chart can easily see the increase or decrease in quantity. You can use line charts to...
"Compound Line Statistical Chart" Line Statistical Chart PPT courseware:
"Multiple Line Statistical Chart" Broken Line Statistical Chart PPT courseware Group cooperation requirements: Two people discuss together, the student on the left writes and the student on the right checks. (1) In which Asian Games did China and South Korea win the most gold medals? (2) In which Asian Games did the two countries win the most gold medals?
File Info
Update Time: 2024-06-29
This template belongs to Mathematics courseware Hebei Education Edition Fifth Grade Mathematics Volume 2 industry PPT template
"Complex Line Statistical Chart" PPT Simple campus recruitment activity planning plan summary enterprise and institution recruitment publicity lecture PPT template is a general PPT template for business post competition provided by the manuscript PPT, simple campus recruitment activity planning plan summary enterprise and institution recruitment promotion Lecture PPT template, you can edit and modify the text and pictures in the source file by downloading the source file. If you want more exquisite business PPT templates, you can come to grid resource. Doug resource PPT, massive PPT template slide material download, we only make high-quality PPT templates!
Tips: If you open the template and feel that it is not suitable for all your needs, you can search for related content "Complex Line Statistical Chart" PPT is enough.
How to use the Windows system template
Directly decompress the file and use it with office or wps
How to use the Mac system template
Directly decompress the file and use it Office or wps can be used
Related reading
For more detailed PPT-related tutorials and font tutorials, you can view: Click to see
How to create a high-quality technological sense PPT? 4 ways to share the bottom of the box
Notice
Do not download in WeChat, Zhihu, QQ, built-in browsers, please use mobile browsers to download! If you are a mobile phone user, please download it on your computer!
1. The manuscript PPT is only for study and reference, please delete it 24 hours after downloading.
2. If the resource involves your legitimate rights and interests, delete it immediately.
3. Contact information: service@daogebangong.com
"Complex Line Statistical Chart" PPT, due to usage restrictions, it is only for personal study and reference use. For commercial use, please go to the relevant official website for authorization.
(Personal non-commercial use refers to the use of this font to complete the display of personal works, including but not limited to the design of personal papers, resumes, etc.)
Preview
Related Search:
"Complex Line Statistical Chart" PPT
2024-06-29
Copyright statement: This material is compiled and released by the user of Daoge Resources. The copyright belongs to the author. For commercial use, please contact the copyright owner. If there is any infringement, please contact the webmaster to remove the resource.
Download Points: 0.00
Free Download
Upgrade VIP
Favorite
Views: 2760 / Downloads: 669