Western Normal University Edition First Grade Mathematics Volume 1
Beijing Normal University Edition Seventh Grade Mathematics Volume 1
People's Education Press First Grade Mathematics Volume 1
People's Education Press Third Grade Mathematics Volume 1
People's Education Press Second Grade Mathematics Volume 1
Hebei Education Edition Third Grade Mathematics Volume 1
Beijing Normal University Edition Seventh Grade Mathematics Volume 2
Beijing Normal University Edition Fifth Grade Mathematics Volume 1
Qingdao Edition Seventh Grade Mathematics Volume 1
Hebei Education Edition Seventh Grade Mathematics Volume 2
Beijing Normal University Edition Eighth Grade Mathematics Volume 1
People's Education High School Mathematics Edition B Compulsory Course 2
People's Education Press First Grade Mathematics Volume 2
Jiangsu Education Edition Fourth Grade Mathematics Volume 1
Qingdao Edition Seventh Grade Mathematics Volume 2
Beijing Normal University Edition Fifth Grade Mathematics Volume 2

| Category | Format | Size |
|---|---|---|
| Jiangsu Education Edition Fifth Grade Mathematics Volume 1 | pptx | 6 MB |

"Complex Bar Chart" statistical table and bar chart PPT courseware
2024-09-30
Copyright statement: This material is compiled and released by the user of Daoge Resources. The copyright belongs to the author. For commercial use, please contact the copyright owner. If there is any infringement, please contact the webmaster to remove the resource.
Download Points: 0.00
Free Download
Upgrade VIP
Favorite
Views: 4510 / Downloads: 326
Description
"Complex Bar Chart" statistical table and bar chart PPT courseware
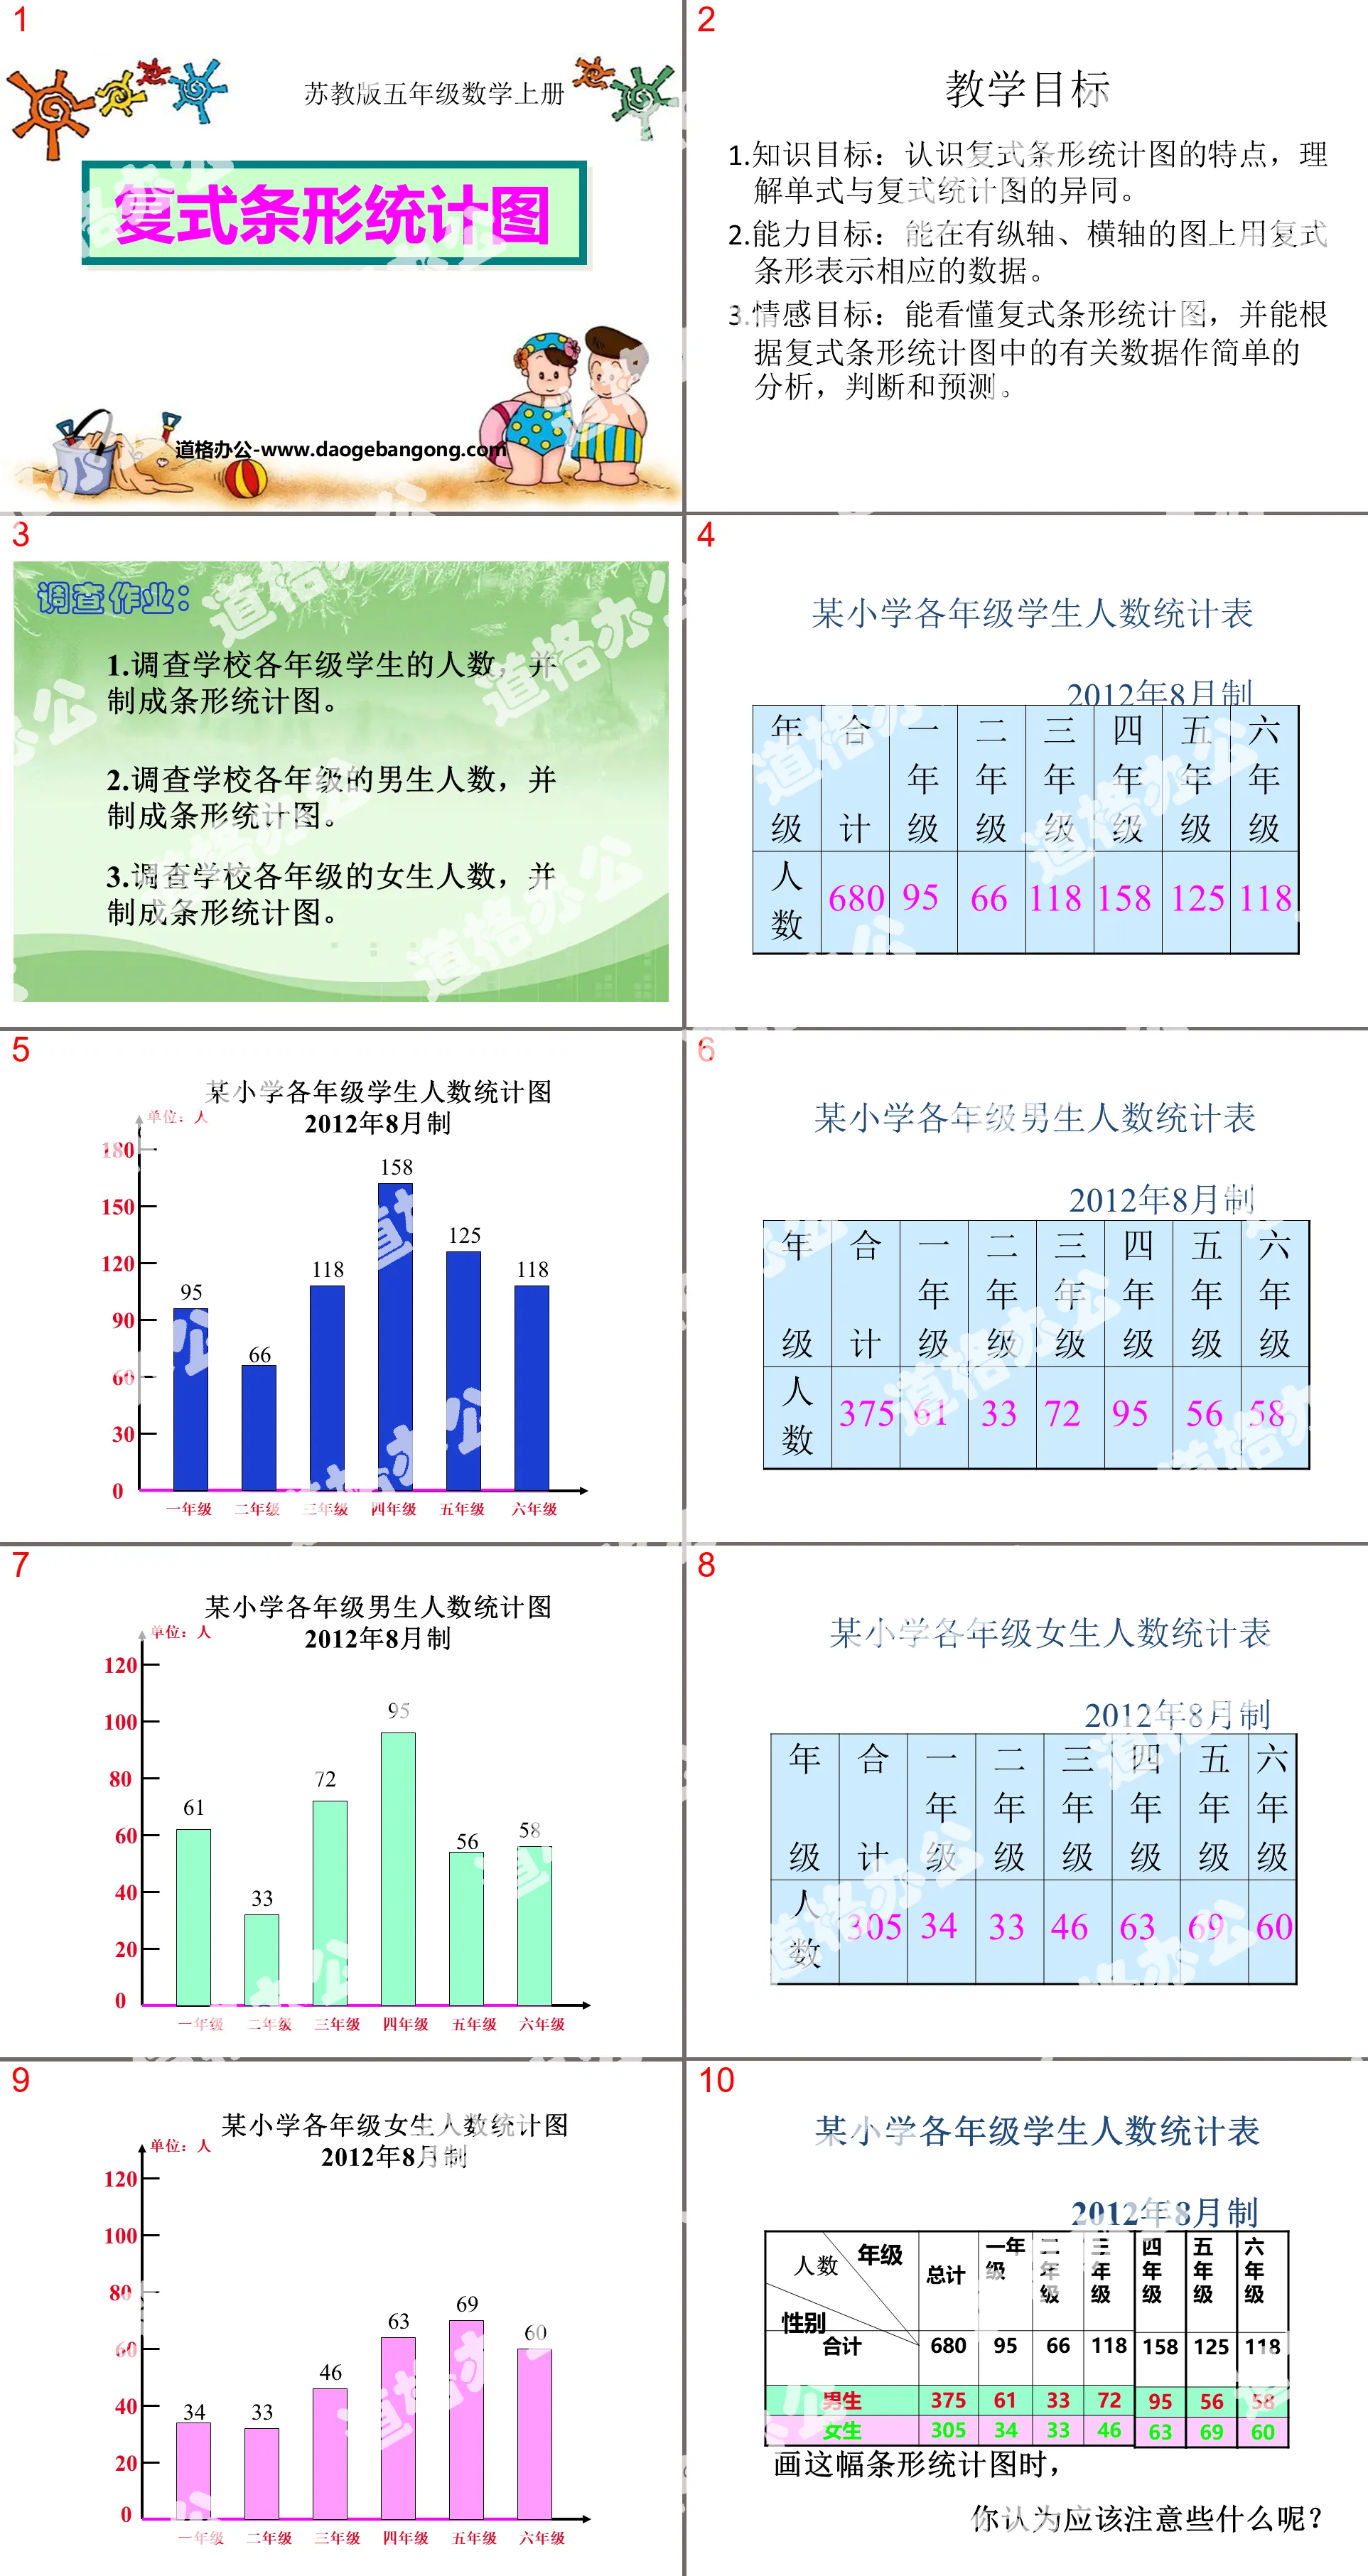
teaching objectives
1. Knowledge objectives: Understand the characteristics of compound bar charts, and understand the similarities and differences between single and compound bar charts.
2. Ability goal: be able to use compound bars to represent corresponding data on graphs with vertical and horizontal axes.
3. Emotional goal: be able to understand compound bar charts and make simple analysis, judgment and prediction based on the relevant data in the compound bar charts.
Investigation work:
1. Survey the number of students in each grade of the school and make a bar chart.
2. Survey the number of boys in each grade of the school and make a bar chart.
3. Survey the number of girls in each grade of the school and make a bar chart.
Look at the statistical chart above and answer the following questions:
1. Which workshop has the largest number of male workers? Which workshop is the least?
2. Which workshop has the largest number of female workers? Which workshop is the least?
3. How to find out which workshop has the largest number of people from the statistical chart? Which workshop has the smallest number of people?
Summary of this lesson
What statistical charts do you know? What are the characteristics? What else have you gained?
Keywords: Statistical table and bar chart courseware, compound bar chart courseware, Jiangsu Education Edition fifth grade mathematics volume PPT courseware download, fifth grade mathematics slide courseware download, statistical table and bar graph PPT courseware download, compound Bar chart PPT courseware download, .PPT format;
For more information about the PPT courseware "Complex Bar Statistical Chart and Bar Statistical Chart", please click the Compound Bar Statistical Chart ppt statistical table and Bar Statistical Chart ppt tab.
"Complex Bar Chart" PPT:
"Complex Bar Chart" PPT Part 1: Reading statistical charts. Statistical chart of the average height of students aged 6 to 12 in Xiyuan Primary School. What are the characteristics of this chart? There is a blank line from 0 to 100, and there are 5 small cells in the middle of each large cell. Each large square represents 100 centimeters..
"Complex Bar Chart" Data Representation and Analysis PPT Courseware 2:
"Complex Bar Chart" Data Representation and Analysis PPT Courseware 2 Look at the picture and answer the following questions. ⑴Which day has the biggest difference in maximum temperature between the two places? How much difference? ⑵Which day has the highest temperature difference of 25℃ between the two places? ⑶How does the maximum temperature in Zengmu Shoal change?
"Complex Bar Chart" Data Representation and Analysis PPT Courseware:
"Complex Bar Statistical Chart" Data Representation and Analysis PPT Courseware Is it farther to throw a ball with one hand or with both hands? Tell me your guess. How to verify this? Tell me, how did you get the picture below? What information can you get from statistical charts? In most cases...
File Info
Update Time: 2024-09-30
This template belongs to Mathematics courseware Jiangsu Education Edition Fifth Grade Mathematics Volume 1 industry PPT template
"Complex Bar Chart" statistical table and bar chart PPT courseware Simple campus recruitment activity planning plan summary enterprise and institution recruitment publicity lecture PPT template is a general PPT template for business post competition provided by the manuscript PPT, simple campus recruitment activity planning plan summary enterprise and institution recruitment promotion Lecture PPT template, you can edit and modify the text and pictures in the source file by downloading the source file. If you want more exquisite business PPT templates, you can come to grid resource. Doug resource PPT, massive PPT template slide material download, we only make high-quality PPT templates!
Tips: If you open the template and feel that it is not suitable for all your needs, you can search for related content "Complex Bar Chart" statistical table and bar chart PPT courseware is enough.
How to use the Windows system template
Directly decompress the file and use it with office or wps
How to use the Mac system template
Directly decompress the file and use it Office or wps can be used
Related reading
For more detailed PPT-related tutorials and font tutorials, you can view: Click to see
How to create a high-quality technological sense PPT? 4 ways to share the bottom of the box
Notice
Do not download in WeChat, Zhihu, QQ, built-in browsers, please use mobile browsers to download! If you are a mobile phone user, please download it on your computer!
1. The manuscript PPT is only for study and reference, please delete it 24 hours after downloading.
2. If the resource involves your legitimate rights and interests, delete it immediately.
3. Contact information: service@daogebangong.com
"Complex Bar Chart" statistical table and bar chart PPT courseware, due to usage restrictions, it is only for personal study and reference use. For commercial use, please go to the relevant official website for authorization.
(Personal non-commercial use refers to the use of this font to complete the display of personal works, including but not limited to the design of personal papers, resumes, etc.)
Preview
Related Search:
"Complex Bar Chart" statistical table and bar chart PPT courseware
2024-09-30
Copyright statement: This material is compiled and released by the user of Daoge Resources. The copyright belongs to the author. For commercial use, please contact the copyright owner. If there is any infringement, please contact the webmaster to remove the resource.
Download Points: 0.00
Free Download
Upgrade VIP
Favorite
Views: 4510 / Downloads: 326


