Western Normal University Edition First Grade Mathematics Volume 1
Beijing Normal University Edition Seventh Grade Mathematics Volume 1
People's Education Press First Grade Mathematics Volume 1
People's Education Press Third Grade Mathematics Volume 1
People's Education Press Second Grade Mathematics Volume 1
Hebei Education Edition Third Grade Mathematics Volume 1
Beijing Normal University Edition Seventh Grade Mathematics Volume 2
Beijing Normal University Edition Fifth Grade Mathematics Volume 1
Qingdao Edition Seventh Grade Mathematics Volume 1
Beijing Normal University Edition Eighth Grade Mathematics Volume 1
Hebei Education Edition Seventh Grade Mathematics Volume 2
People's Education High School Mathematics Edition B Compulsory Course 2
People's Education Press First Grade Mathematics Volume 2
Jiangsu Education Edition Fourth Grade Mathematics Volume 1
Qingdao Edition Seventh Grade Mathematics Volume 2
Beijing Normal University Edition Fifth Grade Mathematics Volume 2

| Category | Format | Size |
|---|---|---|
| Beijing Normal University Ninth Grade Mathematics Volume 2 | pptx | 6 MB |

"50 Years of Change" Statistics and Probability PPT Courseware 2
2024-10-02
Copyright statement: This material is compiled and released by the user of Daoge Resources. The copyright belongs to the author. For commercial use, please contact the copyright owner. If there is any infringement, please contact the webmaster to remove the resource.
Download Points: 0.00
Free Download
Upgrade VIP
Favorite
Views: 4538 / Downloads: 324
Description
"50 Years of Change" Statistics and Probability PPT Courseware 2
Discuss
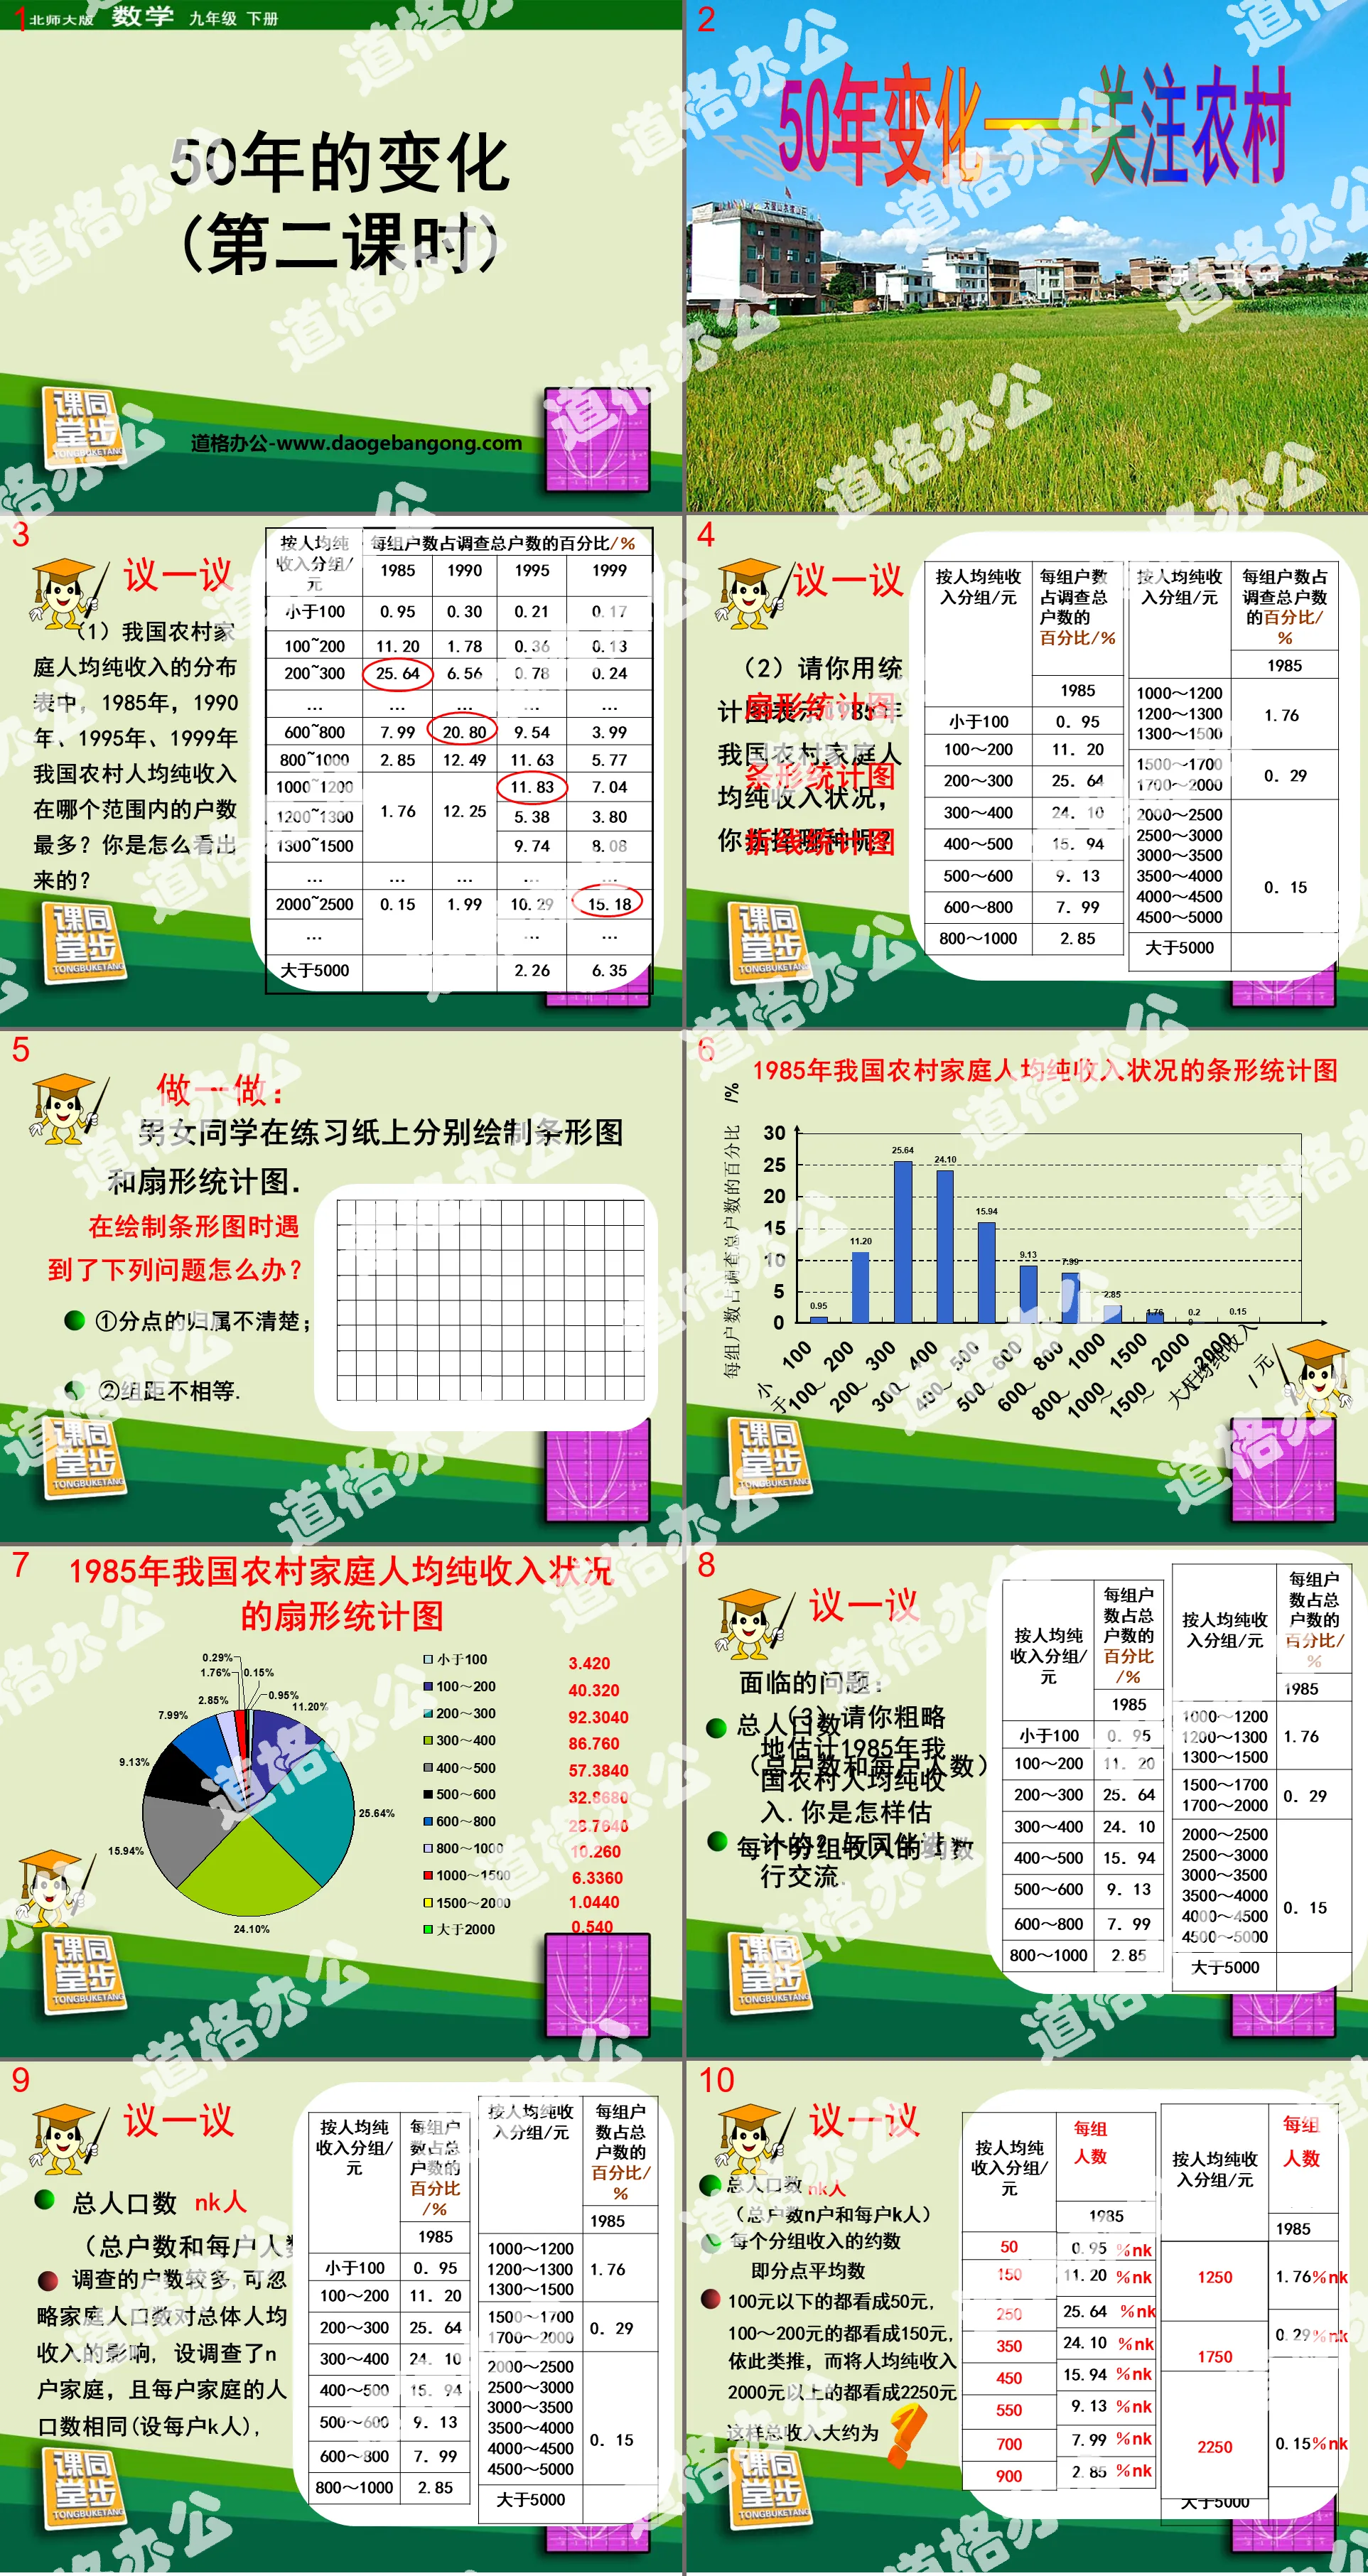
(1) In the distribution table of per capita net income of rural households in my country, in which range did the number of households have the largest number of households in 1985, 1990, 1995, and 1999? How did you figure it out?
(2) Please use a statistical chart to represent the per capita net income of rural households in my country in 1985. Which one do you choose?
(3) Please roughly estimate my country's rural per capita net income in 1985. How did you estimate it? Communicate with peers.
Think about it and do the math:
What calculation formula can you think of from the algorithm just now? Where have you used similar formulas?
The formula for calculating the weighted average, in which the percentage can be regarded as the weight of the per capita net income of each group.
Discuss
50×0.95%nk+150×11.20%nk+250×25.64%nk+350×24.10%nk+450×15.94%nk+550×9.13%nk+700×7.99%nk+900×2.85%nk+1250× 1.76%nk+1750×0.29%
+2250×0.15%nk=399.70nk(yuan)
Therefore, the per capita net income of rural residents in my country in 1985 was approximately 399.70nk÷nk=399.70 (yuan)
Do it:
The wavelet learning group investigated the family size of some residents in a certain city and drew the fan-shaped statistical chart below. Find the mode and average of the family population of this part of the population.
What gains and insights did you gain from this class...
Feel the rapid changes in the motherland
consolidated weighted average
Able to choose appropriate statistical charts to represent information
Improve the ability to read pictures and read information
Keywords: Statistics and Probability Teaching Courseware, 50 Years of Change Teaching Courseware, Beijing Normal University Edition Ninth Grade Volume 2 Mathematics PPT Courseware, Ninth Grade Mathematics Slide Courseware Download, Statistics and Probability PPT Courseware Download, 50 Years of Change PPT Courseware Download ,.ppt format
For more information about the PPT courseware "Statistics and Probability Changes in 50 Years", please click the "Statistics and Probability ppt Changes in 50 Years" ppt tag.
"50 Years of Change" Statistics and Probability PPT Courseware 3:
"50 Years of Change" Statistics and Probability PPT Courseware 3 Since the 1950s, my country's transportation situation has undergone tremendous changes. The following table reflects the changes in the length of transportation lines in our country over the past 50 years. (1) In railways, highways, inland waterway shipping, civil aviation...
"50 Years of Change" Statistics and Probability PPT Courseware:
"50 Years of Change" Statistics and Probability PPT Courseware Discuss: (1) Among the transportation modes of railways, highways, inland shipping, and civil aviation, which one has developed more rapidly in recent years? (2) Which mode of transportation has developed the slowest or even experienced negative effects for many years..
File Info
Update Time: 2024-10-02
This template belongs to Mathematics courseware Beijing Normal University Ninth Grade Mathematics Volume 2 industry PPT template
"50 Years of Change" Statistics and Probability PPT Courseware 2 Simple campus recruitment activity planning plan summary enterprise and institution recruitment publicity lecture PPT template is a general PPT template for business post competition provided by the manuscript PPT, simple campus recruitment activity planning plan summary enterprise and institution recruitment promotion Lecture PPT template, you can edit and modify the text and pictures in the source file by downloading the source file. If you want more exquisite business PPT templates, you can come to grid resource. Doug resource PPT, massive PPT template slide material download, we only make high-quality PPT templates!
Tips: If you open the template and feel that it is not suitable for all your needs, you can search for related content "50 Years of Change" Statistics and Probability PPT Courseware 2 is enough.
How to use the Windows system template
Directly decompress the file and use it with office or wps
How to use the Mac system template
Directly decompress the file and use it Office or wps can be used
Related reading
For more detailed PPT-related tutorials and font tutorials, you can view: Click to see
How to create a high-quality technological sense PPT? 4 ways to share the bottom of the box
Notice
Do not download in WeChat, Zhihu, QQ, built-in browsers, please use mobile browsers to download! If you are a mobile phone user, please download it on your computer!
1. The manuscript PPT is only for study and reference, please delete it 24 hours after downloading.
2. If the resource involves your legitimate rights and interests, delete it immediately.
3. Contact information: service@daogebangong.com
"50 Years of Change" Statistics and Probability PPT Courseware 2, due to usage restrictions, it is only for personal study and reference use. For commercial use, please go to the relevant official website for authorization.
(Personal non-commercial use refers to the use of this font to complete the display of personal works, including but not limited to the design of personal papers, resumes, etc.)
Preview
Related Search:
"50 Years of Change" Statistics and Probability PPT Courseware 2
2024-10-02
Copyright statement: This material is compiled and released by the user of Daoge Resources. The copyright belongs to the author. For commercial use, please contact the copyright owner. If there is any infringement, please contact the webmaster to remove the resource.
Download Points: 0.00
Free Download
Upgrade VIP
Favorite
Views: 4538 / Downloads: 324


