Western Normal University Edition First Grade Mathematics Volume 1
Beijing Normal University Edition Seventh Grade Mathematics Volume 1
People's Education Press First Grade Mathematics Volume 1
People's Education Press Third Grade Mathematics Volume 1
People's Education Press Second Grade Mathematics Volume 1
Hebei Education Edition Third Grade Mathematics Volume 1
Beijing Normal University Edition Seventh Grade Mathematics Volume 2
Beijing Normal University Edition Fifth Grade Mathematics Volume 1
Qingdao Edition Seventh Grade Mathematics Volume 1
Hebei Education Edition Seventh Grade Mathematics Volume 2
Beijing Normal University Edition Eighth Grade Mathematics Volume 1
People's Education High School Mathematics Edition B Compulsory Course 2
Jiangsu Education Edition Fourth Grade Mathematics Volume 1
People's Education Press First Grade Mathematics Volume 2
Qingdao Edition Seventh Grade Mathematics Volume 2
Beijing Normal University Edition Fifth Grade Mathematics Volume 2

| Category | Format | Size |
|---|---|---|
| People's Education Press Eighth Grade Mathematics Volume 2 | pptx | 6 MB |

"Median and Mode" Data Analysis PPT Courseware
2024-10-02
Copyright statement: This material is compiled and released by the user of Daoge Resources. The copyright belongs to the author. For commercial use, please contact the copyright owner. If there is any infringement, please contact the webmaster to remove the resource.
Download Points: 0.00
Free Download
Upgrade VIP
Favorite
Views: 1977 / Downloads: 423
Description
"Median and Mode" Data Analysis PPT Courseware
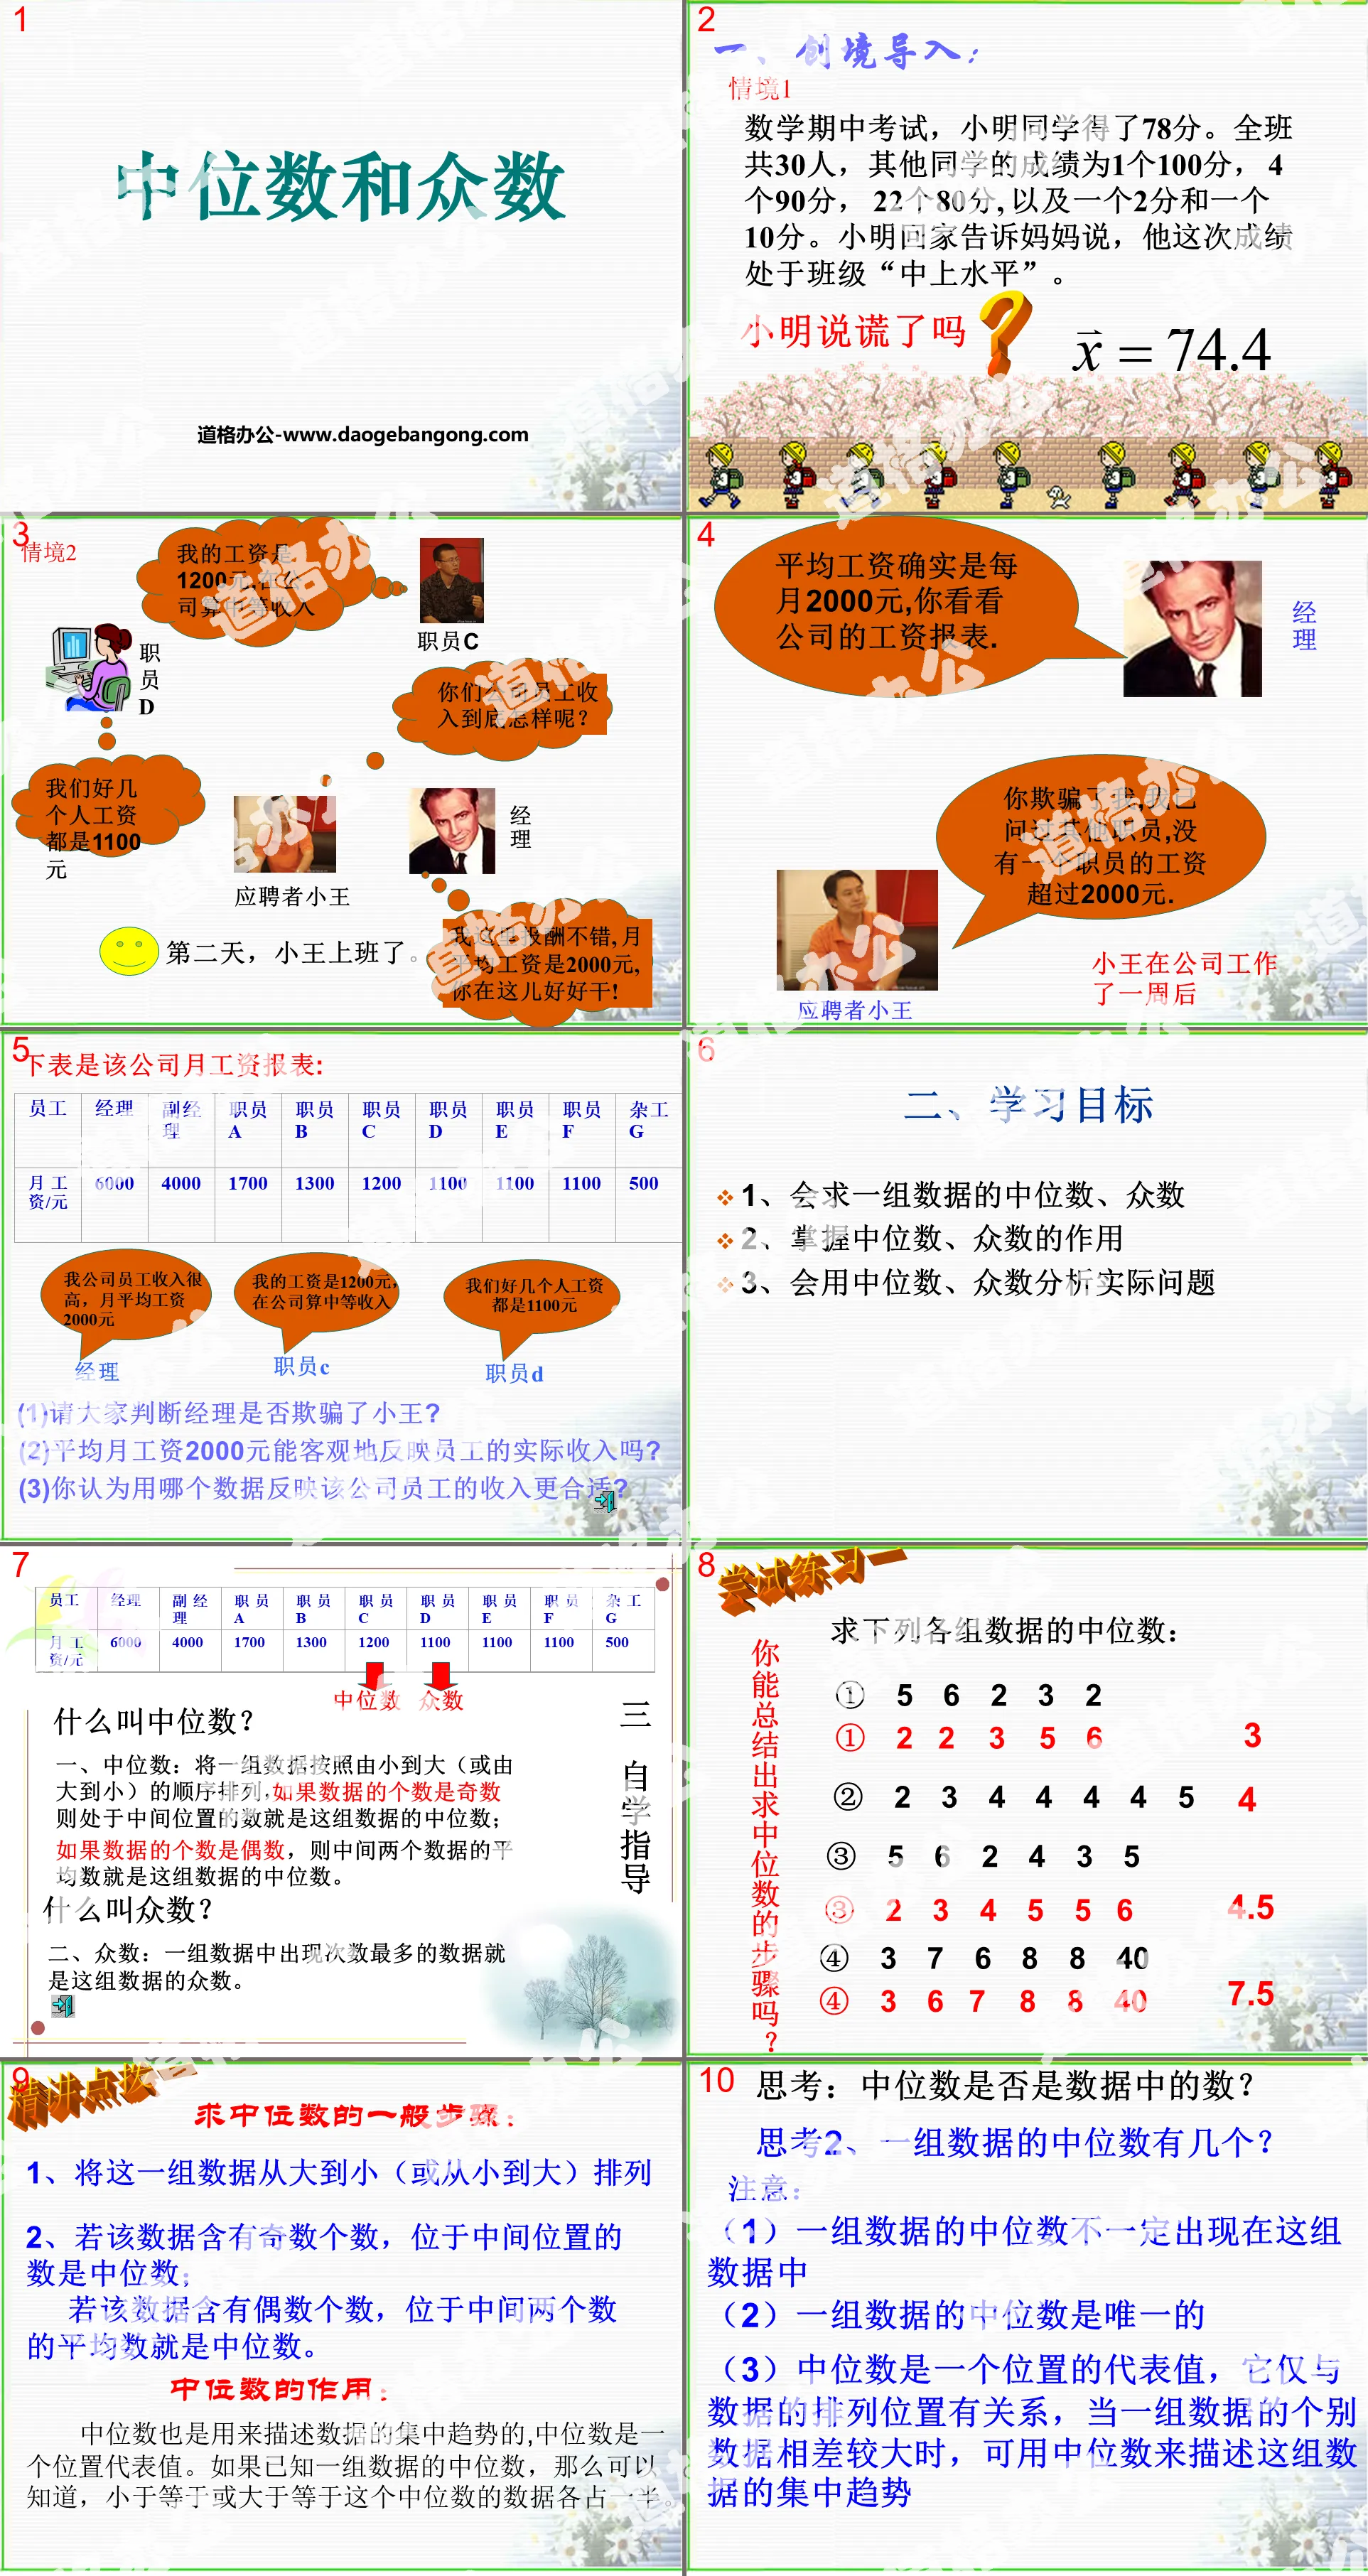
learning target
1. Able to find the median and mode of a set of data
2. Master the functions of median and mode
3. Be able to use median and mode to analyze practical problems
What is the median?
1. Median: Arrange a set of data in order from small to large (or large to small), then the number in the middle is the median of this set of data;
If the number of data is an even number, the average of the two middle data is the median of the set of data.
What is the majority?
2. Mode: The data that appears most frequently in a set of data is the mode of this set of data.
General steps for finding the median:
1. Arrange this set of data from large to small (or from small to large)
2. If the data contains an odd number, the number in the middle is the median;
If the data contains an even number, the average of the two middle numbers is the median.
The role of the median:
The median is also used to describe the central tendency of the data. The median is a position representative value. If you know the median of a set of data, you can know that half of the data are less than or equal to the median or greater than or equal to the median.
Thinking 2. How many medians are there in a set of data?
Notice:
(1) The median of a set of data does not necessarily appear in this set of data
(2) The median of a set of data is unique
(3) The median is a representative value of a position. It is only related to the arrangement position of the data. When the individual data of a set of data differ greatly, the median can be used to describe the central tendency of this set of data.
think about it
The difference between average and median
When calculating the average, all data participates in the calculation. It can make full use of the information provided by the data, but it is easily affected by extreme values. It is the most widely used.
The advantage of the median is that it is simple to calculate and only depends on its position in the data. But not all data information can be fully utilized.
In a marathon long-distance race, the results of 12 runners are as follows (unit: points) 136, 140, 129, 180, 124, 154
145 146 158 176 165 148
①What is the median of the sample data (the results of 12 players)?
②A player’s score is 142 points. What is his score?
Solution: ①First arrange the sample data in order from small to large:
124 129 136 140 145 146
148 154 158 165 175 180
Then the median of this set of data is (146 + 148) = 147
So the median of the sample data is 147.
② Based on the conclusion of the sample data in ①, it can be estimated that in the overall score of this marathon, about half of the runners scored slower than 147 points, and about half of the runners scored faster than 147 points, so the score was 142 minute players had better results than more than half of the players.
Instructions and advice
1. When multiple data appear the same number of times in a set of data, these data are the mode of the set of data.
2. The role of mode
The mode is often used as a representative of a set of data to describe the central tendency of the data. When a set of data has a lot of repeated data, the mode is often a quantity that people care about.
Thinking: Does the mode of a set of data necessarily appear in this set of data?
Notice:
(1) The mode of a set of data must appear in this set of data
(2) A set of data may have more than one mode.
(3) The mode is the data that appears most often in a set of data rather than the number of times the data appears. For example, the mode in 1, 1, 1, 2, 2, and 5 is 1 instead of 3.
Summary and reflection:
How to find the median and mode of a set of data? What should I pay attention to?
1. To find the median, you need to sort a set of data in order of size. As the name suggests, the median is the middle number (or the average of the two middle numbers). When sorting, sort from small to large or from large to large. It can be from small to small.
2. The mode is the data that appears most frequently in a set of data. It is the original data in a set of data, not the corresponding number. The mode may not be unique, so be careful not to miss it.
3. The role of the median: The median is also used to describe the central tendency of the data. It is a position representative value. If you know the median of a set of data, you can know that approximately half of the data are smaller than or larger than the median.
4. The role of the mode: The mode is often used as a representative of a set of data to describe the central tendency of the data. When a set of data has a lot of repeated data, the mode is often a quantity that people care about.
Keywords: Data analysis teaching courseware, median and mode teaching courseware, New People's Education Edition eighth grade mathematics volume 2 PPT courseware, eighth grade mathematics slide courseware download, data analysis PPT courseware download, median and mode Digital PPT courseware download, .ppt format
For more information about the "Analysis of Median and Mode Data" PPT courseware, please click the Analysis of Median and Mode PPT Data ppt tab.
"Median and Mode" PPT:
"Median and Mode" PPT Part One Content: Teaching Objectives 1. Understand and be able to find the median and mode of a set of data in actual situations. 2. According to specific problems, be able to select appropriate statistical tables to represent different characteristics of the data. 3. Feel statistics in life..
"Median and Mode" PPT Courseware 2:
"Median and Mode" PPT Courseware 2 The average, median and mode can all be used as representatives of a set of data. They each have their own characteristics and can provide information from different angles. The average is obtained through calculation, using the information of all the data, and is a practical question...
"Median and Mode" PPT courseware:
"Median and Mode" PPT courseware 1. Arrange n pieces of data in order from small to large (or from large to small). If n is an odd number, then the number at the _______ position is called the median of this set of data; if n is an even number, then the number in the middle position is _____ of data..
File Info
Update Time: 2024-10-02
This template belongs to Mathematics courseware People's Education Press Eighth Grade Mathematics Volume 2 industry PPT template
"Median and Mode" Data Analysis PPT Courseware Simple campus recruitment activity planning plan summary enterprise and institution recruitment publicity lecture PPT template is a general PPT template for business post competition provided by the manuscript PPT, simple campus recruitment activity planning plan summary enterprise and institution recruitment promotion Lecture PPT template, you can edit and modify the text and pictures in the source file by downloading the source file. If you want more exquisite business PPT templates, you can come to grid resource. Doug resource PPT, massive PPT template slide material download, we only make high-quality PPT templates!
Tips: If you open the template and feel that it is not suitable for all your needs, you can search for related content "Median and Mode" Data Analysis PPT Courseware is enough.
How to use the Windows system template
Directly decompress the file and use it with office or wps
How to use the Mac system template
Directly decompress the file and use it Office or wps can be used
Related reading
For more detailed PPT-related tutorials and font tutorials, you can view: Click to see
How to create a high-quality technological sense PPT? 4 ways to share the bottom of the box
Notice
Do not download in WeChat, Zhihu, QQ, built-in browsers, please use mobile browsers to download! If you are a mobile phone user, please download it on your computer!
1. The manuscript PPT is only for study and reference, please delete it 24 hours after downloading.
2. If the resource involves your legitimate rights and interests, delete it immediately.
3. Contact information: service@daogebangong.com
"Median and Mode" Data Analysis PPT Courseware, due to usage restrictions, it is only for personal study and reference use. For commercial use, please go to the relevant official website for authorization.
(Personal non-commercial use refers to the use of this font to complete the display of personal works, including but not limited to the design of personal papers, resumes, etc.)
Preview
Related Search:
"Median and Mode" Data Analysis PPT Courseware
2024-10-02
Copyright statement: This material is compiled and released by the user of Daoge Resources. The copyright belongs to the author. For commercial use, please contact the copyright owner. If there is any infringement, please contact the webmaster to remove the resource.
Download Points: 0.00
Free Download
Upgrade VIP
Favorite
Views: 1977 / Downloads: 423


