Western Normal University Edition First Grade Mathematics Volume 1
Beijing Normal University Edition Seventh Grade Mathematics Volume 1
People's Education Press First Grade Mathematics Volume 1
People's Education Press Third Grade Mathematics Volume 1
People's Education Press Second Grade Mathematics Volume 1
Beijing Normal University Edition Seventh Grade Mathematics Volume 2
Hebei Education Edition Third Grade Mathematics Volume 1
Beijing Normal University Edition Fifth Grade Mathematics Volume 1
Qingdao Edition Seventh Grade Mathematics Volume 1
Beijing Normal University Edition Eighth Grade Mathematics Volume 1
Hebei Education Edition Seventh Grade Mathematics Volume 2
People's Education High School Mathematics Edition B Compulsory Course 2
Qingdao Edition Seventh Grade Mathematics Volume 2
People's Education Press First Grade Mathematics Volume 2
Beijing Normal University Edition Fifth Grade Mathematics Volume 2
Jiangsu Education Edition Fourth Grade Mathematics Volume 1

| Category | Format | Size |
|---|---|---|
| People's Education Press Eighth Grade Mathematics Volume 2 | pptx | 6 MB |

"Range and Variance" Data Analysis PPT Courseware
2024-09-28
Copyright statement: This material is compiled and released by the user of Daoge Resources. The copyright belongs to the author. For commercial use, please contact the copyright owner. If there is any infringement, please contact the webmaster to remove the resource.
Download Points: 0.00
Free Download
Upgrade VIP
Favorite
Views: 4187 / Downloads: 59
Description
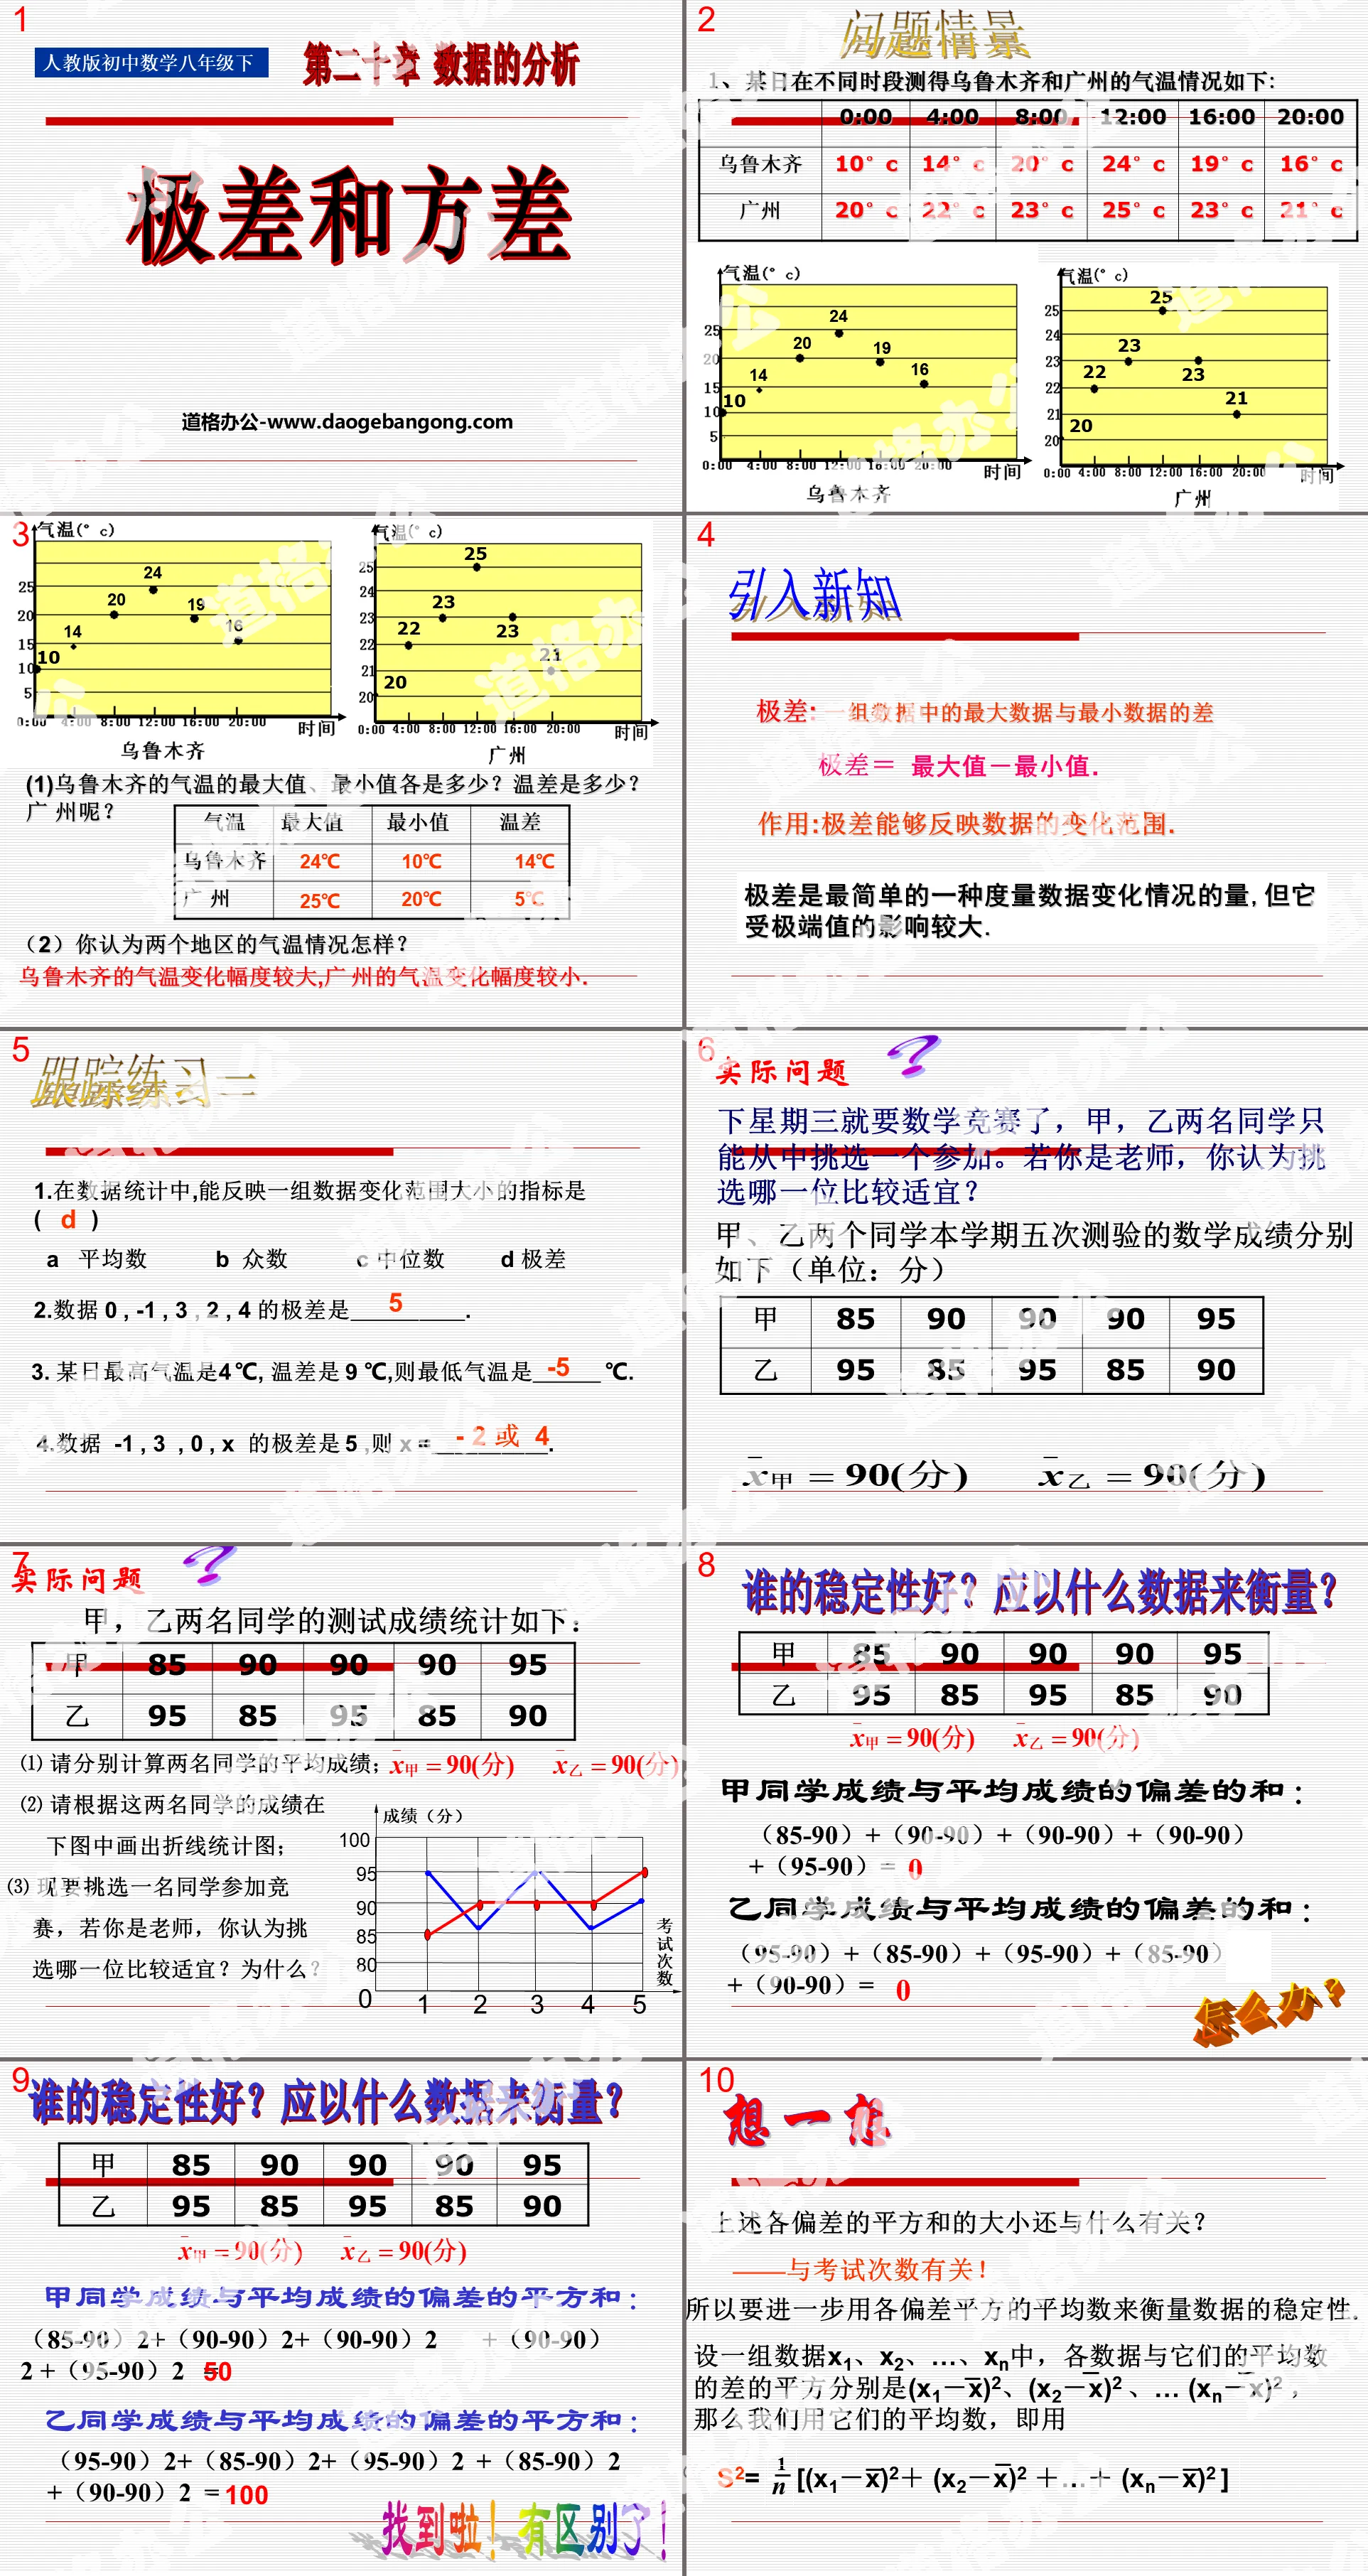
"Range and Variance" Data Analysis PPT Courseware
Introduce new knowledge
Range: the difference between the largest data and the smallest data in a set of data
Range = maximum value – minimum value.
Function: Range can reflect the range of changes in data.
Range is the simplest quantity that measures changes in data, but it is greatly affected by extreme values.
Tracking exercise one
1. In data statistics, the indicator that can reflect the change range of a set of data is ()
A mean B mode C median D range
2.The range of data 0, -1, 3, 2, 4 is _____.
3. The highest temperature on a certain day is 4 ℃, and the temperature difference is 9 ℃, then the lowest temperature is _____ ℃.
4. The range of the data -1, 3, 0, x is 5, then x =_____.
Who has better stability? What data should be used to measure it?
The sum of the deviations between student A’s grades and the average grade:
(85-90)+(90-90)+(90-90)+(90-90)+(95-90)=0
The sum of the deviations between student B’s grades and the average grade:
(95-90)+(85-90)+(95-90)+(85-90)+(90-90)=0
think about it
What else is related to the sum of the squares of the above deviations?
——Related to the number of exams!
Therefore, the average of the squared deviations should be further used to measure the stability of the data.
Assume that in a set of data x1, Use their average, that is, use
S2=1/n[(x1-x)2+ (x2-x)2 +…+ (xn-x)2 ]
Tracking exercise two
1. The function of sample variance is ( )
(A) represents the overall average level
(B) represents the average level of the sample
(C) Accurately represents the overall fluctuation size
(D) represents the fluctuation size of the sample
2. The variance of samples 5, 6, 7, 8, and 9 is _______.
3. The calculation formula of sample variance S2=1/10[(x1-20)²+(x2-20)²+....(xn-20)²]
The number 10 means _______ and the number 20 means _______.
The difference and connection between range and variance:
Connection: Range and variance are both indicators used to measure (or describe) the deviation of a set of data from the mean (i.e., the size of the fluctuation). They are often used to compare the fluctuations of two sets of data.
Difference: Range uses the difference between the maximum value and the minimum value in a set of data to reflect the range of data changes. It mainly reflects the difference between two extreme values in a set of data and is insensitive to fluctuations in other data.
The variance is the result obtained by using the method of "first average, then find the difference, then square, and finally average again". It mainly reflects the fluctuation of the entire set of data. It is an important indicator that reflects the degree of dispersion of a set of data from its average value. Each Changes in the data will affect the variance results.
In actual use, the variance of a set of data is often calculated to measure the fluctuation of a set of data.
Variance can be used for comparison only when the sample sizes of the two sets of data are the same and the means are equal or similar.
The unit of variance is the square of the original data unit.
Do you remember it?
1. The concepts and calculations of range and variance.
2. The variation range of extreme response data,
3. The variance represents the degree of dispersion (fluctuation) of the data. The larger the variance, the more dispersed the data distribution, the larger the fluctuation, and the more unstable it is.
4. Use the sample variance to estimate the population variance
Keywords: data analysis teaching courseware, range and variance teaching courseware, New People's Education Edition eighth grade mathematics volume 2 PPT courseware, eighth grade mathematics slide courseware download, data analysis PPT courseware download, range and variance PPT courseware download ,.ppt format
For more information about the "Analysis of Data Range and Variance" PPT courseware, please click the "Analysis of Data ppt Range and Variance ppt" tag.
"Range and Variance" Data Analysis PPT Courseware 2:
"Range and Variance" Data Analysis PPT Courseware 2 Review 1. The variance of data 0, -3, 1, -2, -3, 2, 3 is ( ) A -3 B 3 C -6 D 6 2. Two Basketball players compete in a shooting competition. If the variance of player A's performance is 0.12, the variance of player B's performance is...
File Info
Update Time: 2024-09-28
This template belongs to Mathematics courseware People's Education Press Eighth Grade Mathematics Volume 2 industry PPT template
"Range and Variance" Data Analysis PPT Courseware Simple campus recruitment activity planning plan summary enterprise and institution recruitment publicity lecture PPT template is a general PPT template for business post competition provided by the manuscript PPT, simple campus recruitment activity planning plan summary enterprise and institution recruitment promotion Lecture PPT template, you can edit and modify the text and pictures in the source file by downloading the source file. If you want more exquisite business PPT templates, you can come to grid resource. Doug resource PPT, massive PPT template slide material download, we only make high-quality PPT templates!
Tips: If you open the template and feel that it is not suitable for all your needs, you can search for related content "Range and Variance" Data Analysis PPT Courseware is enough.
How to use the Windows system template
Directly decompress the file and use it with office or wps
How to use the Mac system template
Directly decompress the file and use it Office or wps can be used
Related reading
For more detailed PPT-related tutorials and font tutorials, you can view: Click to see
How to create a high-quality technological sense PPT? 4 ways to share the bottom of the box
Notice
Do not download in WeChat, Zhihu, QQ, built-in browsers, please use mobile browsers to download! If you are a mobile phone user, please download it on your computer!
1. The manuscript PPT is only for study and reference, please delete it 24 hours after downloading.
2. If the resource involves your legitimate rights and interests, delete it immediately.
3. Contact information: service@daogebangong.com
"Range and Variance" Data Analysis PPT Courseware, due to usage restrictions, it is only for personal study and reference use. For commercial use, please go to the relevant official website for authorization.
(Personal non-commercial use refers to the use of this font to complete the display of personal works, including but not limited to the design of personal papers, resumes, etc.)
Preview
Related Search:
"Range and Variance" Data Analysis PPT Courseware
2024-09-28
Copyright statement: This material is compiled and released by the user of Daoge Resources. The copyright belongs to the author. For commercial use, please contact the copyright owner. If there is any infringement, please contact the webmaster to remove the resource.
Download Points: 0.00
Free Download
Upgrade VIP
Favorite
Views: 4187 / Downloads: 59


