
| Category | Format | Size |
|---|---|---|
| People's Education Press Eighth Grade Mathematics Volume 2 | pptx | 6 MB |

"Range and Variance" Data Analysis PPT Courseware 2
Description
"Range and Variance" Data Analysis PPT Courseware 2
review
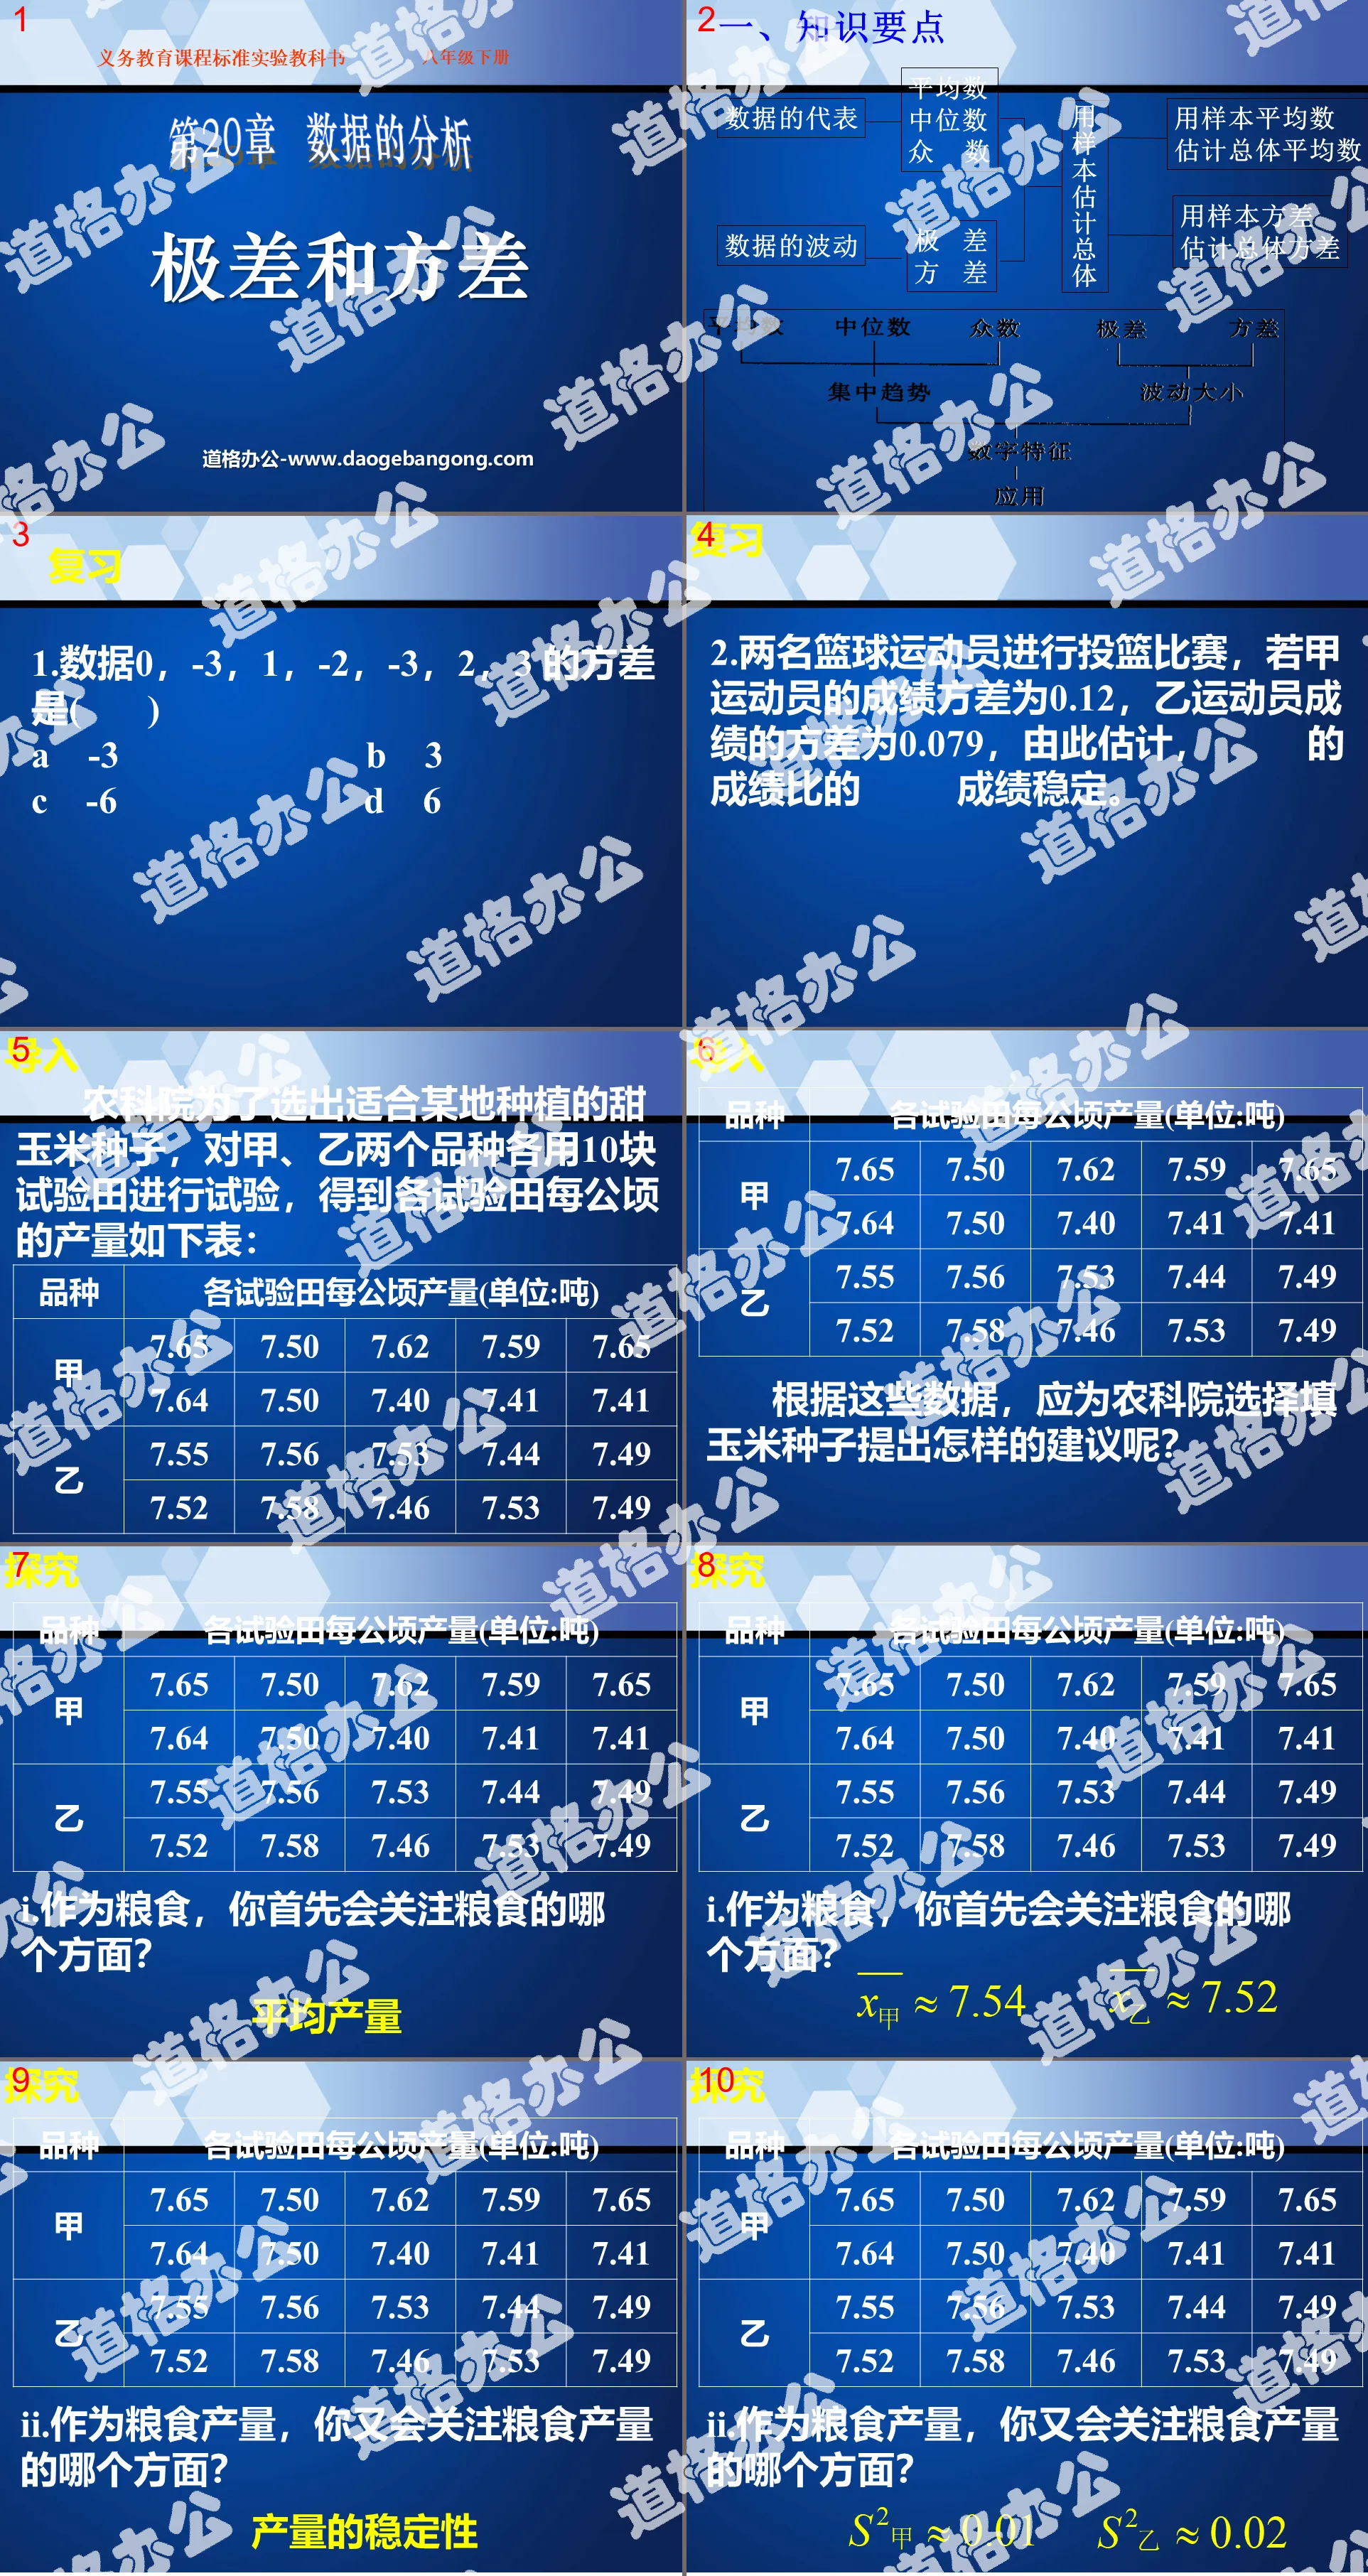
1. The variance of data 0, -3, 1, -2, -3, 2, 3 is ( )
A -3 B 3
C -6 D 6
2. Two basketball players compete in a shooting competition. If the variance of athlete A’s scores is 0.12 and the variance of athlete B’s scores is 0.079, it is estimated that ____’s scores are more stable than ____’s scores.
induction
How to use statistics:
Many practical problems can be solved with statistical knowledge. When you want to make the best choice among several different options, you must first clarify the purpose of choosing the option, then consider the entry point of the problem and select appropriate statistics to compare, so as to make the right choice.
practise
A 74 74 75 74 76 73 76 73 76
75 78 77 74 72 73
B 75 73 79 72 76 71 73 72 78
74 77 78 80 71 75
Which agricultural and sideline products processing factory do you think fast food companies should choose to produce chicken legs?
consolidate
1. Two machine tools A and B produce a kind of part at the same time. In 10 days, the number of defective products produced by the two machine tools every day is
A 0 1 0 2 2 0 3 1 2 4
B 2 3 1 1 0 2 1 1 0 1
(1) Calculate the mean and variance of the two sets of data respectively;
(2) Judging from the calculation results, which machine tool produced the smaller average number of defective products in 10 days? Which machine tool has less fluctuation in defective products?
practise:
1. In the calculation formula of variance
S2=1/10[(x1-20)2+(x2-20)2+....+(x10-20)2], the numbers 10 and 20 respectively represent ( )
A. Sample capacity and variance B. Mean and sample capacity
C. Capacity and mean of the sample D. Variance and mean of the sample
illustrate:
①The average is an indicator that reflects the overall trend of a set of data, and the variance is an indicator that indicates the degree of dispersion of a set of data. Therefore, the variance should be used in (2).
②The steps for calculating the variance can be summarized as "average first, then find the difference, square it, and then average".
Example 3. (P144——Question 3.) In order to examine the growth of wheat A and wheat B, 10 seedlings were extracted from them respectively, and the seedling heights were measured as follows (unit: cm):
A: 12 13 14 15 10 16 13 11 15 11
B: 11 16 17 14 13 19 6 8 10 16
Which type of wheat grows more neatly?
Thinking: What are the general steps to find the variance of data?
1. Find the average of the data;
2. Use the variance formula to find the variance.
Please use your findings to solve the following problems:
It is known that the mean of data a1, a2, a3,...,an is X and the variance is Y, then
①The average of data a1+3, a2 + 3, a3 +3,..., an +3 is --------, and the variance is -------
②The average of data a1-3, a2 -3, a3 -3,..., an -3 is ----------, and the variance is --------
③The average of data 3a1, 3a2, 3a3,...,3an is -----------, and the variance is ----------.
④The average of data 2a1-3, 2a2 -3, 2a3 -3,..., 2an -3 is ----------, and the variance is ----------.
Keywords: data analysis teaching courseware, range and variance teaching courseware, New People's Education Edition eighth grade mathematics volume 2 PPT courseware, eighth grade mathematics slide courseware download, data analysis PPT courseware download, range and variance PPT courseware download ,.ppt format
For more information about the "Analysis of Data Range and Variance" PPT courseware, please click the "Analysis of Data ppt Range and Variance ppt" tag.
"Range and Variance" data analysis PPT courseware:
"Range and Variance" data analysis PPT courseware introduces new knowledge Range: the difference between the maximum data and the minimum data in a set of data Range = maximum value - minimum value. Function: Range can reflect the range of changes in data. Range is the simplest way to measure changes in data..
File Info
Update Time: 2024-06-29
This template belongs to Mathematics courseware People's Education Press Eighth Grade Mathematics Volume 2 industry PPT template
"Range and Variance" Data Analysis PPT Courseware 2 Simple campus recruitment activity planning plan summary enterprise and institution recruitment publicity lecture PPT template is a general PPT template for business post competition provided by the manuscript PPT, simple campus recruitment activity planning plan summary enterprise and institution recruitment promotion Lecture PPT template, you can edit and modify the text and pictures in the source file by downloading the source file. If you want more exquisite business PPT templates, you can come to grid resource. Doug resource PPT, massive PPT template slide material download, we only make high-quality PPT templates!
Tips: If you open the template and feel that it is not suitable for all your needs, you can search for related content "Range and Variance" Data Analysis PPT Courseware 2 is enough.
How to use the Windows system template
Directly decompress the file and use it with office or wps
How to use the Mac system template
Directly decompress the file and use it Office or wps can be used
Related reading
For more detailed PPT-related tutorials and font tutorials, you can view: Click to see
How to create a high-quality technological sense PPT? 4 ways to share the bottom of the box
Notice
Do not download in WeChat, Zhihu, QQ, built-in browsers, please use mobile browsers to download! If you are a mobile phone user, please download it on your computer!
1. The manuscript PPT is only for study and reference, please delete it 24 hours after downloading.
2. If the resource involves your legitimate rights and interests, delete it immediately.
3. Contact information: service@daogebangong.com
"Range and Variance" Data Analysis PPT Courseware 2, due to usage restrictions, it is only for personal study and reference use. For commercial use, please go to the relevant official website for authorization.
(Personal non-commercial use refers to the use of this font to complete the display of personal works, including but not limited to the design of personal papers, resumes, etc.)
Preview
Related Search: