Western Normal University Edition First Grade Mathematics Volume 1
Beijing Normal University Edition Seventh Grade Mathematics Volume 1
People's Education Press First Grade Mathematics Volume 1
People's Education Press Third Grade Mathematics Volume 1
People's Education Press Second Grade Mathematics Volume 1
Hebei Education Edition Third Grade Mathematics Volume 1
Beijing Normal University Edition Seventh Grade Mathematics Volume 2
Beijing Normal University Edition Fifth Grade Mathematics Volume 1
Qingdao Edition Seventh Grade Mathematics Volume 1
Beijing Normal University Edition Eighth Grade Mathematics Volume 1
Hebei Education Edition Seventh Grade Mathematics Volume 2
People's Education High School Mathematics Edition B Compulsory Course 2
People's Education Press First Grade Mathematics Volume 2
Jiangsu Education Edition Fourth Grade Mathematics Volume 1
Qingdao Edition Seventh Grade Mathematics Volume 2
Beijing Normal University Edition Fifth Grade Mathematics Volume 2
| Category | Format | Size |
|---|---|---|
| People's Education Press Seventh Grade Mathematics Volume 2 | pptx | 6 MB |

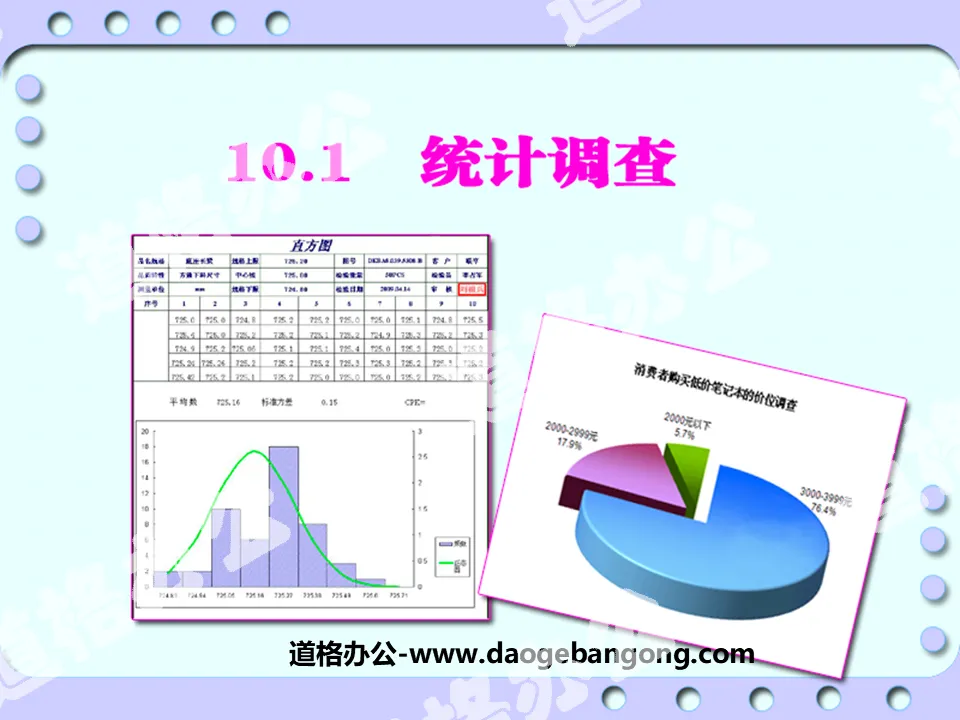
"Statistical Survey" data collection, arrangement and description PPT courseware 7
2024-10-02
Copyright statement: This material is compiled and released by the user of Daoge Resources. The copyright belongs to the author. For commercial use, please contact the copyright owner. If there is any infringement, please contact the webmaster to remove the resource.
Download Points: 0.00
Free Download
Upgrade VIP
Favorite
Views: 1156 / Downloads: 985
Description
"Statistical Survey" data collection, arrangement and description PPT courseware 7
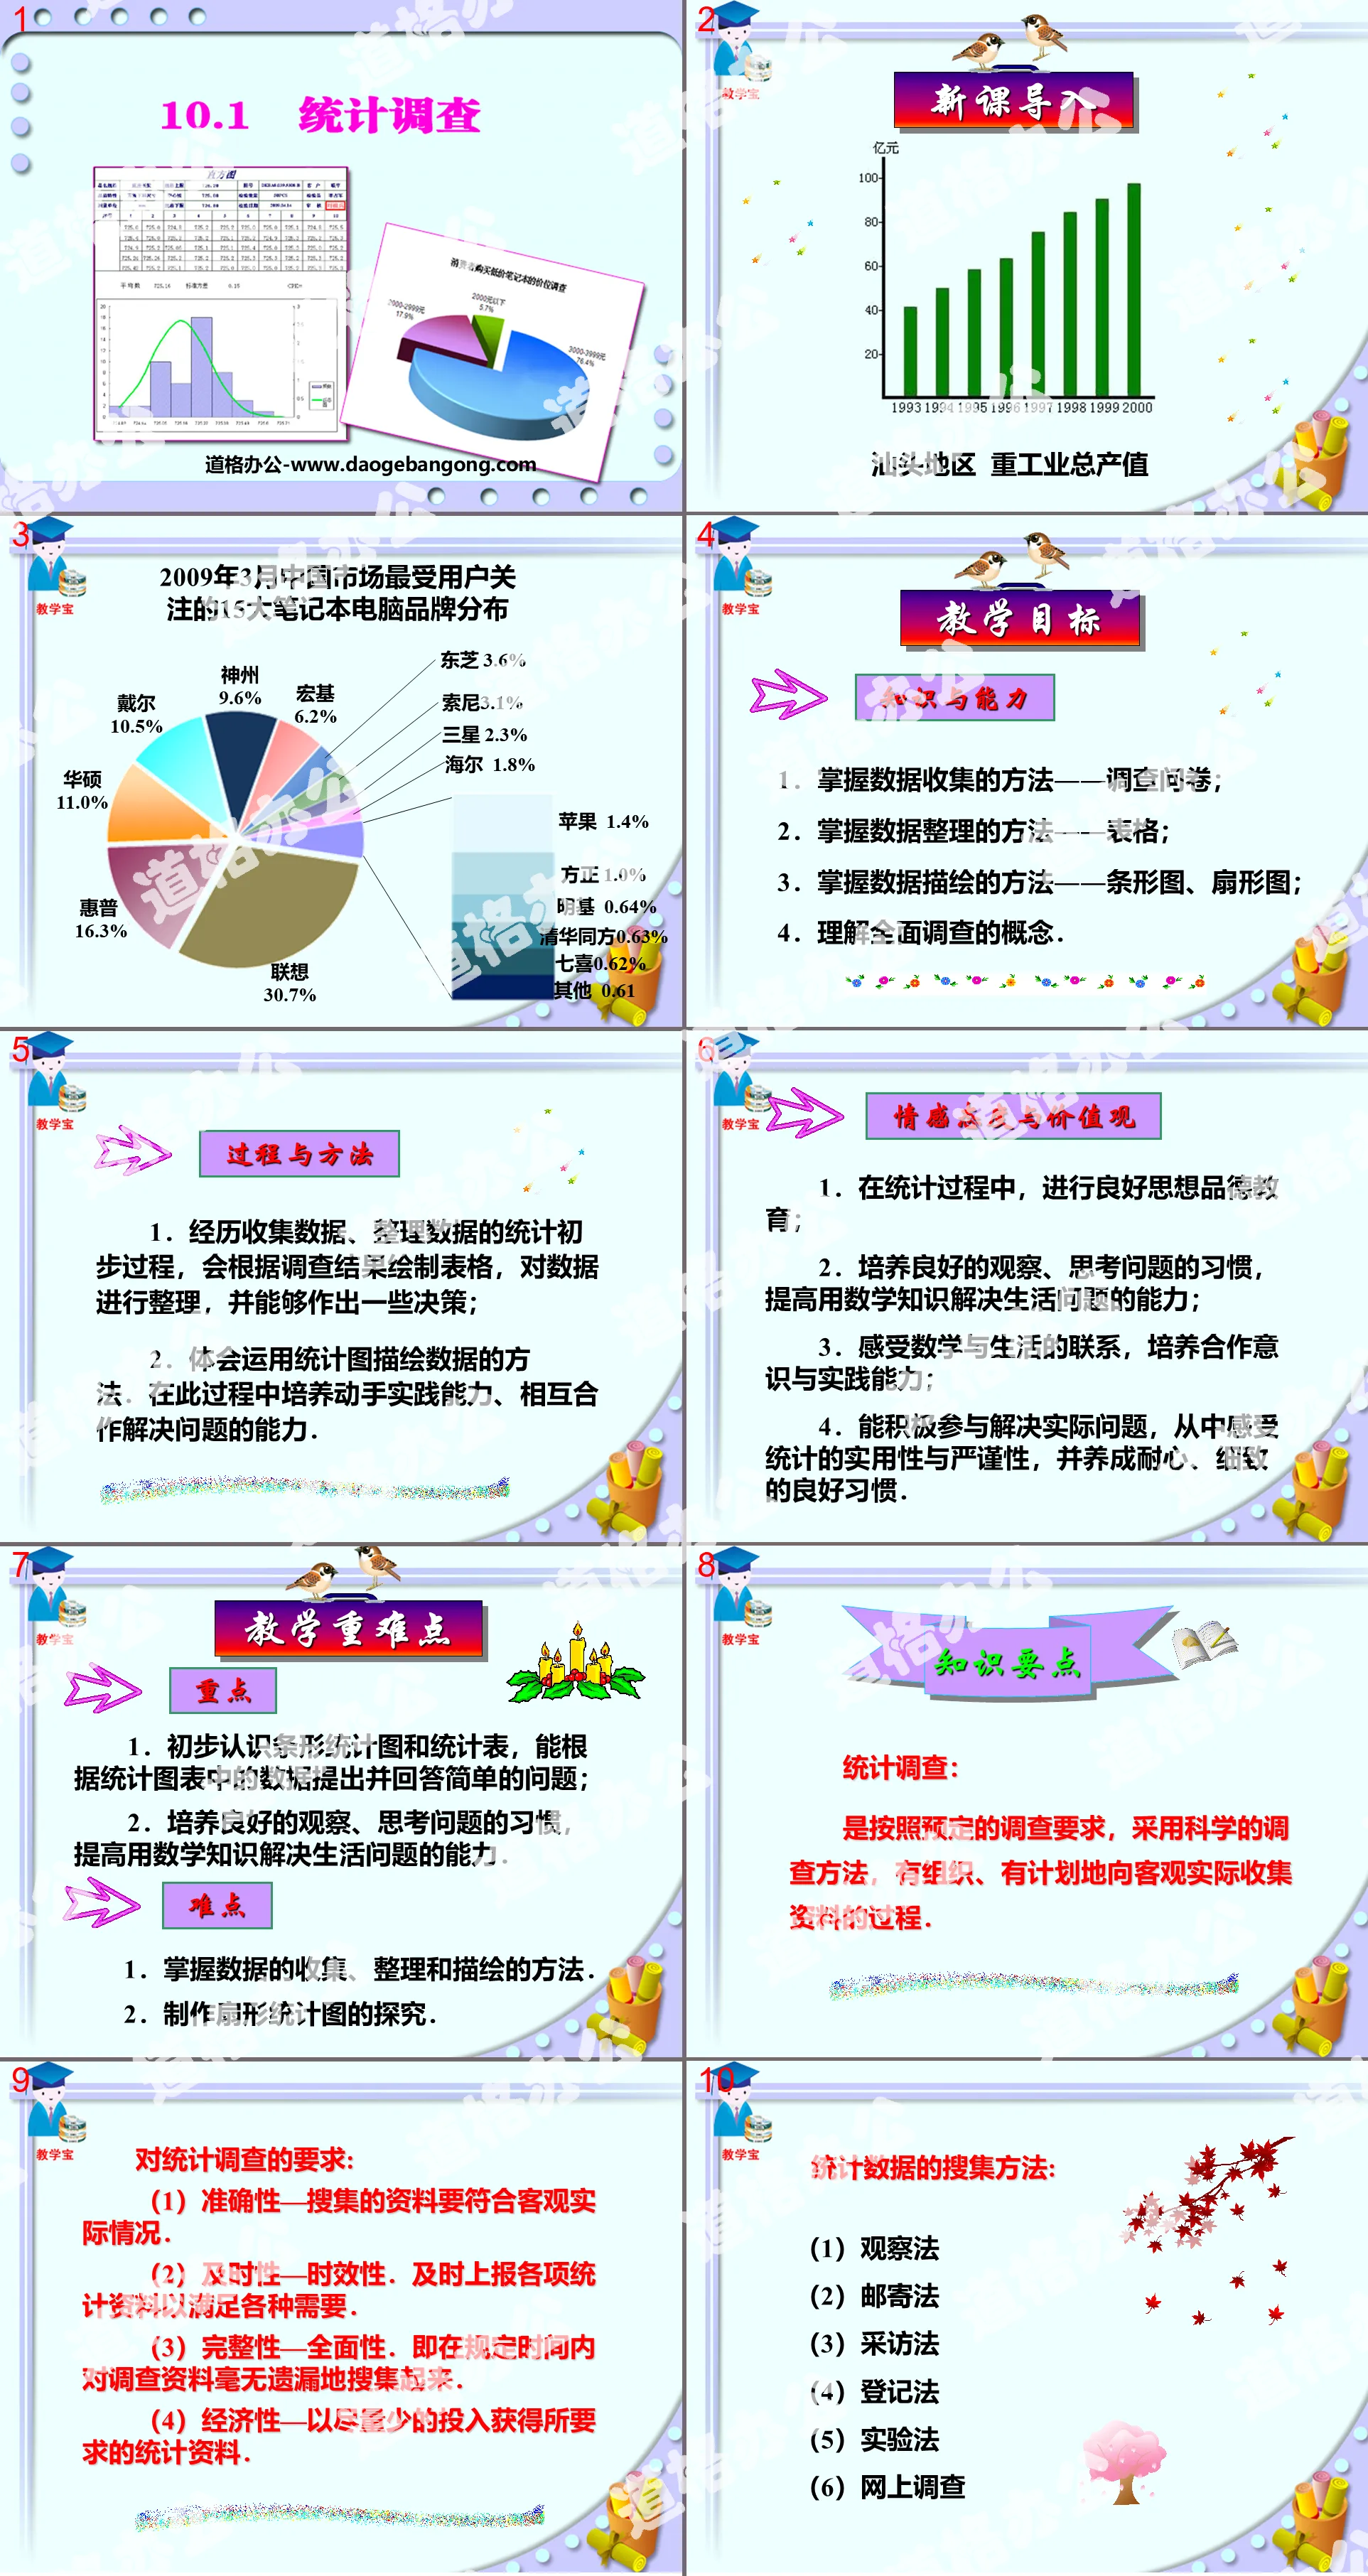
teaching objectives
knowledge and abilities
1. Master the method of data collection - questionnaire;
2. Master the methods of data collation - tables;
3. Master the methods of data depiction - bar charts and fan charts;
4. Understand the concept of comprehensive investigation.
Process and Method
1. After going through the preliminary statistical process of collecting and organizing data, you can draw tables based on the survey results, organize the data, and be able to make some decisions;
2. Understand the method of using statistical charts to depict data. In this process, hands-on practical skills and the ability to cooperate with each other to solve problems are cultivated.
Emotional attitudes and values
1. In the statistical process, good ideological and moral education is carried out;
2. Develop good habits of observation and thinking, and improve the ability to use mathematical knowledge to solve life problems;
3. Feel the connection between mathematics and life, and cultivate cooperation awareness and practical ability;
4. Be able to actively participate in solving practical problems, experience the practicality and rigor of statistics, and develop good habits of patience and meticulousness.
Knowledge points
Statistical survey:
It is a process of collecting objective and actual data in an organized and planned manner according to predetermined investigation requirements and using scientific investigation methods.
Requirements for statistical surveys:
(1) Accuracy - the information collected must conform to the objective actual situation.
(2) Timeliness-timeliness. Report various statistical data in a timely manner to meet various needs.
(3) Completeness-comprehensiveness. That is, the investigation information is collected without missing any information within the specified time.
(4) Economy - Obtain the required statistical data with as little investment as possible.
How to draw the corresponding sector diagram based on percentage or central angle?
1. First calculate the percentage of each part of the data collected in the total.
2. Multiply 360° by the percentage to find the central angle of each part, and then complete it with the help of a protractor.
3. Draw the proportions of each part in a circle and distinguish them by color.
4. Indicate the name and percentage of each part.
Questionnaire: Collect data.
Tables: organize data.
Statistical chart: an intuitive and vivid description.
Comprehensive investigation is an investigation method that conducts investigation and registration of all the overall units that constitute the investigation object group one by one.
For example, to understand the production of steel, a statistical survey of the steel production of all steel plants in the country would be a comprehensive survey. The fifth census conducted in our country in 2000 was also a comprehensive survey.
sample survey
Sampling survey: Only a part of the objects are selected for investigation, and then the situation of all objects is inferred based on the survey data.
Overall: In practical problems, the totality of a certain characteristic index of the object under study is called the overall;
Individual: Each object of investigation that makes up the population is called an individual;
Sample: An individual randomly selected from the population;
Sample: A sample is composed of several individuals randomly selected from the population;
Sample size: the number of individuals in the sample;
Sample value: the value of each individual in the population.
Class summary
General steps for statistics:
1. Collect data 3. Describe data
2. Organize data 4. analyze data
The respective characteristics of bar charts and sector charts:
Bar chart:
① Ability to display specific data in each group;
②It is convenient to compare the differences between data.
Sector chart:
Easily display the size of each set of data relative to the population.
Keywords: data collection, arrangement and description teaching courseware, statistical investigation teaching courseware, New People's Education Edition seventh grade mathematics volume 2 PPT courseware, seventh grade mathematics slide courseware download, data collection, arrangement and description PPT courseware download, statistical investigation PPT Courseware download, .ppt format
For more information about the PPT courseware "Data Collection, Arrangement and Description of Statistical Investigation", please click on the "Data Collection, Arrangement and Description of Statistical Investigation ppt" tab.
"Statistical Survey" data collection, organization and description PPT courseware 8:
"Statistical Survey" Data Collection, Arrangement and Description PPT Courseware 8 Learning Objectives 1. Be able to design appropriate survey plans according to specific situations and further understand the importance of the representativeness and breadth of samples in sampling surveys; 2. Understand the three types of statistical graphs Their respective characteristics can be adjusted according to...
"Statistical Survey" data collection, organization and description PPT courseware 6:
"Statistical Survey" Data Collection, Arrangement and Description PPT Courseware 6 Concept Formation 1. Sampling survey: collecting data by surveying some objects and estimating the whole situation based on the parts is called sampling survey. 2. Overall: all the objects to be investigated It's called the overall...
"Statistical Survey" data collection, organization and description PPT courseware 5:
"Statistical Survey" Data Collection, Arrangement and Description PPT Courseware 5 Step 1: Collect Data Questionnaire Year Month Among the following five types of TV programs, which one is your favorite ( ). (Single choice) A. News b. Sports c. animation d. entertainment e. After completing the opera,...
File Info
Update Time: 2024-10-02
This template belongs to Mathematics courseware People's Education Press Seventh Grade Mathematics Volume 2 industry PPT template
"Statistical Survey" data collection, arrangement and description PPT courseware 7 Simple campus recruitment activity planning plan summary enterprise and institution recruitment publicity lecture PPT template is a general PPT template for business post competition provided by the manuscript PPT, simple campus recruitment activity planning plan summary enterprise and institution recruitment promotion Lecture PPT template, you can edit and modify the text and pictures in the source file by downloading the source file. If you want more exquisite business PPT templates, you can come to grid resource. Doug resource PPT, massive PPT template slide material download, we only make high-quality PPT templates!
Tips: If you open the template and feel that it is not suitable for all your needs, you can search for related content "Statistical Survey" data collection, arrangement and description PPT courseware 7 is enough.
How to use the Windows system template
Directly decompress the file and use it with office or wps
How to use the Mac system template
Directly decompress the file and use it Office or wps can be used
Related reading
For more detailed PPT-related tutorials and font tutorials, you can view: Click to see
How to create a high-quality technological sense PPT? 4 ways to share the bottom of the box
Notice
Do not download in WeChat, Zhihu, QQ, built-in browsers, please use mobile browsers to download! If you are a mobile phone user, please download it on your computer!
1. The manuscript PPT is only for study and reference, please delete it 24 hours after downloading.
2. If the resource involves your legitimate rights and interests, delete it immediately.
3. Contact information: service@daogebangong.com
"Statistical Survey" data collection, arrangement and description PPT courseware 7, due to usage restrictions, it is only for personal study and reference use. For commercial use, please go to the relevant official website for authorization.
(Personal non-commercial use refers to the use of this font to complete the display of personal works, including but not limited to the design of personal papers, resumes, etc.)
Preview
Related Search:
"Statistical Survey" data collection, arrangement and description PPT courseware 7
2024-10-02
Copyright statement: This material is compiled and released by the user of Daoge Resources. The copyright belongs to the author. For commercial use, please contact the copyright owner. If there is any infringement, please contact the webmaster to remove the resource.
Download Points: 0.00
Free Download
Upgrade VIP
Favorite
Views: 1156 / Downloads: 985


