Western Normal University Edition First Grade Mathematics Volume 1
Beijing Normal University Edition Seventh Grade Mathematics Volume 1
People's Education Press First Grade Mathematics Volume 1
People's Education Press Third Grade Mathematics Volume 1
People's Education Press Second Grade Mathematics Volume 1
Beijing Normal University Edition Seventh Grade Mathematics Volume 2
Beijing Normal University Edition Fifth Grade Mathematics Volume 1
Qingdao Edition Seventh Grade Mathematics Volume 1
Hebei Education Edition Third Grade Mathematics Volume 1
Beijing Normal University Edition Eighth Grade Mathematics Volume 1
Hebei Education Edition Seventh Grade Mathematics Volume 2
People's Education High School Mathematics Edition B Compulsory Course 2
Beijing Normal University Edition Fifth Grade Mathematics Volume 2
Hebei Education Edition Fourth Grade Mathematics Volume 2
Qingdao Edition Seventh Grade Mathematics Volume 2
Jiangsu Education Edition Fourth Grade Mathematics Volume 1
| Category | Format | Size |
|---|---|---|
| People's Education Press Seventh Grade Mathematics Volume 2 | pptx | 6 MB |

"Talk about Water Saving from Data" PPT courseware on data collection, organization and description
2024-10-05
Copyright statement: This material is compiled and released by the user of Daoge Resources. The copyright belongs to the author. For commercial use, please contact the copyright owner. If there is any infringement, please contact the webmaster to remove the resource.
Download Points: 0.00
Free Download
Upgrade VIP
Favorite
Views: 2628 / Downloads: 937
Description
"Talk about Water Saving from Data" PPT courseware on data collection, organization and description
Learning objectives: Comprehensively apply the knowledge learned to solve problems and further consolidate the basic steps and methods of data management.
Learning focus: Comprehensive application of learned knowledge to solve problems.
Read the information in the textbook appendix, work in groups, and follow the steps below to answer the three questions on page 154.
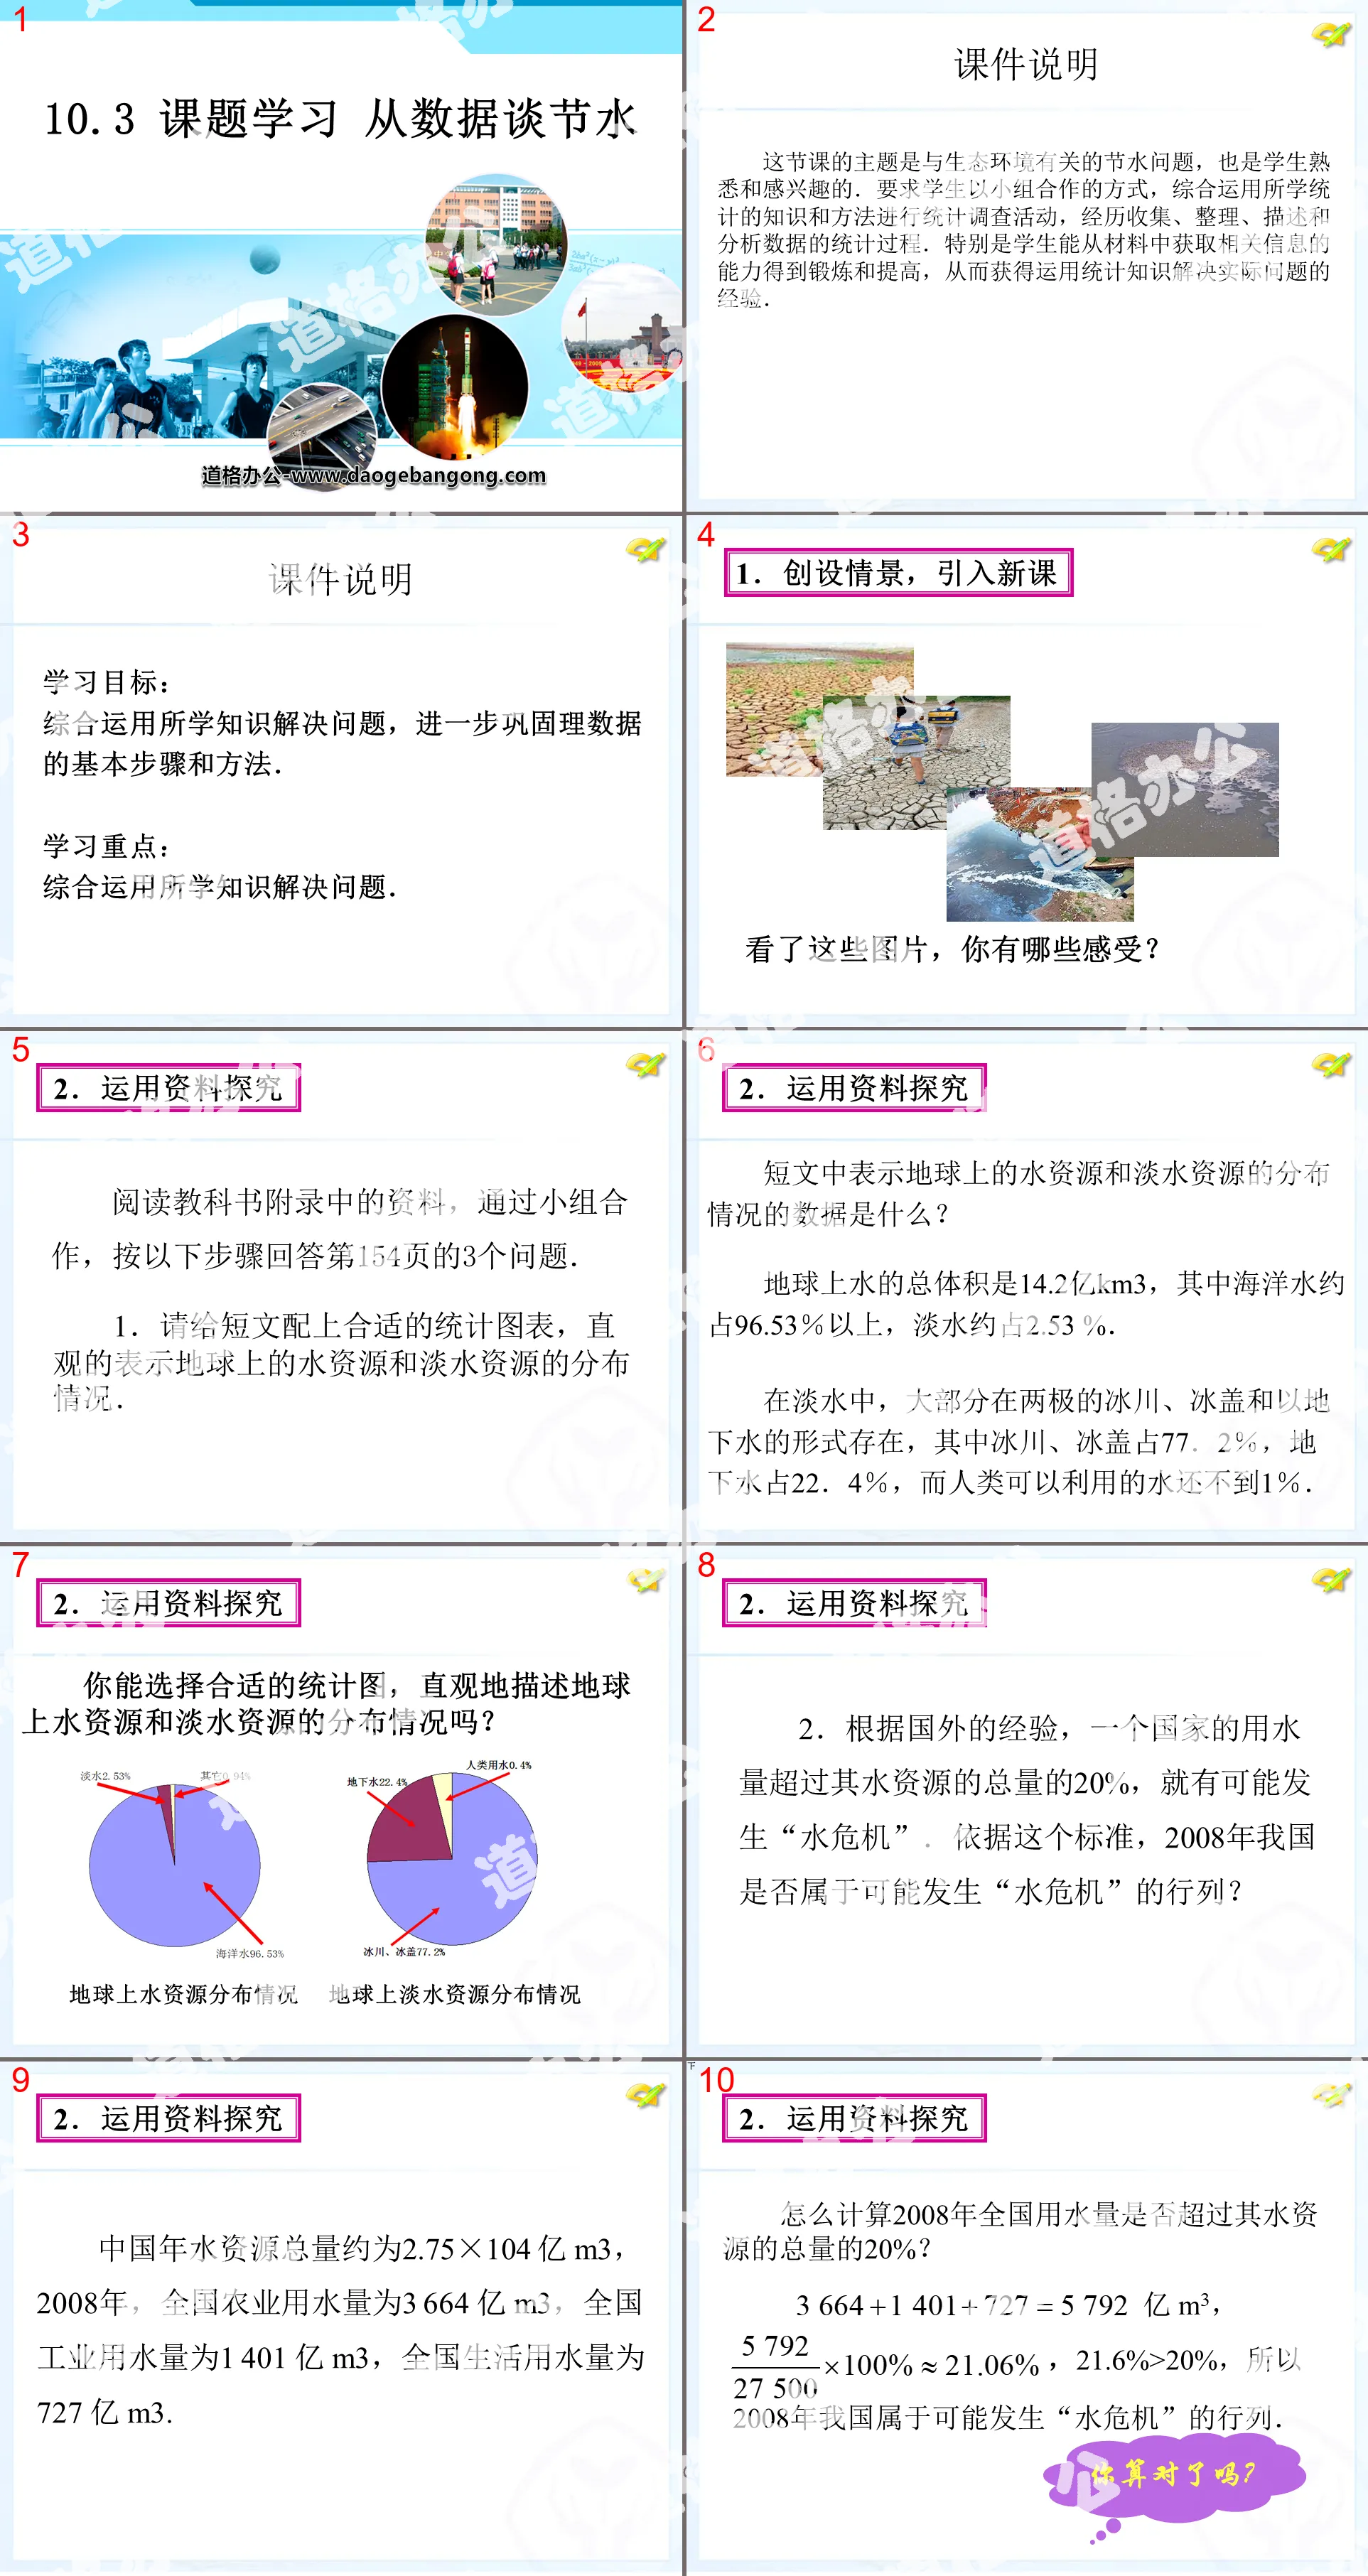
1. Please accompany the short article with appropriate statistical charts to visually represent the distribution of water resources and freshwater resources on the earth.
What data in the passage represent the distribution of water and freshwater resources on Earth?
The total volume of water on the earth is 1.42 billion km3, of which ocean water accounts for more than 96.53% and fresh water accounts for about 2.53%.
Among fresh water, most exist in the form of glaciers, ice caps and groundwater at the poles. Glaciers and ice caps account for 77.2%, and groundwater accounts for 22.4%. However, the water that humans can use is less than 1%.
2. According to foreign experience, if a country's water consumption exceeds 20% of its total water resources, a "water crisis" may occur. Based on this standard, is my country likely to be in a "water crisis" category in 2008?
China's annual total water resources is approximately 275×10.4 billion m3. In 2008, the national agricultural water consumption was 366.4 billion m3, the national industrial water consumption was 140.1 billion m3, and the national domestic water consumption was 72.7 billion m3.
How to calculate whether the country's water consumption exceeded 20% of its total water resources in 2008?
(1) If you use a straight line close to as many scattered points as possible to represent this development trend of water consumption, can you try to draw this straight line on the graph?
(2) Based on the straight line, estimate the national domestic water consumption in 2009 and 2010, and compare it with the actual water consumption in these two years. Is your estimate accurate? Why?
It was 75 billion m3 in 2009 and 77 billion m3 in 2010. It is just an estimate based on a straight line and may not be accurate.
Summary
Through studying this lesson, do you have any new understanding of current water resources and the value brought by saving water resources?
Homework
Please work as a group to conduct a school-wide statistical survey with the theme of "Monthly domestic water consumption per capita in a household" and complete a survey report.
1. Give the purpose of the investigation, the objects of the investigation, the questionnaire, and the investigation methods.
2. Use tables to organize the collected data, use histograms to describe the data, and analyze the information contained in the data.
3. Calculate or estimate the average monthly domestic water consumption per capita of the entire school's families, and compare it with the national average monthly domestic water consumption per capita.
4. Combined with my country's water shortage situation, let's talk about the significance of water conservation and how to save water starting from me.
Keywords: Data collection, organization and description teaching courseware, Talking about water saving teaching courseware from data, New People's Education Edition seventh grade mathematics second volume PPT courseware, seventh grade mathematics slide courseware download, data collection, organization and description PPT courseware download, Download PPT courseware on water conservation from data, in .ppt format
For more information about the PPT courseware "Collection, Organization and Description of Data to Talk about Water Saving from Data", please click the "Collection, Organization and Description of Data ppt to Talk about Water Saving from Data" ppt tag.
"Talk about Water Saving from Data" Data collection, organization and description PPT courseware 3:
"Talk about Water Saving from Data" Data Collection, Arrangement and Description PPT Courseware 3 Question 1: What is the distribution of water resources and freshwater resources on the earth? Information: Water on the earth includes three categories: atmospheric water, surface water, and underground water. Surface water can be divided into ocean water and land water. Land...
"Talk about Water Saving from Data" Data collection, organization and description PPT courseware 2:
"Talk about Water Saving from Data" PPT courseware for data collection, organization and description 2. Think about what you think after reading the above picture? Saving water starts with me. Explore and read the information in the appendix of the textbook, collect data from it, and draw statistics Picture and answer the following questions: (..
File Info
Update Time: 2024-10-05
This template belongs to Mathematics courseware People's Education Press Seventh Grade Mathematics Volume 2 industry PPT template
"Talk about Water Saving from Data" PPT courseware on data collection, organization and description Simple campus recruitment activity planning plan summary enterprise and institution recruitment publicity lecture PPT template is a general PPT template for business post competition provided by the manuscript PPT, simple campus recruitment activity planning plan summary enterprise and institution recruitment promotion Lecture PPT template, you can edit and modify the text and pictures in the source file by downloading the source file. If you want more exquisite business PPT templates, you can come to grid resource. Doug resource PPT, massive PPT template slide material download, we only make high-quality PPT templates!
Tips: If you open the template and feel that it is not suitable for all your needs, you can search for related content "Talk about Water Saving from Data" PPT courseware on data collection, organization and description is enough.
How to use the Windows system template
Directly decompress the file and use it with office or wps
How to use the Mac system template
Directly decompress the file and use it Office or wps can be used
Related reading
For more detailed PPT-related tutorials and font tutorials, you can view: Click to see
How to create a high-quality technological sense PPT? 4 ways to share the bottom of the box
Notice
Do not download in WeChat, Zhihu, QQ, built-in browsers, please use mobile browsers to download! If you are a mobile phone user, please download it on your computer!
1. The manuscript PPT is only for study and reference, please delete it 24 hours after downloading.
2. If the resource involves your legitimate rights and interests, delete it immediately.
3. Contact information: service@daogebangong.com
"Talk about Water Saving from Data" PPT courseware on data collection, organization and description, due to usage restrictions, it is only for personal study and reference use. For commercial use, please go to the relevant official website for authorization.
(Personal non-commercial use refers to the use of this font to complete the display of personal works, including but not limited to the design of personal papers, resumes, etc.)
Preview
Related Search:
"Talk about Water Saving from Data" PPT courseware on data collection, organization and description
2024-10-05
Copyright statement: This material is compiled and released by the user of Daoge Resources. The copyright belongs to the author. For commercial use, please contact the copyright owner. If there is any infringement, please contact the webmaster to remove the resource.
Download Points: 0.00
Free Download
Upgrade VIP
Favorite
Views: 2628 / Downloads: 937


