
| Category | Format | Size |
|---|---|---|
| People's Education Press Sixth Grade Mathematics Volume 1 | pptx | 6 MB |

"Statistical Chart" sector statistical chart PPT courseware
Description
"Statistical Chart" sector statistical chart PPT courseware
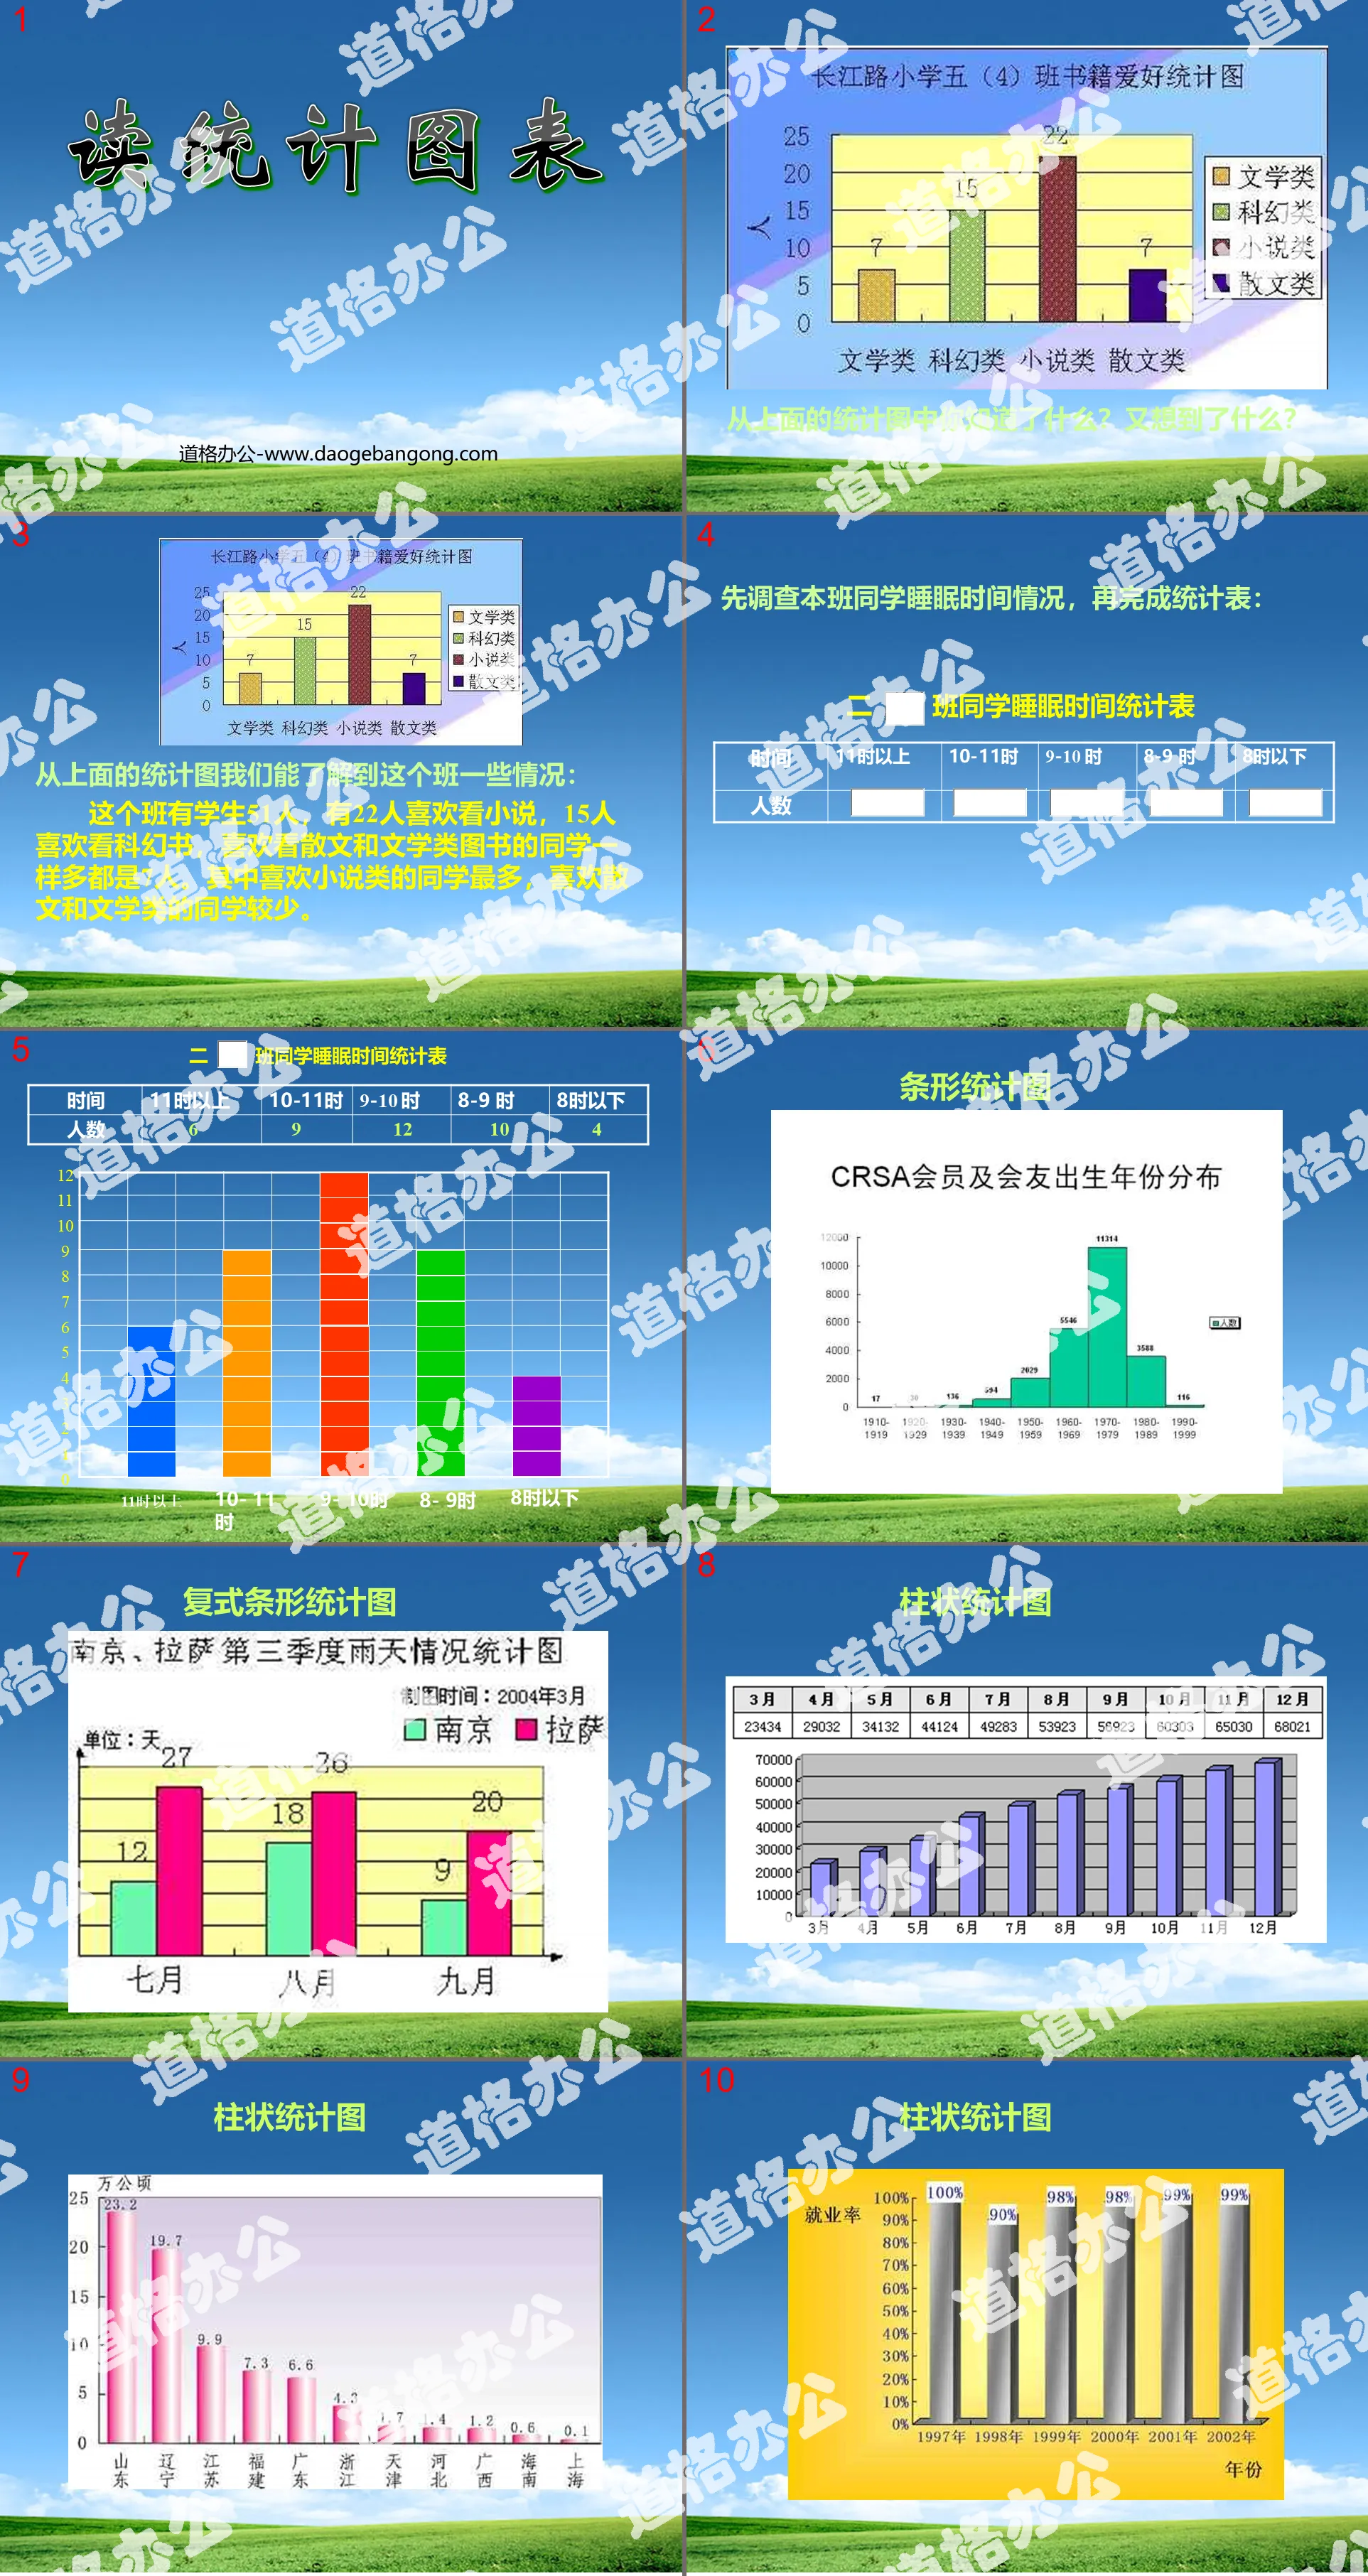
From the statistical chart above, we can learn something about this class:
There are 51 students in this class, 22 of whom like reading novels, 15 who like to read science fiction books, and the same number of 7 students who like to read prose and literature books. Among them, most students like novels, while fewer students like prose and literature.
This courseware provides a comprehensive introduction to fan statistical charts through mini games and exercises, which improves students' interest in learning and helps students better understand and remember statistical knowledge points. It is a good classroom teaching courseware.
Keywords: Statistics courseware, sector chart courseware, New People's Education Edition sixth grade mathematics PPT courseware, sixth grade mathematics slide courseware download, statistics PPT courseware download, sector chart PPT courseware download, .ppt format
For more information about the "Sector Chart Statistics" PPT courseware, please click the "Sector Chart ppt Statistics ppt" tab.
"Reading Statistical Charts" PPT:
"Reading Statistical Charts" PPT Part One: Analysis of Examples Example 4: Reading Statistical Charts (1) Information learned: (1) my country's fiscal revenue from 2003, 2005, 2007, 2010 and 2011 . (2) It exceeded 2 trillion yuan in 2003. (3)..
"Complex Line Statistical Chart" PPT:
"Compound Broken Line Statistical Chart" PPT Part One: Analysis of Example Questions Example 3: From the founding of the People's Republic of China to the present, a total of six censuses have been conducted. The following is a statistical table of the results of the six censuses. (The data in the table does not include Hong Kong, Macau and Taiwan) ..
"Understanding Special Single Line Statistical Charts" PPT:
"Understanding Special Single Line Statistical Charts" PPT Part One Content: Analysis of Example Questions Example 2: The following is a flood situation announcement and a statistical chart of water level changes of a certain river at 2 p.m. every day from August 1 to August 6. (1) What do the two horizontal dotted lines in the picture represent? Answer: Purple...
File Info
Update Time: 2024-07-10
This template belongs to Mathematics courseware People's Education Press Sixth Grade Mathematics Volume 1 industry PPT template
"Statistical Chart" sector statistical chart PPT courseware Simple campus recruitment activity planning plan summary enterprise and institution recruitment publicity lecture PPT template is a general PPT template for business post competition provided by the manuscript PPT, simple campus recruitment activity planning plan summary enterprise and institution recruitment promotion Lecture PPT template, you can edit and modify the text and pictures in the source file by downloading the source file. If you want more exquisite business PPT templates, you can come to grid resource. Doug resource PPT, massive PPT template slide material download, we only make high-quality PPT templates!
Tips: If you open the template and feel that it is not suitable for all your needs, you can search for related content "Statistical Chart" sector statistical chart PPT courseware is enough.
How to use the Windows system template
Directly decompress the file and use it with office or wps
How to use the Mac system template
Directly decompress the file and use it Office or wps can be used
Related reading
For more detailed PPT-related tutorials and font tutorials, you can view: Click to see
How to create a high-quality technological sense PPT? 4 ways to share the bottom of the box
Notice
Do not download in WeChat, Zhihu, QQ, built-in browsers, please use mobile browsers to download! If you are a mobile phone user, please download it on your computer!
1. The manuscript PPT is only for study and reference, please delete it 24 hours after downloading.
2. If the resource involves your legitimate rights and interests, delete it immediately.
3. Contact information: service@daogebangong.com
"Statistical Chart" sector statistical chart PPT courseware, due to usage restrictions, it is only for personal study and reference use. For commercial use, please go to the relevant official website for authorization.
(Personal non-commercial use refers to the use of this font to complete the display of personal works, including but not limited to the design of personal papers, resumes, etc.)
Preview
Related Search: