Western Normal University Edition First Grade Mathematics Volume 1
Beijing Normal University Edition Seventh Grade Mathematics Volume 1
People's Education Press First Grade Mathematics Volume 1
People's Education Press Second Grade Mathematics Volume 1
Beijing Normal University Edition Seventh Grade Mathematics Volume 2
People's Education Press Third Grade Mathematics Volume 1
Beijing Normal University Edition Eighth Grade Mathematics Volume 1
Qingdao Edition Seventh Grade Mathematics Volume 1
Beijing Normal University Edition Fifth Grade Mathematics Volume 1
Hebei Education Edition Third Grade Mathematics Volume 1
Hebei Education Edition Seventh Grade Mathematics Volume 2
People's Education Press First Grade Mathematics Volume 2
People's Education High School Mathematics Edition B Compulsory Course 2
Qingdao Edition Seventh Grade Mathematics Volume 2
Beijing Normal University Edition Fifth Grade Mathematics Volume 2
Hebei Education Edition Fourth Grade Mathematics Volume 2

| Category | Format | Size |
|---|---|---|
| Beijing Normal University Edition Eighth Grade Mathematics Volume 1 | pptx | 6 MB |

"Median and Mode" Data Analysis PPT Download
2024-11-21
Copyright statement: This material is compiled and released by the user of Daoge Resources. The copyright belongs to the author. For commercial use, please contact the copyright owner. If there is any infringement, please contact the webmaster to remove the resource.
Download Points: 0.00
Free Download
Upgrade VIP
Favorite
Views: 3562 / Downloads: 138
Description
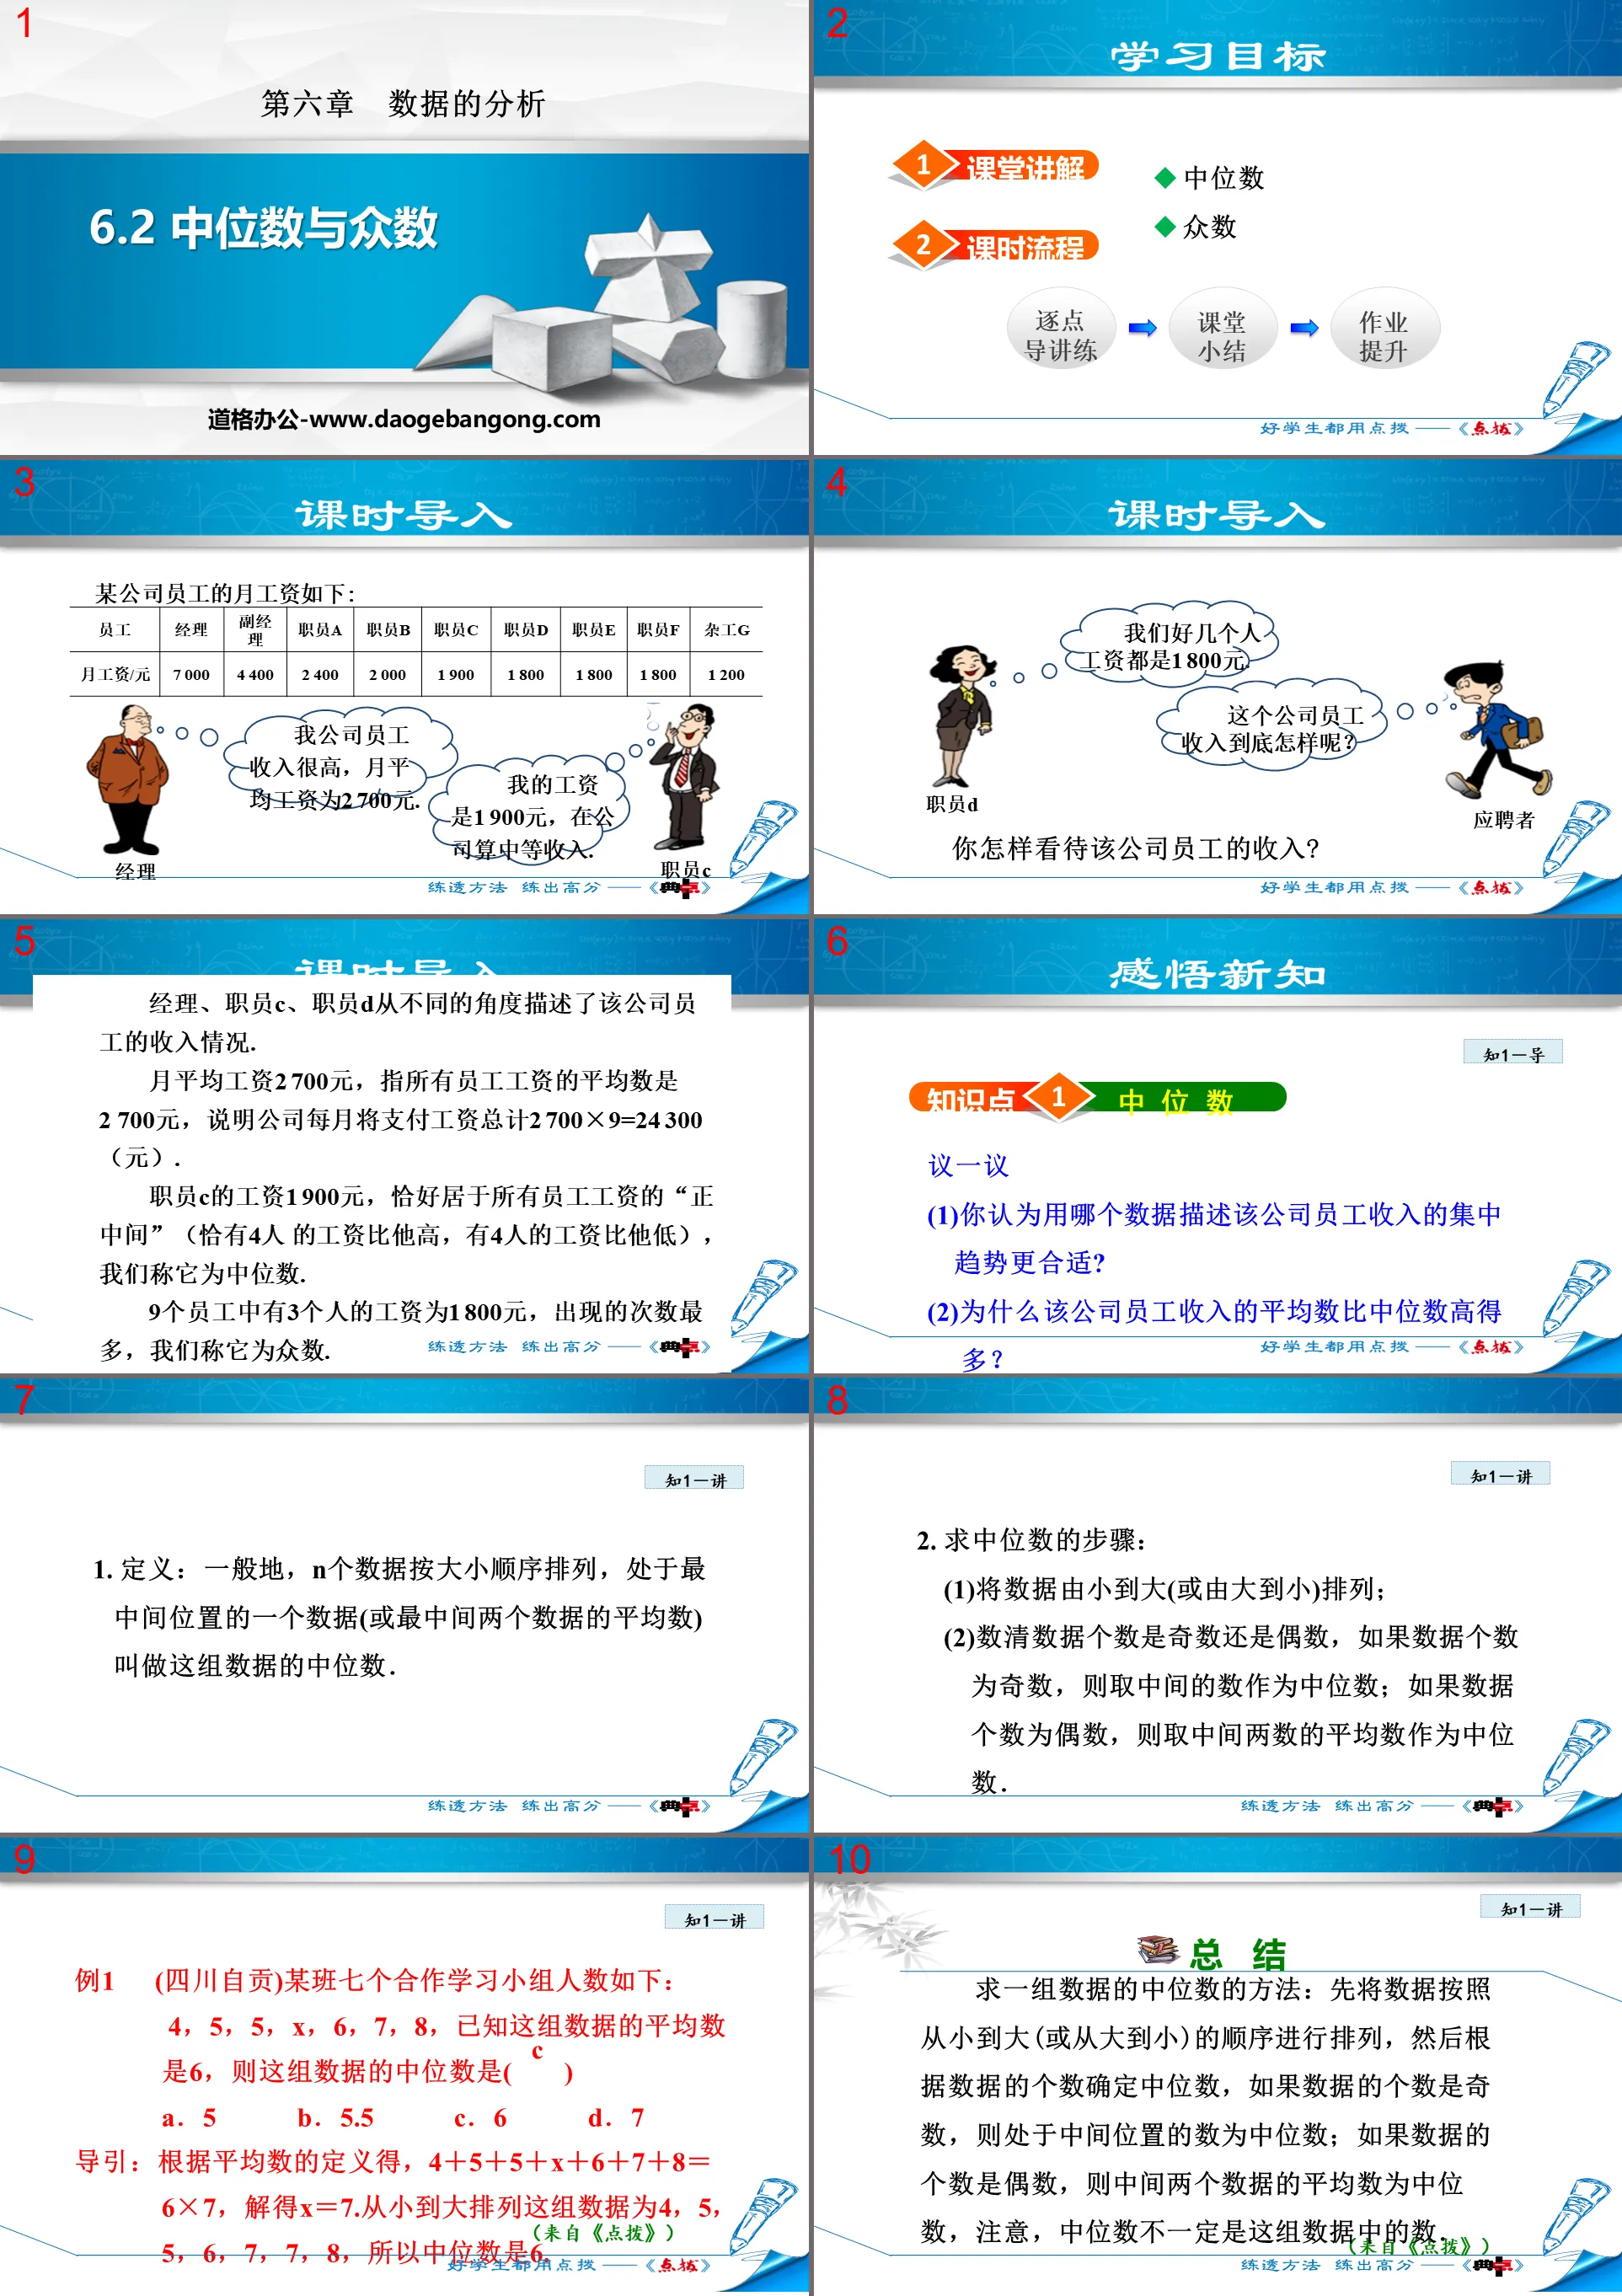
"Median and Mode" data analysis PPT download, 20 pages in total.
Part One: Learning Objectives
median
mode
Median and Mode PPT, Part 2: Understanding New Knowledge
Knowledge point median
1. Definition: Generally, n data are arranged in order of size, and the data in the middle (or the average of the two middle data) is called the median of this set of data.
2. Steps to find the median:
(1) Arrange the data from small to large (or from large to small);
(2) Count whether the number of data is odd or even. If the number of data is odd, take the middle number as the median; if the number of data is even, take the average of the two middle numbers as the median.
Summarize
How to find the median of a set of data: first arrange the data in order from small to large (or from large to small), and then determine the median according to the number of data. If the number of data is an odd number, then The number in the middle is the median; if the number of data is an even number, the average of the two middle data is the median. Note that the median is not necessarily the number in this set of data.
Knowledge point mode
1. Definition: The data that appears most frequently in a set of data is called the mode of this set of data.
2. Key points analysis:
(1) The mode of a set of data must appear in this set of data;
(2) A set of data may have more than one mode;
(3) A set of data may not have a mode; because the data may appear with the same frequency;
(4) The mode can represent the overall situation of this set of data in a sense.
Summarize
Methods to find the mode of a set of data: To find the mode of a set of data, you can use the observation method; when it is difficult to observe, you can use the form of a list to calculate all the times that each data appears, and you can get the mode.
Median and Mode PPT, Part 3: Class Summary
The relationship between mean, median and mode:
Connection: The average, median, and mode are all quantities that describe the central tendency of a set of data, and the average is the most important quantity.
Difference: ① The size of the average is related to each data in a set of data, and changes in any data will cause changes in the average; ② The median is related to the order of the data, and changes in some data are in the middle The number of digits has no effect. When individual data in a set of data changes greatly, the median can be used to describe its central tendency; ③ The mode mainly studies the frequency of occurrence of each data, and its size is only related to some of the data in this set of data. It is related to data. When a set of data has a lot of data repeated many times, we often care about the mode.
Keywords: Beijing Normal University edition eighth grade mathematics PPT courseware free download, median and mode PPT download, data analysis PPT download, .PPT format;
For more information about the "Data Analysis Median and Mode" PPT courseware, please click the Data Analysis PPT Median and Mode PPT tab.
"Median and Mode" data analysis PPT teaching courseware:
"Median and Mode" data analysis PPT teaching courseware, 14 pages in total. Part One: Knowledge Points Basic Knowledge Point 1 Median 1. A set of 6 numbers: 15, 16, 18, 20, 22, 22, then the median of this set of data is (C) A.22 B. 20 C.19 D.18 2.1..
"Median and Mode" data analysis PPT:
"Median and Mode" data analysis PPT, 27 pages in total. Part One: Learning Objectives 1. Master the meaning of median and mode. (Key points) 2. Be able to make preliminary judgments on the data based on the differences between the mean, median and mode. (difficult)...
"Median and Mode" Data Analysis PPT Courseware 3:
"Median and Mode" Data Analysis PPT Courseware 2 Review Introduction What is the median? 1. Median: Arrange a set of data in order from small to large (or large to small), then the number in the middle is the median of this set of data; if the data...
File Info
Update Time: 2024-11-21
This template belongs to Mathematics courseware Beijing Normal University Edition Eighth Grade Mathematics Volume 1 industry PPT template
"Median and Mode" Data Analysis PPT Download Simple campus recruitment activity planning plan summary enterprise and institution recruitment publicity lecture PPT template is a general PPT template for business post competition provided by the manuscript PPT, simple campus recruitment activity planning plan summary enterprise and institution recruitment promotion Lecture PPT template, you can edit and modify the text and pictures in the source file by downloading the source file. If you want more exquisite business PPT templates, you can come to grid resource. Doug resource PPT, massive PPT template slide material download, we only make high-quality PPT templates!
Tips: If you open the template and feel that it is not suitable for all your needs, you can search for related content "Median and Mode" Data Analysis PPT Download is enough.
How to use the Windows system template
Directly decompress the file and use it with office or wps
How to use the Mac system template
Directly decompress the file and use it Office or wps can be used
Related reading
For more detailed PPT-related tutorials and font tutorials, you can view: Click to see
How to create a high-quality technological sense PPT? 4 ways to share the bottom of the box
Notice
Do not download in WeChat, Zhihu, QQ, built-in browsers, please use mobile browsers to download! If you are a mobile phone user, please download it on your computer!
1. The manuscript PPT is only for study and reference, please delete it 24 hours after downloading.
2. If the resource involves your legitimate rights and interests, delete it immediately.
3. Contact information: service@daogebangong.com
"Median and Mode" Data Analysis PPT Download, due to usage restrictions, it is only for personal study and reference use. For commercial use, please go to the relevant official website for authorization.
(Personal non-commercial use refers to the use of this font to complete the display of personal works, including but not limited to the design of personal papers, resumes, etc.)
Preview
Related Search:
"Median and Mode" Data Analysis PPT Download
2024-11-21
Copyright statement: This material is compiled and released by the user of Daoge Resources. The copyright belongs to the author. For commercial use, please contact the copyright owner. If there is any infringement, please contact the webmaster to remove the resource.
Download Points: 0.00
Free Download
Upgrade VIP
Favorite
Views: 3562 / Downloads: 138


