| Category | Format | Size |
|---|---|---|
| Beijing Normal University Edition Seventh Grade Mathematics Volume 2 | pptx | 6 MB |

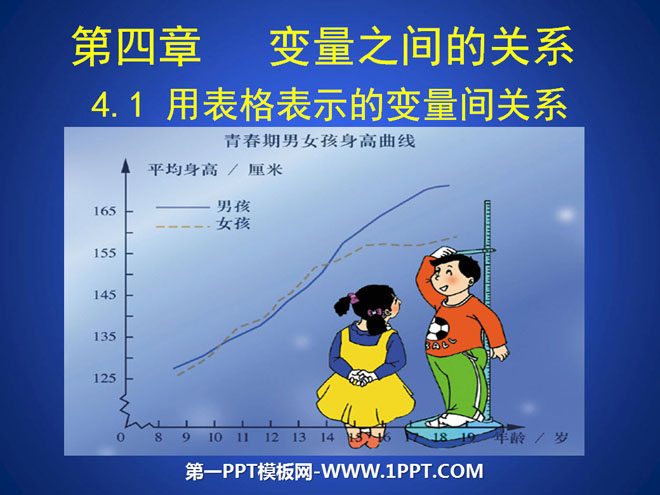
"Relationships between variables represented by tables" PPT courseware on the relationship between variables
Description
"Relationships between variables represented by tables" PPT courseware on the relationship between variables
learning target:
1. Experience the process of exploring the relationship between two variables in a specific situation, gain experience in exploring the relationship between variables, and further develop symbolic awareness.
2. Understand what variables, independent variables, and dependent variables are in specific situations, and be able to give examples that reflect the relationship between variables.
3. Be able to obtain information about the relationship between variables from tables, be able to use tables to express the relationship between two variables, and try to make preliminary predictions on the change trend based on the data in the table.
1. Feel the changes through data
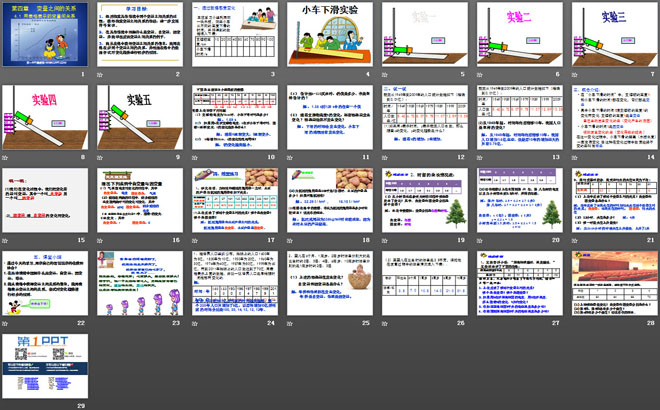
Wang Bo's study group used the same wooden board to measure the time it took for the car to slide from different heights, and filled the obtained data into the following table:
Answer the following questions based on the table above:
(1) When the height of the support is 70cm, what is the sliding time of the car? Solution: 1.59 s
(2) If h represents the height of the support and t represents the sliding time of the car, as h gradually increases, what is the changing trend of t? Solution: As h gradually becomes larger, t gradually becomes smaller.
(3) Every time h increases by 10cm, does t change in the same way? Solution: The change of t is getting smaller and smaller.
2. Discussion
my country’s demographic data from 1949 to 2009 are as follows (accurate to 0.01 billion):
(1) If x represents time and y represents the total population of our country, then as x changes, what is the changing trend of y?
(2) How has my country’s population changed every 10 years since 1949?
3. Concept introduction:
In the "time for the car to slide down", the height h of the support and the time t for the car to slide down are both changing, and they are both variables.
The time t for the car to slide down changes with the change of the height h of the support. The height h of the support is the amount of active change of the independent variable (the reason for the change)
The time t for the car to slide down is the amount of passive change in the dependent variable (the result of the change)
Indicate the independent and dependent variables in the following examples
(1) In the process of temperature changing with altitude, the independent variable is: altitude and the dependent variable is: temperature
(2) During the burning process of the candle, the length of the remaining candle changes with the burning time, where the independent variable is: time and the dependent variable is: the length of the remaining candle
(3) In the circle circumference formula C=2πr, as r becomes larger, C also becomes larger, where the independent variable is: r and the dependent variable is: c
Practice in class
1. Research shows that when the application amounts of potassium and phosphate fertilizers are constant, the potato yield has the following relationship with the application amount of nitrogen fertilizer:
(1)The above table reflects the relationship between which two variables? Which is the independent variable? Which is the dependent variable?
(2) When the nitrogen fertilizer application rate is 101 kg/ha, what is the yield of potatoes? What if no nitrogen fertilizer is applied?
(3) Based on the data in the table, what do you think is the appropriate amount of nitrogen fertilizer? Tell us your reasons.
Class summary
Through today’s study, tell us what you gained and experienced in your own words?
1. Understand what variables, independent variables, dependent variables, and constants are in specific situations.
2. Be able to obtain information on the relationship between variables from tables, use tables to express the relationship between variables, and try to make preliminary predictions on changing trends.
Classroom testing
1. His father told Xiao Ming: "The further away from the earth, the lower the temperature." His father also showed the following table:
According to the above table, his father also asked Xiao Ming the following questions. Please answer them with Xiao Ming:
1. The above table reflects the relationship between which two variables? Which is the independent variable? Which is the dependent variable?
2. If h represents the height from the ground and t represents the temperature, how does t change as h changes?
3. Do you know what the temperature is at an altitude of 5 kilometers above the ground?
4. Can you predict what the temperature will be at an altitude of 6 kilometers above the ground?
Keywords: teaching courseware on the relationship between variables, teaching courseware on the relationship between variables expressed in tables, Beijing Normal University edition seventh grade mathematics volume 2 PPT courseware, seventh grade mathematics slide courseware download, relationship between variables PPT courseware download, PPT courseware download of the relationship between variables expressed in tables, .ppt format
For more information about the PPT courseware "Relationships between variables expressed in tables and relationships between variables", please click on the "Relationships between variables PPT expressed in tables" PPT tag.
"Relationships between variables expressed in tables" PPT download of the relationship between variables:
"Relationships between variables expressed in tables" PPT download of the relationship between variables Part 1: Learning objectives 1. Experience the process of exploring the relationship between two variables in a specific situation, gain experience in exploring the relationship between variables, and further develop symbols Sense. 2. In concrete..
"Relationships between variables expressed in tables" Relationship between variables PPT:
"Relationships between variables expressed in tables" PPT on the relationship between variables Part 1: Teaching objectives 1. Understand what variables, independent variables and dependent variables are in specific situations; 2. Be able to obtain the relationship between variables from tables Information, a table can be used to represent variables...
"Relationships between variables represented by tables" Relationship between variables PPT courseware 5:
"Relationships between variables represented by tables" PPT courseware 5 on the relationship between variables Knowledge base: This lesson is based on the students' learning of exploratory rules and statistical graphs in the seventh grade textbook, and uses tables to understand variables, Independent variables and dependent variables...
File Info
Update Time: 2024-07-06
This template belongs to Mathematics courseware Beijing Normal University Edition Seventh Grade Mathematics Volume 2 industry PPT template
"Relationships between variables represented by tables" PPT courseware on the relationship between variables Simple campus recruitment activity planning plan summary enterprise and institution recruitment publicity lecture PPT template is a general PPT template for business post competition provided by the manuscript PPT, simple campus recruitment activity planning plan summary enterprise and institution recruitment promotion Lecture PPT template, you can edit and modify the text and pictures in the source file by downloading the source file. If you want more exquisite business PPT templates, you can come to grid resource. Doug resource PPT, massive PPT template slide material download, we only make high-quality PPT templates!
Tips: If you open the template and feel that it is not suitable for all your needs, you can search for related content "Relationships between variables represented by tables" PPT courseware on the relationship between variables is enough.
How to use the Windows system template
Directly decompress the file and use it with office or wps
How to use the Mac system template
Directly decompress the file and use it Office or wps can be used
Related reading
For more detailed PPT-related tutorials and font tutorials, you can view: Click to see
How to create a high-quality technological sense PPT? 4 ways to share the bottom of the box
Notice
Do not download in WeChat, Zhihu, QQ, built-in browsers, please use mobile browsers to download! If you are a mobile phone user, please download it on your computer!
1. The manuscript PPT is only for study and reference, please delete it 24 hours after downloading.
2. If the resource involves your legitimate rights and interests, delete it immediately.
3. Contact information: service@daogebangong.com
"Relationships between variables represented by tables" PPT courseware on the relationship between variables, due to usage restrictions, it is only for personal study and reference use. For commercial use, please go to the relevant official website for authorization.
(Personal non-commercial use refers to the use of this font to complete the display of personal works, including but not limited to the design of personal papers, resumes, etc.)
Preview
Related Search: