Western Normal University Edition First Grade Mathematics Volume 1
Beijing Normal University Edition Seventh Grade Mathematics Volume 1
People's Education Press First Grade Mathematics Volume 1
People's Education Press Second Grade Mathematics Volume 1
Beijing Normal University Edition Seventh Grade Mathematics Volume 2
People's Education Press Third Grade Mathematics Volume 1
Beijing Normal University Edition Eighth Grade Mathematics Volume 1
Qingdao Edition Seventh Grade Mathematics Volume 1
Beijing Normal University Edition Fifth Grade Mathematics Volume 1
Hebei Education Edition Third Grade Mathematics Volume 1
Hebei Education Edition Seventh Grade Mathematics Volume 2
People's Education Press First Grade Mathematics Volume 2
People's Education High School Mathematics Edition B Compulsory Course 2
Qingdao Edition Seventh Grade Mathematics Volume 2
Beijing Normal University Edition Fifth Grade Mathematics Volume 2
Hebei Education Edition Fourth Grade Mathematics Volume 2

| Category | Format | Size |
|---|---|---|
| Beijing Normal University Edition Seventh Grade Mathematics Volume 2 | pptx | 6 MB |
Description
"The relationship between variables represented by tables" The relationship between variables PPT courseware 5
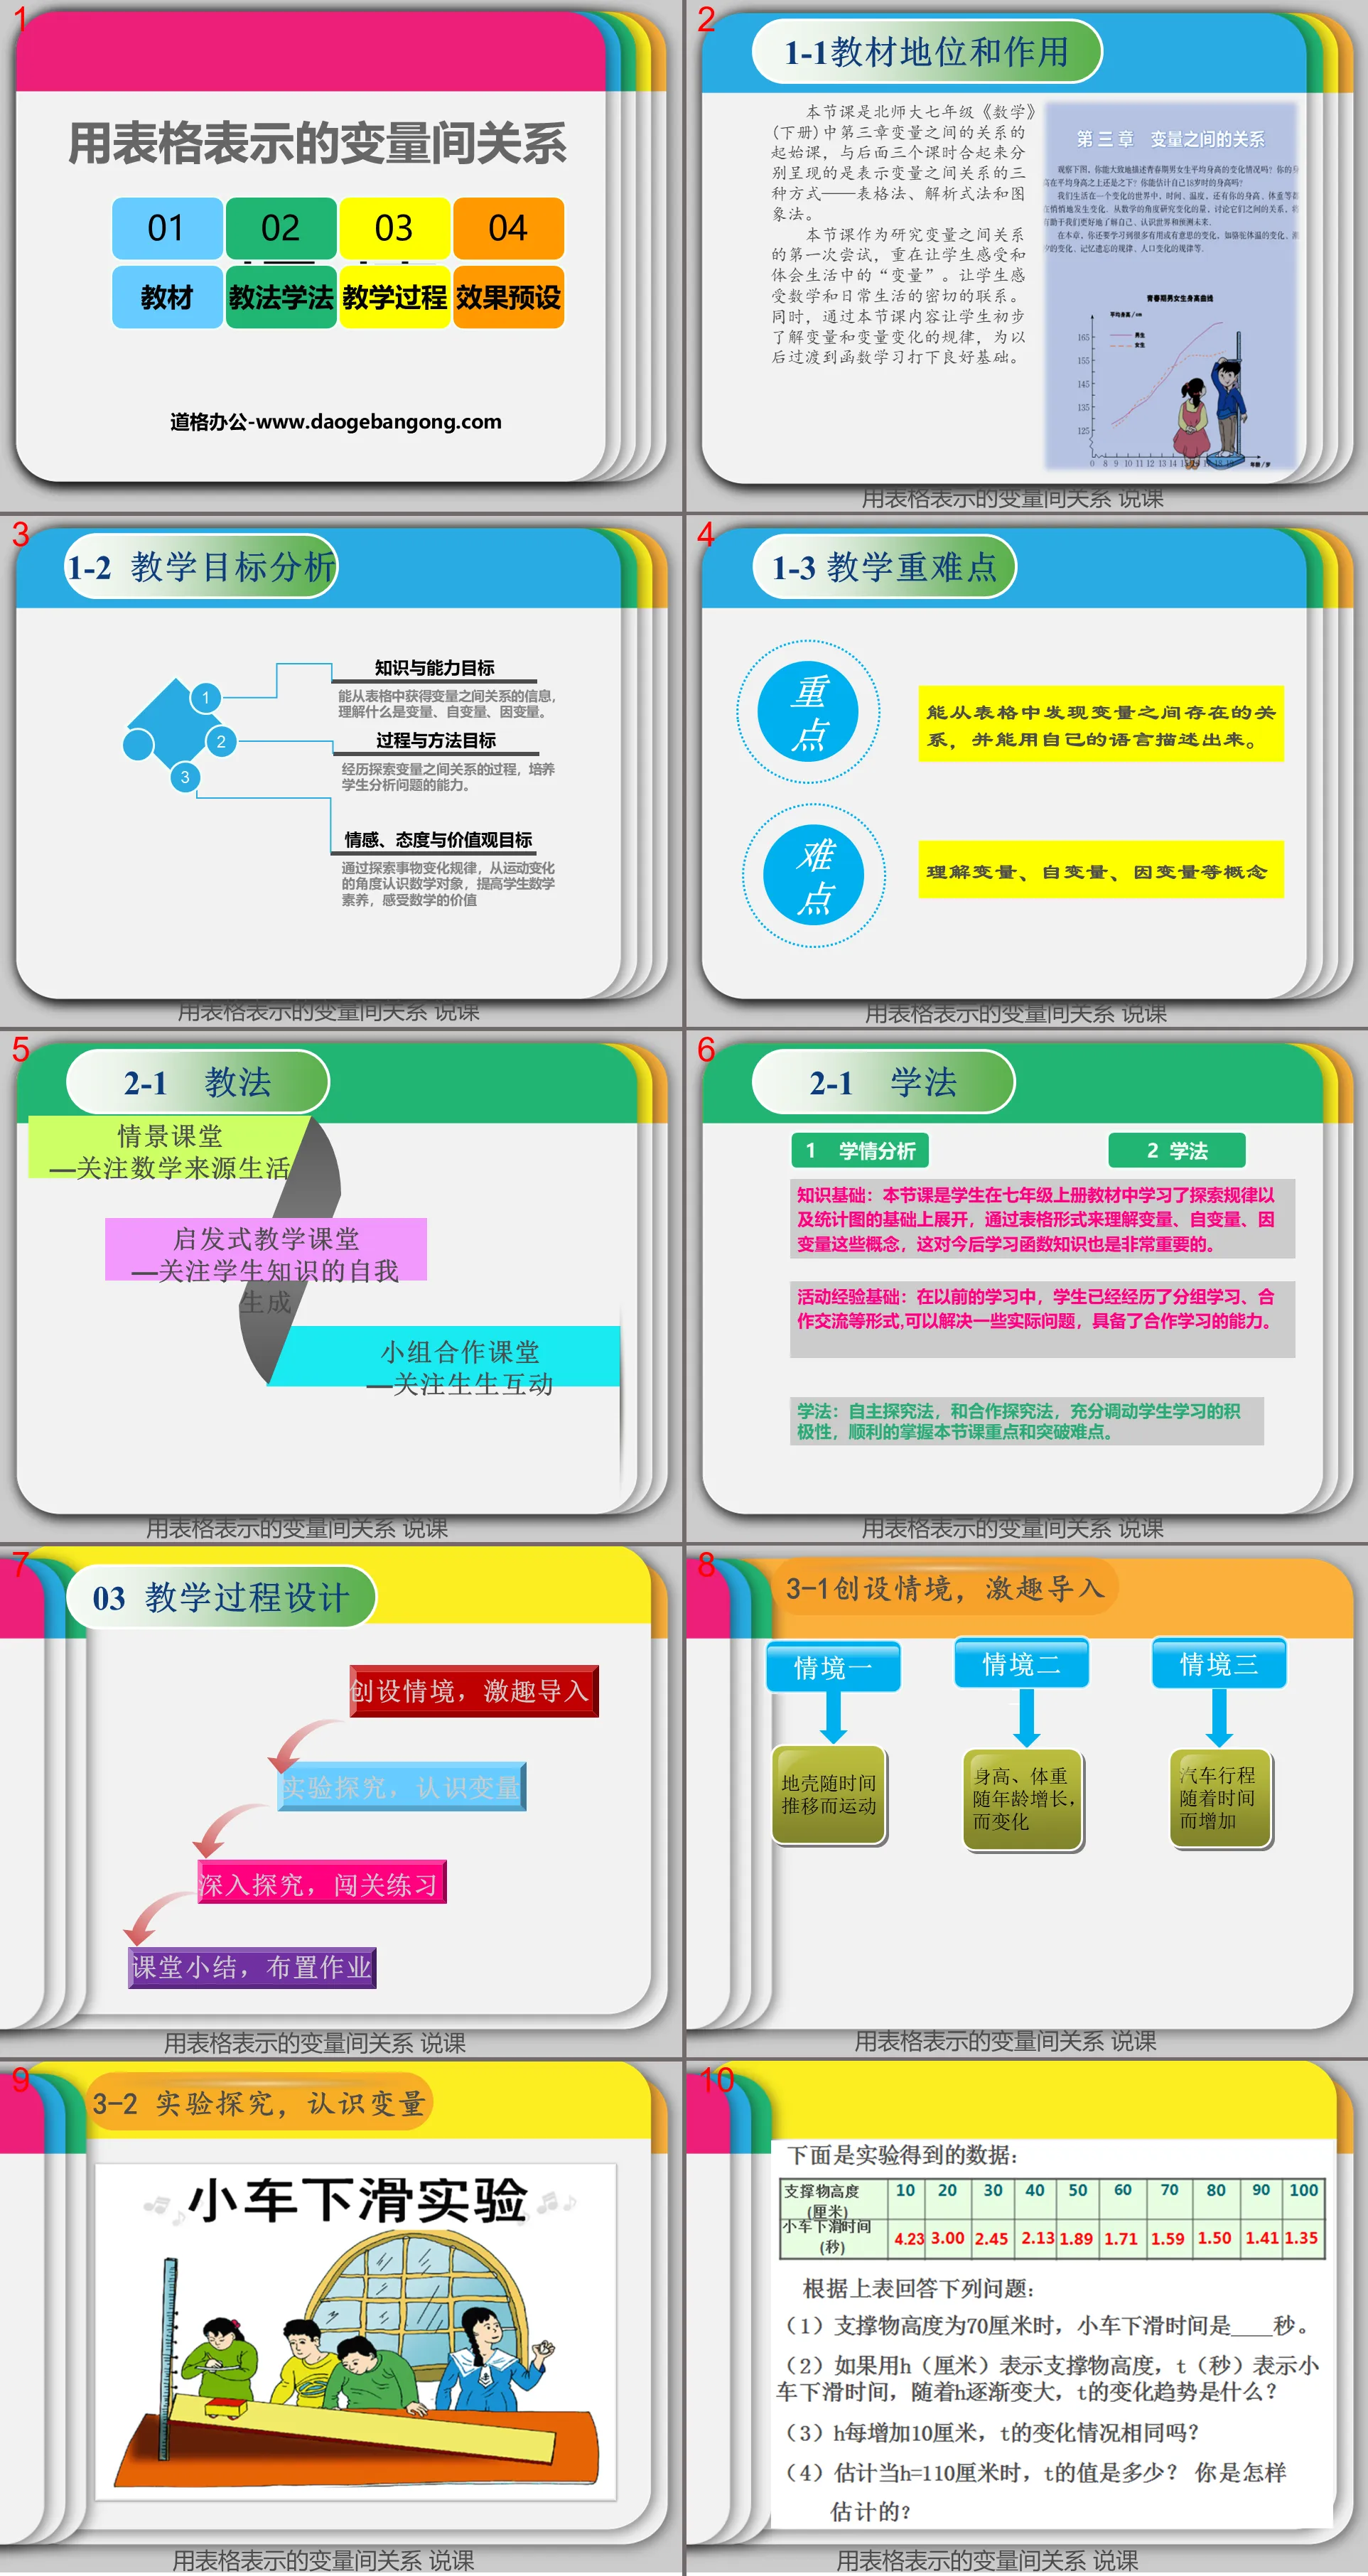
Knowledge base: This lesson is based on what students have learned about exploratory rules and statistical graphs in the seventh grade textbook. Students can understand the concepts of variables, independent variables, and dependent variables in the form of tables, which is also very important for learning function knowledge in the future. of.
Activity experience basis: In previous studies, students have experienced group learning, cooperative communication and other forms. They can solve some practical problems and have the ability to cooperate in learning.
Study method: independent inquiry method, and cooperative inquiry method, fully mobilize students' enthusiasm for learning, and successfully grasp the key points of this lesson and overcome difficulties.
In the "Time for the Car to Slide Down" experiment:
1. The height h of the support and the time t for the car to slide are both changing, and they are both variables.
2. The time t for the car to slide down changes with the change of the height h of the support.
3. The height h of the support is the independent variable.
4. The time t for the car to slide down is the dependent variable.
5. The distance the car slides down (the length of the board) has not changed. The quantity that remains unchanged during the change is called a constant.
6. With the help of tables, you can express how the dependent variable changes as the independent variable changes.
In the process of change, if there are two variables x and y, and y changes as x changes, we call x the independent variable and y the dependent variable.
1. The independent variable is a quantity that actively changes within a certain range.
2. The dependent variable is the quantity that changes as the independent variable changes.
3. The table can show how the dependent variable changes as the independent variable changes, and can also help us make preliminary predictions about the change trend.
Effect presets
1 Breakthrough key point: be able to discover the relationship between variables from the table and describe it in your own language.
2 Overcome difficulties: be able to find variables, independent variables, and dependent variables in specific situations.
3 Possible problems: Some students may not be able to fully grasp the trend when trying to use tables to predict changes.
4. There are many difficulties in actual operation regarding the activity experiment of the trolley's sliding time. Although a stopwatch is easy to prepare, the accuracy of the measurement results is difficult to grasp.
5. Since the time used for experiments is not easy to grasp, it may lead to tight time for subsequent study and discussion.
Keywords: teaching courseware on the relationship between variables, teaching courseware on the relationship between variables expressed in tables, Beijing Normal University edition seventh grade mathematics volume 2 PPT courseware, seventh grade mathematics slide courseware download, relationship between variables PPT courseware download, PPT courseware download of the relationship between variables expressed in tables, .ppt format
For more information about the PPT courseware "Relationships between variables expressed in tables and relationships between variables", please click on the "Relationships between variables PPT expressed in tables" PPT tag.
"Relationships between variables expressed in tables" PPT download of the relationship between variables:
"Relationships between variables expressed in tables" PPT download of the relationship between variables Part 1: Learning objectives 1. Experience the process of exploring the relationship between two variables in a specific situation, gain experience in exploring the relationship between variables, and further develop symbols Sense. 2. In concrete..
"Relationships between variables expressed in tables" Relationship between variables PPT:
"Relationships between variables expressed in tables" PPT on the relationship between variables Part 1: Teaching objectives 1. Understand what variables, independent variables and dependent variables are in specific situations; 2. Be able to obtain the relationship between variables from tables Information, a table can be used to represent variables...
"Relationships between variables represented by tables" Relationship between variables PPT courseware 4:
"Relationships between variables expressed in tables" Relationship between variables PPT courseware 4 Learning objectives 1. Experience the process of exploring the relationship between variables in certain graphs, and be able to understand the variables, independent variables, and dependent variables in the process, Further develop symbolic sense and abstract thinking. 2...
File Info
Update Time: 2024-11-21
This template belongs to Mathematics courseware Beijing Normal University Edition Seventh Grade Mathematics Volume 2 industry PPT template
"The relationship between variables represented by tables" The relationship between variables PPT courseware 5 Simple campus recruitment activity planning plan summary enterprise and institution recruitment publicity lecture PPT template is a general PPT template for business post competition provided by the manuscript PPT, simple campus recruitment activity planning plan summary enterprise and institution recruitment promotion Lecture PPT template, you can edit and modify the text and pictures in the source file by downloading the source file. If you want more exquisite business PPT templates, you can come to grid resource. Doug resource PPT, massive PPT template slide material download, we only make high-quality PPT templates!
Tips: If you open the template and feel that it is not suitable for all your needs, you can search for related content "The relationship between variables represented by tables" The relationship between variables PPT courseware 5 is enough.
How to use the Windows system template
Directly decompress the file and use it with office or wps
How to use the Mac system template
Directly decompress the file and use it Office or wps can be used
Related reading
For more detailed PPT-related tutorials and font tutorials, you can view: Click to see
How to create a high-quality technological sense PPT? 4 ways to share the bottom of the box
Notice
Do not download in WeChat, Zhihu, QQ, built-in browsers, please use mobile browsers to download! If you are a mobile phone user, please download it on your computer!
1. The manuscript PPT is only for study and reference, please delete it 24 hours after downloading.
2. If the resource involves your legitimate rights and interests, delete it immediately.
3. Contact information: service@daogebangong.com
"The relationship between variables represented by tables" The relationship between variables PPT courseware 5, due to usage restrictions, it is only for personal study and reference use. For commercial use, please go to the relevant official website for authorization.
(Personal non-commercial use refers to the use of this font to complete the display of personal works, including but not limited to the design of personal papers, resumes, etc.)
Preview


