Western Normal University Edition First Grade Mathematics Volume 1
Beijing Normal University Edition Seventh Grade Mathematics Volume 1
People's Education Press First Grade Mathematics Volume 1
People's Education Press Third Grade Mathematics Volume 1
People's Education Press Second Grade Mathematics Volume 1
Hebei Education Edition Third Grade Mathematics Volume 1
Beijing Normal University Edition Seventh Grade Mathematics Volume 2
Beijing Normal University Edition Fifth Grade Mathematics Volume 1
Qingdao Edition Seventh Grade Mathematics Volume 1
Hebei Education Edition Seventh Grade Mathematics Volume 2
Beijing Normal University Edition Eighth Grade Mathematics Volume 1
People's Education High School Mathematics Edition B Compulsory Course 2
Jiangsu Education Edition Fourth Grade Mathematics Volume 1
People's Education Press First Grade Mathematics Volume 2
Qingdao Edition Seventh Grade Mathematics Volume 2
Beijing Normal University Edition Fifth Grade Mathematics Volume 2

| Category | Format | Size |
|---|---|---|
| People's Education Press Fifth Grade Mathematics Volume 2 | pptx | 6 MB |

"Compound Line Statistical Chart" Line Statistical Chart PPT
2024-09-18
Copyright statement: This material is compiled and released by the user of Daoge Resources. The copyright belongs to the author. For commercial use, please contact the copyright owner. If there is any infringement, please contact the webmaster to remove the resource.
Download Points: 0.00
Free Download
Upgrade VIP
Favorite
Views: 2677 / Downloads: 727
Description
"Compound Line Statistical Chart" Line Statistical Chart PPT
Part One: Exciting Introduction
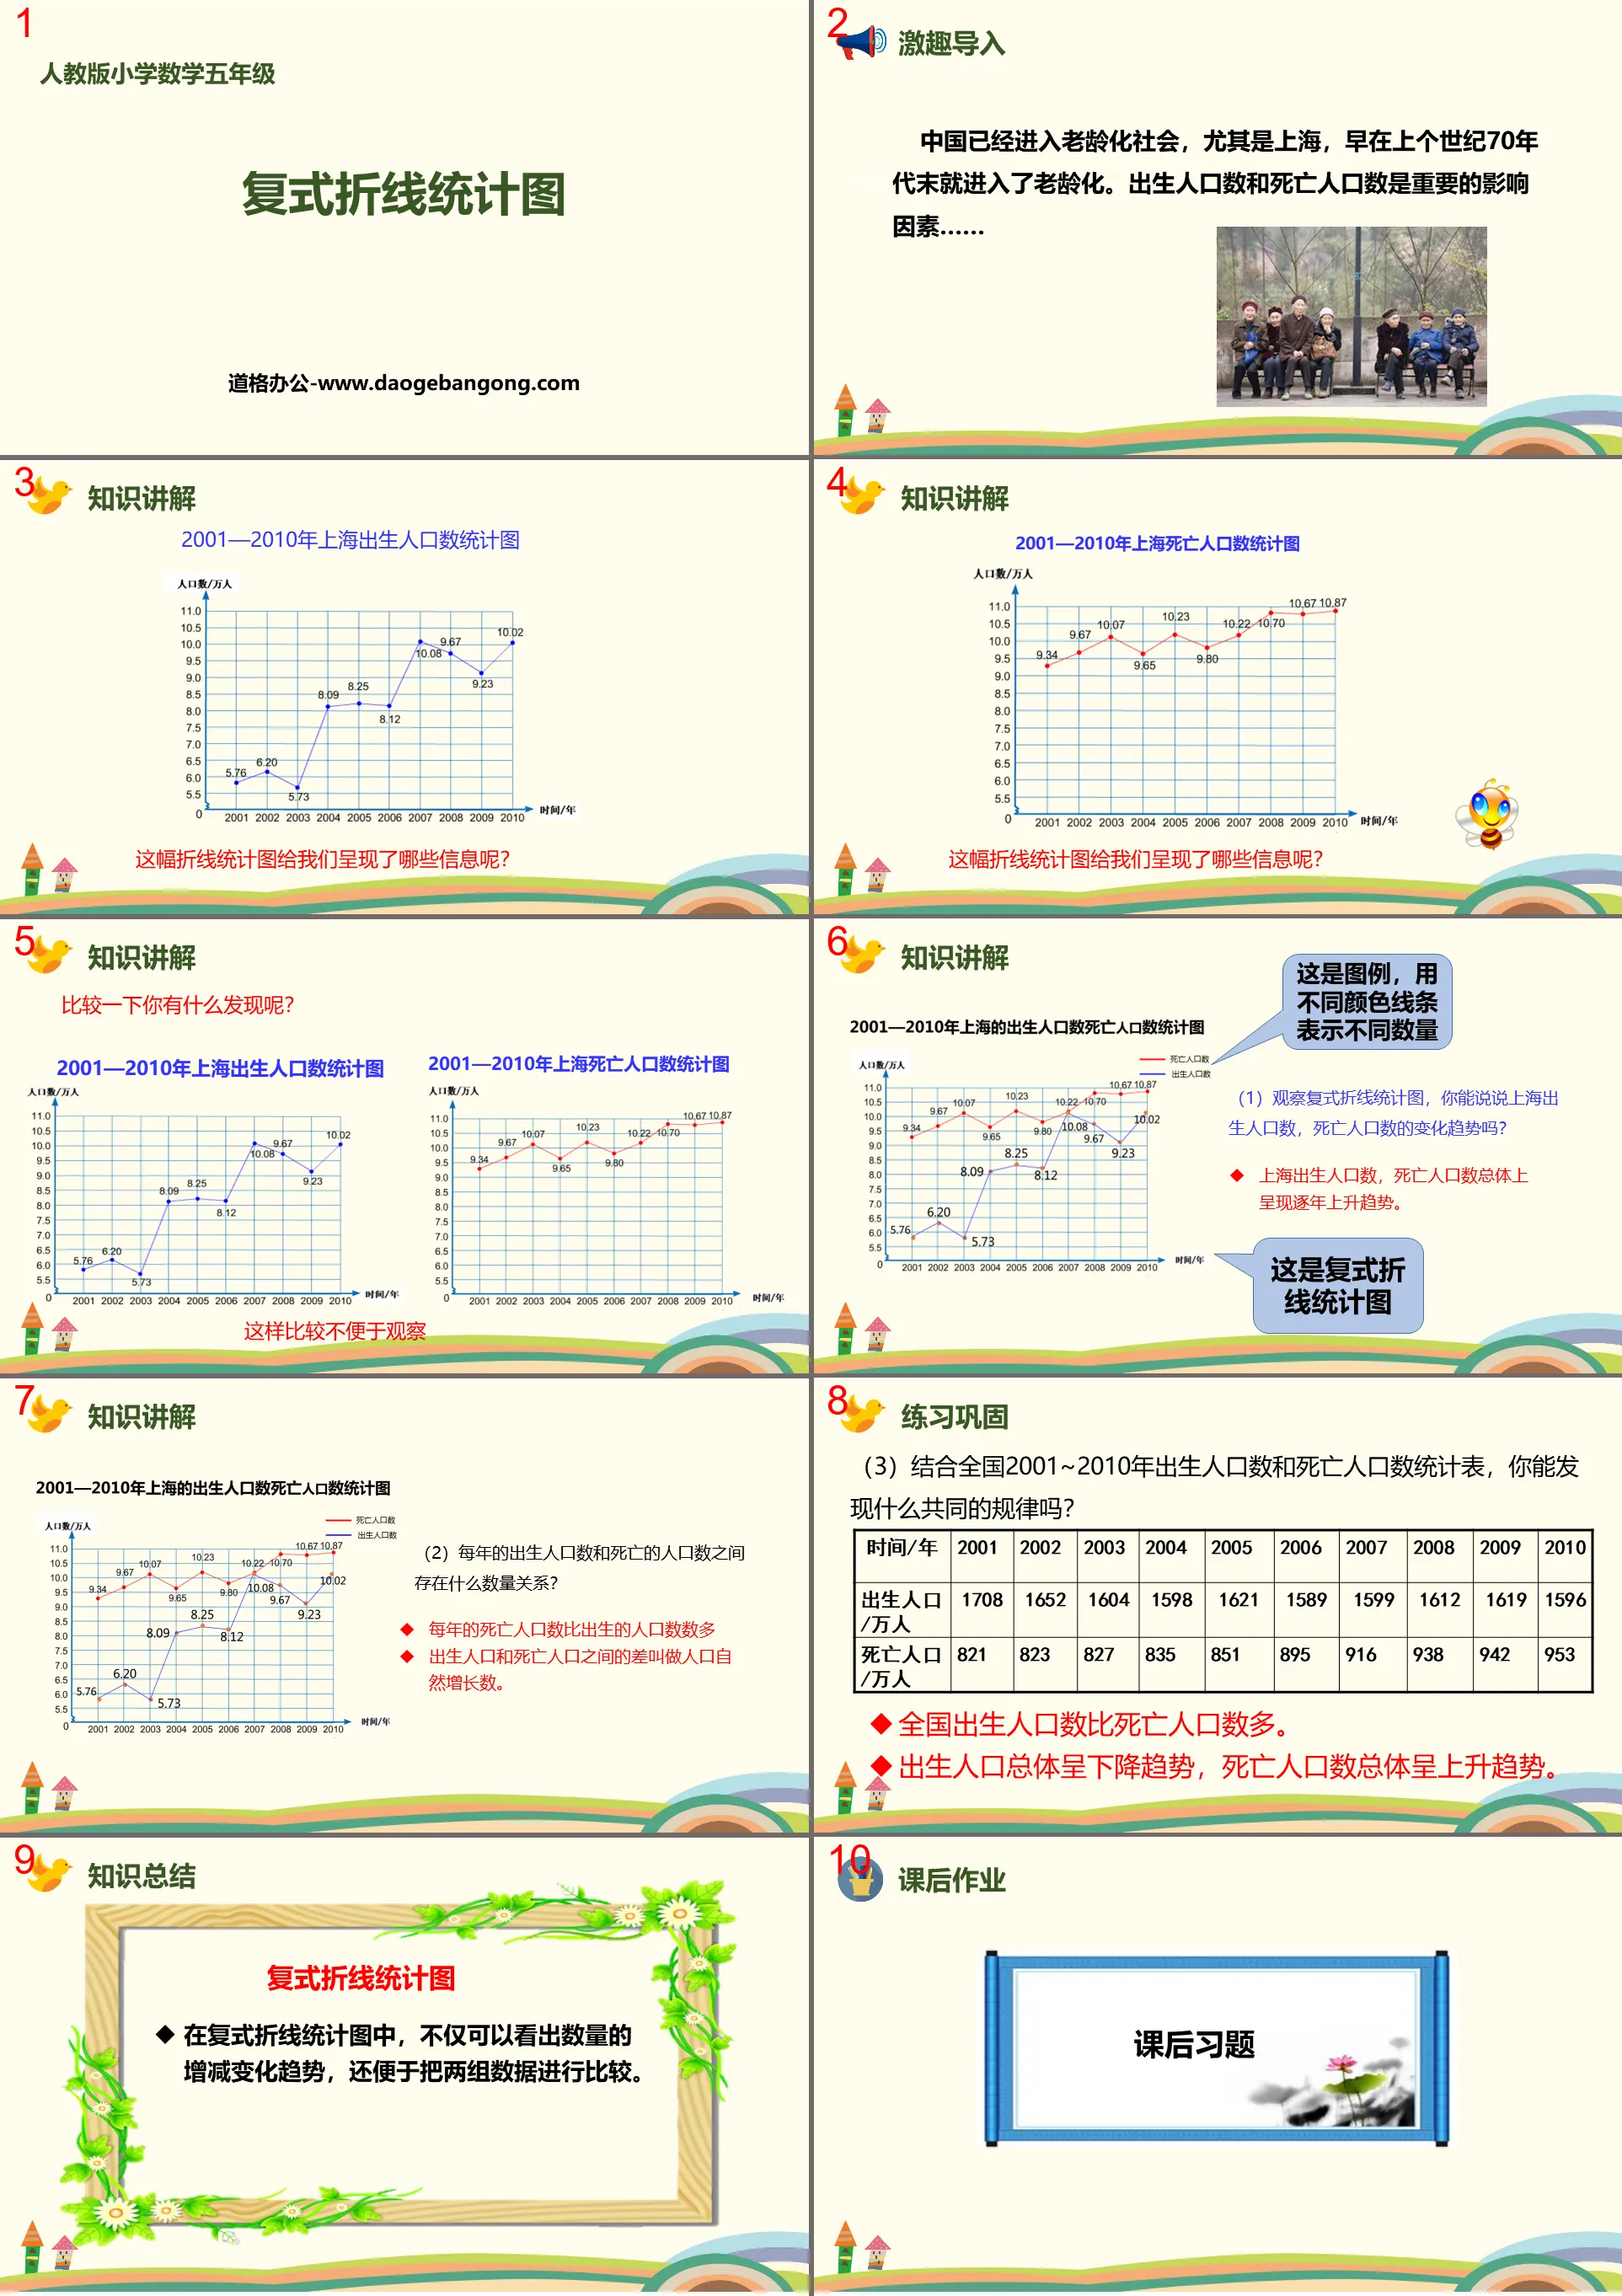
China has entered an aging society, especially Shanghai, which entered the aging society as early as the late 1970s. The number of births and deaths are important influencing factors...
Compound line statistical chart PPT, the second part of the content: knowledge explanation
Statistical chart of birth population in Shanghai from 2001 to 2010
What information does this line chart show us?
What did you find by comparison?
This is less convenient for observation
(1) Looking at the compound line statistical chart, can you talk about the changing trend of the number of births and deaths in Shanghai?
The number of births and deaths in Shanghai generally shows an increasing trend year by year.
(2) What is the quantitative relationship between the number of births and deaths each year?
There are more deaths than births every year
The difference between births and deaths is called natural population growth.
Compound line statistical chart PPT, the third part: knowledge summary
In the compound line statistical chart, you can not only see the increase or decrease trend in quantity, but also make it easier to compare the two sets of data.
Keywords: free download of PPT courseware for mathematics in the second volume of the fifth grade of the People's Education Press, download of compound line statistical chart PPT, download of broken line statistical chart PPT, .PPT format;
For more information about the "Line Statistics Chart and Compound Line Statistics Chart" PPT courseware, please click the Line Statistics Chart PPT and Compound Line Statistics Chart PPT tab.
"Compound Line Statistical Chart" Broken Line Statistical Chart PPT Download:
"Compound Broken Line Statistical Chart" Broken Line Statistical Chart PPT download Part 1: Introduction of the topic 1. Our country is now the most populous country in the world. In the 1970s, our country began to enter the aging era. The number of births and deaths can illustrate the problem...
"Complex Line Statistical Chart" PPT:
"Compound Broken Line Statistical Chart" PPT Part One: Analysis of Example Questions Example 3: From the founding of the People's Republic of China to the present, a total of six censuses have been conducted. The following is a statistical table of the results of the six censuses. (The data in the table does not include Hong Kong, Macau and Taiwan) ..
"Compound Line Statistical Chart" Line Statistical Chart PPT Courseware 3:
"Compound Line Statistical Chart" Line Statistical Chart PPT Courseware 3 What kind of statistical chart can the above statistical table be made into? What's the reason? If you want to see the changing trend of data, what kind of statistical chart is more suitable? Can you tell me how to draw it? ... ... ... In order to enhance...
File Info
Update Time: 2024-09-18
This template belongs to Mathematics courseware People's Education Press Fifth Grade Mathematics Volume 2 industry PPT template
"Compound Line Statistical Chart" Line Statistical Chart PPT Simple campus recruitment activity planning plan summary enterprise and institution recruitment publicity lecture PPT template is a general PPT template for business post competition provided by the manuscript PPT, simple campus recruitment activity planning plan summary enterprise and institution recruitment promotion Lecture PPT template, you can edit and modify the text and pictures in the source file by downloading the source file. If you want more exquisite business PPT templates, you can come to grid resource. Doug resource PPT, massive PPT template slide material download, we only make high-quality PPT templates!
Tips: If you open the template and feel that it is not suitable for all your needs, you can search for related content "Compound Line Statistical Chart" Line Statistical Chart PPT is enough.
How to use the Windows system template
Directly decompress the file and use it with office or wps
How to use the Mac system template
Directly decompress the file and use it Office or wps can be used
Related reading
For more detailed PPT-related tutorials and font tutorials, you can view: Click to see
How to create a high-quality technological sense PPT? 4 ways to share the bottom of the box
Notice
Do not download in WeChat, Zhihu, QQ, built-in browsers, please use mobile browsers to download! If you are a mobile phone user, please download it on your computer!
1. The manuscript PPT is only for study and reference, please delete it 24 hours after downloading.
2. If the resource involves your legitimate rights and interests, delete it immediately.
3. Contact information: service@daogebangong.com
"Compound Line Statistical Chart" Line Statistical Chart PPT, due to usage restrictions, it is only for personal study and reference use. For commercial use, please go to the relevant official website for authorization.
(Personal non-commercial use refers to the use of this font to complete the display of personal works, including but not limited to the design of personal papers, resumes, etc.)
Preview
Related Search:
"Compound Line Statistical Chart" Line Statistical Chart PPT
2024-09-18
Copyright statement: This material is compiled and released by the user of Daoge Resources. The copyright belongs to the author. For commercial use, please contact the copyright owner. If there is any infringement, please contact the webmaster to remove the resource.
Download Points: 0.00
Free Download
Upgrade VIP
Favorite
Views: 2677 / Downloads: 727


