Western Normal University Edition First Grade Mathematics Volume 1
Beijing Normal University Edition Seventh Grade Mathematics Volume 1
People's Education Press First Grade Mathematics Volume 1
People's Education Press Third Grade Mathematics Volume 1
People's Education Press Second Grade Mathematics Volume 1
Hebei Education Edition Third Grade Mathematics Volume 1
Beijing Normal University Edition Seventh Grade Mathematics Volume 2
Beijing Normal University Edition Fifth Grade Mathematics Volume 1
Qingdao Edition Seventh Grade Mathematics Volume 1
Hebei Education Edition Seventh Grade Mathematics Volume 2
Beijing Normal University Edition Eighth Grade Mathematics Volume 1
People's Education High School Mathematics Edition B Compulsory Course 2
People's Education Press First Grade Mathematics Volume 2
Jiangsu Education Edition Fourth Grade Mathematics Volume 1
Qingdao Edition Seventh Grade Mathematics Volume 2
Beijing Normal University Edition Fifth Grade Mathematics Volume 2

| Category | Format | Size |
|---|---|---|
| Qingdao Edition Ninth Grade Mathematics Volume 2 | pptx | 6 MB |

"Function and Its Representation" PPT courseware
2024-10-03
Copyright statement: This material is compiled and released by the user of Daoge Resources. The copyright belongs to the author. For commercial use, please contact the copyright owner. If there is any infringement, please contact the webmaster to remove the resource.
Download Points: 0.00
Free Download
Upgrade VIP
Favorite
Views: 2768 / Downloads: 217
Description
"Function and Its Representation" PPT courseware
teaching objectives
Knowledge and skills:
1. Enable students to use lists, trace points, and connect lines to draw letters and images.
2. Learn to observe and analyze function image information, and be able to interpret images, that is, you can understand abstract quantitative relationships from images.
Process and methods:
1. Review and think about experiences, and train to improve your ability to summarize.
2. Improve the ability to use numbers and shapes to combine ideas and choose appropriate methods to solve problems according to specific situations.
3. Improve the ability to read pictures and analyze function image information.
Emotional attitudes and values:
1. Understand the diversity of mathematical methods and increase interest in learning.
2. Understand the important role of mathematics in solving problems, thereby deepening your understanding of mathematics.
Key points: 1. Use point tracing method to draw the graph of function. 2. Observe and analyze image information.
Difficulty: Analyze and summarize the information in the image.
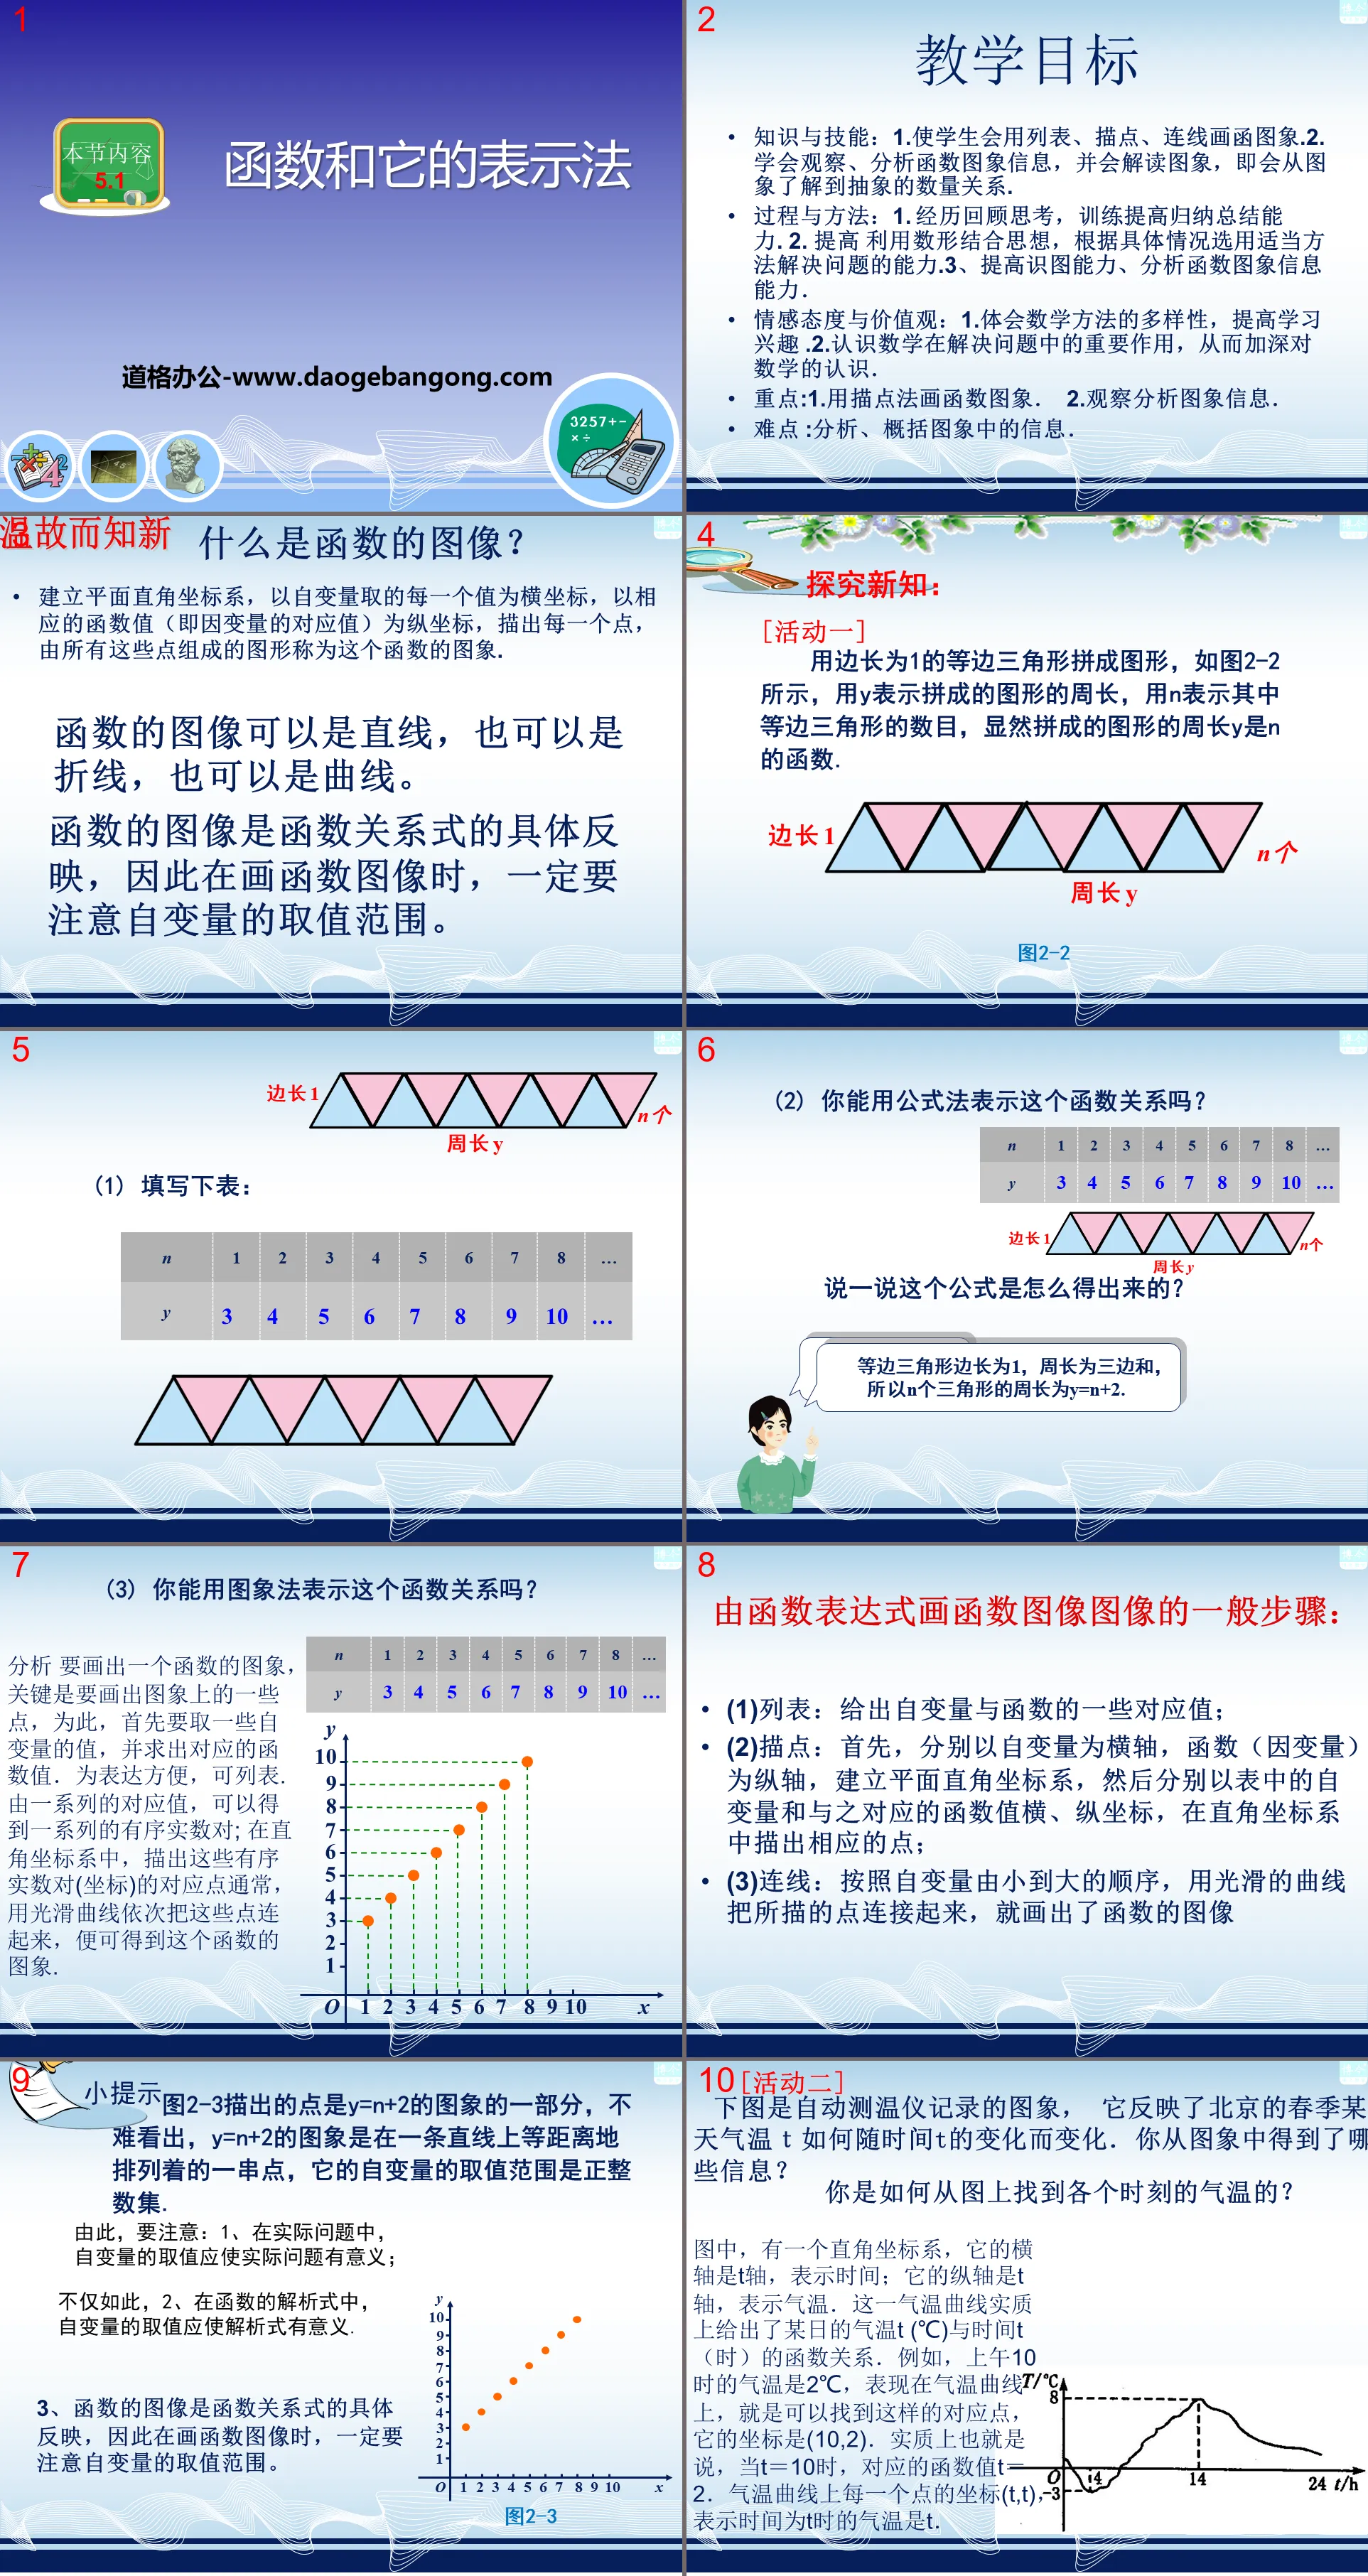
What is the graph of a function?
Establish a plane rectangular coordinate system, take each value of the independent variable as the abscissa, take the corresponding function value (that is, the corresponding value of the dependent variable) as the ordinate, draw each point, and the graph composed of all these points is called this The graph of the function.
The graph of a function can be a straight line, a polyline, or a curve.
The graph of a function is a concrete reflection of the functional relationship. Therefore, when drawing the graph of a function, you must pay attention to the value range of the independent variable.
General steps for drawing function image images from function expressions:
(1) List: Give some corresponding values of independent variables and functions;
(2) Drawing points: First, use the independent variables as the horizontal axis and the function (dependent variable) as the vertical axis to establish a plane rectangular coordinate system, and then use the independent variables in the table and the corresponding function values as the horizontal and vertical coordinates, Describe the corresponding points in the Cartesian coordinate system;
(3) Connecting lines: According to the order of independent variables from small to large, use smooth curves to connect the drawn points to draw the image of the function.
The points depicted in Figure 2-3 are part of the image of y=n+2. It is not difficult to see that the image of y=n+2 is a series of points arranged equidistantly on a straight line. Its independent variable The value range of is the set of positive integers.
Therefore, it should be noted that: 1. In practical problems, the values of independent variables should make the actual problem meaningful;
Not only that, 2. In the analytical expression of the function, the values of the independent variables should make the analytical expression meaningful.
3. The image of a function is a specific reflection of the functional relationship. Therefore, when drawing the image of a function, you must pay attention to the value range of the independent variable.
Application migration, consolidation and improvement
1. In the physics experiment class, Xiao Ming used a spring scale to suspend the iron block A in a tank filled with water, and then lifted it upwards at a constant speed (regardless of the resistance of the water) until the iron block was completely exposed to a certain height above the water surface. Then the figure below can The general image reflecting the functional relationship between the reading y of the spring scale (unit N) and the height x (unit cm) of the iron block is lifted is
2. As shown in the figure, the side length of square ABCD is 2, P is a moving point on the side of the square, and the movement route is A→D→C→B→A. Suppose the distance traveled by point P is x, taking points A, P, and D The area of the triangle with the vertex as the vertex is y. Then the following image can roughly reflect the functional relationship between y and x ( )
3. An express train runs from place A to place B, and an express train runs from place B to place A. The speed of the express train is 100 km/h, and the speed of the express train is 150 km/h. The distance between A and B is The distance is 1000 kilometers, and two cars start at the same time. The polyline in the figure roughly represents the function graph between the distance y (kilometers) between the two cars and the express train travel time t (hours):
Reflection after class:
Highlights: ① Supplemented the completeness of the knowledge content; ② Made two adjustments to the example questions: one is the selection and setting of the questions, and the other is the order of explaining the questions; ③ The depth of the content is explored. Regret: The timing is not accurate. . Since I have broadened the scope of knowledge points and expanded the depth of knowledge points on the basis of the original textbook. It seems that I have overestimated my own and my students' abilities, so I think it is better to take so much content in two separate classes.
Doubts and immature suggestions for teaching materials
Functions and function graphs are widely used in practical problems and are also important and difficult points in the high school entrance examination. Function graphs are the basis for other complex functions and function graphs. It is particularly important to lay a solid foundation for this. The textbook discusses subfunctions and its representation are only arranged for two classes, and the second class teaches the representation method of functions and the connections between them. When solving practical problems, we need to combine the three and involve a lot of knowledge, so I think this Should we add another 2 hours of content to the first link: how to determine the analytical formula of a function, how to determine the value range of the independent variables in the function and the corresponding function value, how to draw the image of the function, and how to improve the ability to interpret the image.
Keywords: Function and its representation teaching courseware, Qingdao edition ninth grade mathematics volume 2 mathematics PPT courseware download, ninth grade mathematics slide courseware download, function and its representation PPT courseware download, .PPT format;
For more information about the "Function and Its Notation" PPT courseware, please click on the "Function and Its Notation" PPT tab.
"Function and Its Representation" PPT courseware 3:
"Function and Its Representation" PPT Courseware 3 Observation and Thinking Do you still remember what a function is? In real life, functional relationships exist everywhere. Do you know what are the common ways to express functional relationships? Function definition In the same change process, there are...
"Function and Its Representation" PPT Courseware 2:
"Function and Its Representation" PPT Courseware 2 Learning Objectives 1. Understand the concept of function, and be able to judge whether the relationship between two variables satisfies a functional relationship; 2. Understand the representation methods of functions, and be able to flexibly use these representation methods to express A function; 3. Understand functions..
File Info
Update Time: 2024-10-03
This template belongs to Mathematics courseware Qingdao Edition Ninth Grade Mathematics Volume 2 industry PPT template
"Function and Its Representation" PPT courseware Simple campus recruitment activity planning plan summary enterprise and institution recruitment publicity lecture PPT template is a general PPT template for business post competition provided by the manuscript PPT, simple campus recruitment activity planning plan summary enterprise and institution recruitment promotion Lecture PPT template, you can edit and modify the text and pictures in the source file by downloading the source file. If you want more exquisite business PPT templates, you can come to grid resource. Doug resource PPT, massive PPT template slide material download, we only make high-quality PPT templates!
Tips: If you open the template and feel that it is not suitable for all your needs, you can search for related content "Function and Its Representation" PPT courseware is enough.
How to use the Windows system template
Directly decompress the file and use it with office or wps
How to use the Mac system template
Directly decompress the file and use it Office or wps can be used
Related reading
For more detailed PPT-related tutorials and font tutorials, you can view: Click to see
How to create a high-quality technological sense PPT? 4 ways to share the bottom of the box
Notice
Do not download in WeChat, Zhihu, QQ, built-in browsers, please use mobile browsers to download! If you are a mobile phone user, please download it on your computer!
1. The manuscript PPT is only for study and reference, please delete it 24 hours after downloading.
2. If the resource involves your legitimate rights and interests, delete it immediately.
3. Contact information: service@daogebangong.com
"Function and Its Representation" PPT courseware, due to usage restrictions, it is only for personal study and reference use. For commercial use, please go to the relevant official website for authorization.
(Personal non-commercial use refers to the use of this font to complete the display of personal works, including but not limited to the design of personal papers, resumes, etc.)
Preview
Related Search:
"Function and Its Representation" PPT courseware
2024-10-03
Copyright statement: This material is compiled and released by the user of Daoge Resources. The copyright belongs to the author. For commercial use, please contact the copyright owner. If there is any infringement, please contact the webmaster to remove the resource.
Download Points: 0.00
Free Download
Upgrade VIP
Favorite
Views: 2768 / Downloads: 217


