Western Normal University Edition First Grade Mathematics Volume 1
Beijing Normal University Edition Seventh Grade Mathematics Volume 1
People's Education Press First Grade Mathematics Volume 1
People's Education Press Second Grade Mathematics Volume 1
Beijing Normal University Edition Seventh Grade Mathematics Volume 2
People's Education Press Third Grade Mathematics Volume 1
Beijing Normal University Edition Eighth Grade Mathematics Volume 1
Qingdao Edition Seventh Grade Mathematics Volume 1
Beijing Normal University Edition Fifth Grade Mathematics Volume 1
Hebei Education Edition Third Grade Mathematics Volume 1
Hebei Education Edition Seventh Grade Mathematics Volume 2
People's Education Press First Grade Mathematics Volume 2
People's Education High School Mathematics Edition B Compulsory Course 2
Qingdao Edition Seventh Grade Mathematics Volume 2
Beijing Normal University Edition Fifth Grade Mathematics Volume 2
Hebei Education Edition Fourth Grade Mathematics Volume 2

| Category | Format | Size |
|---|---|---|
| Qingdao Edition Ninth Grade Mathematics Volume 2 | pptx | 6 MB |
Description
"Changing Trends of Random Phenomenon" PPT Courseware 2
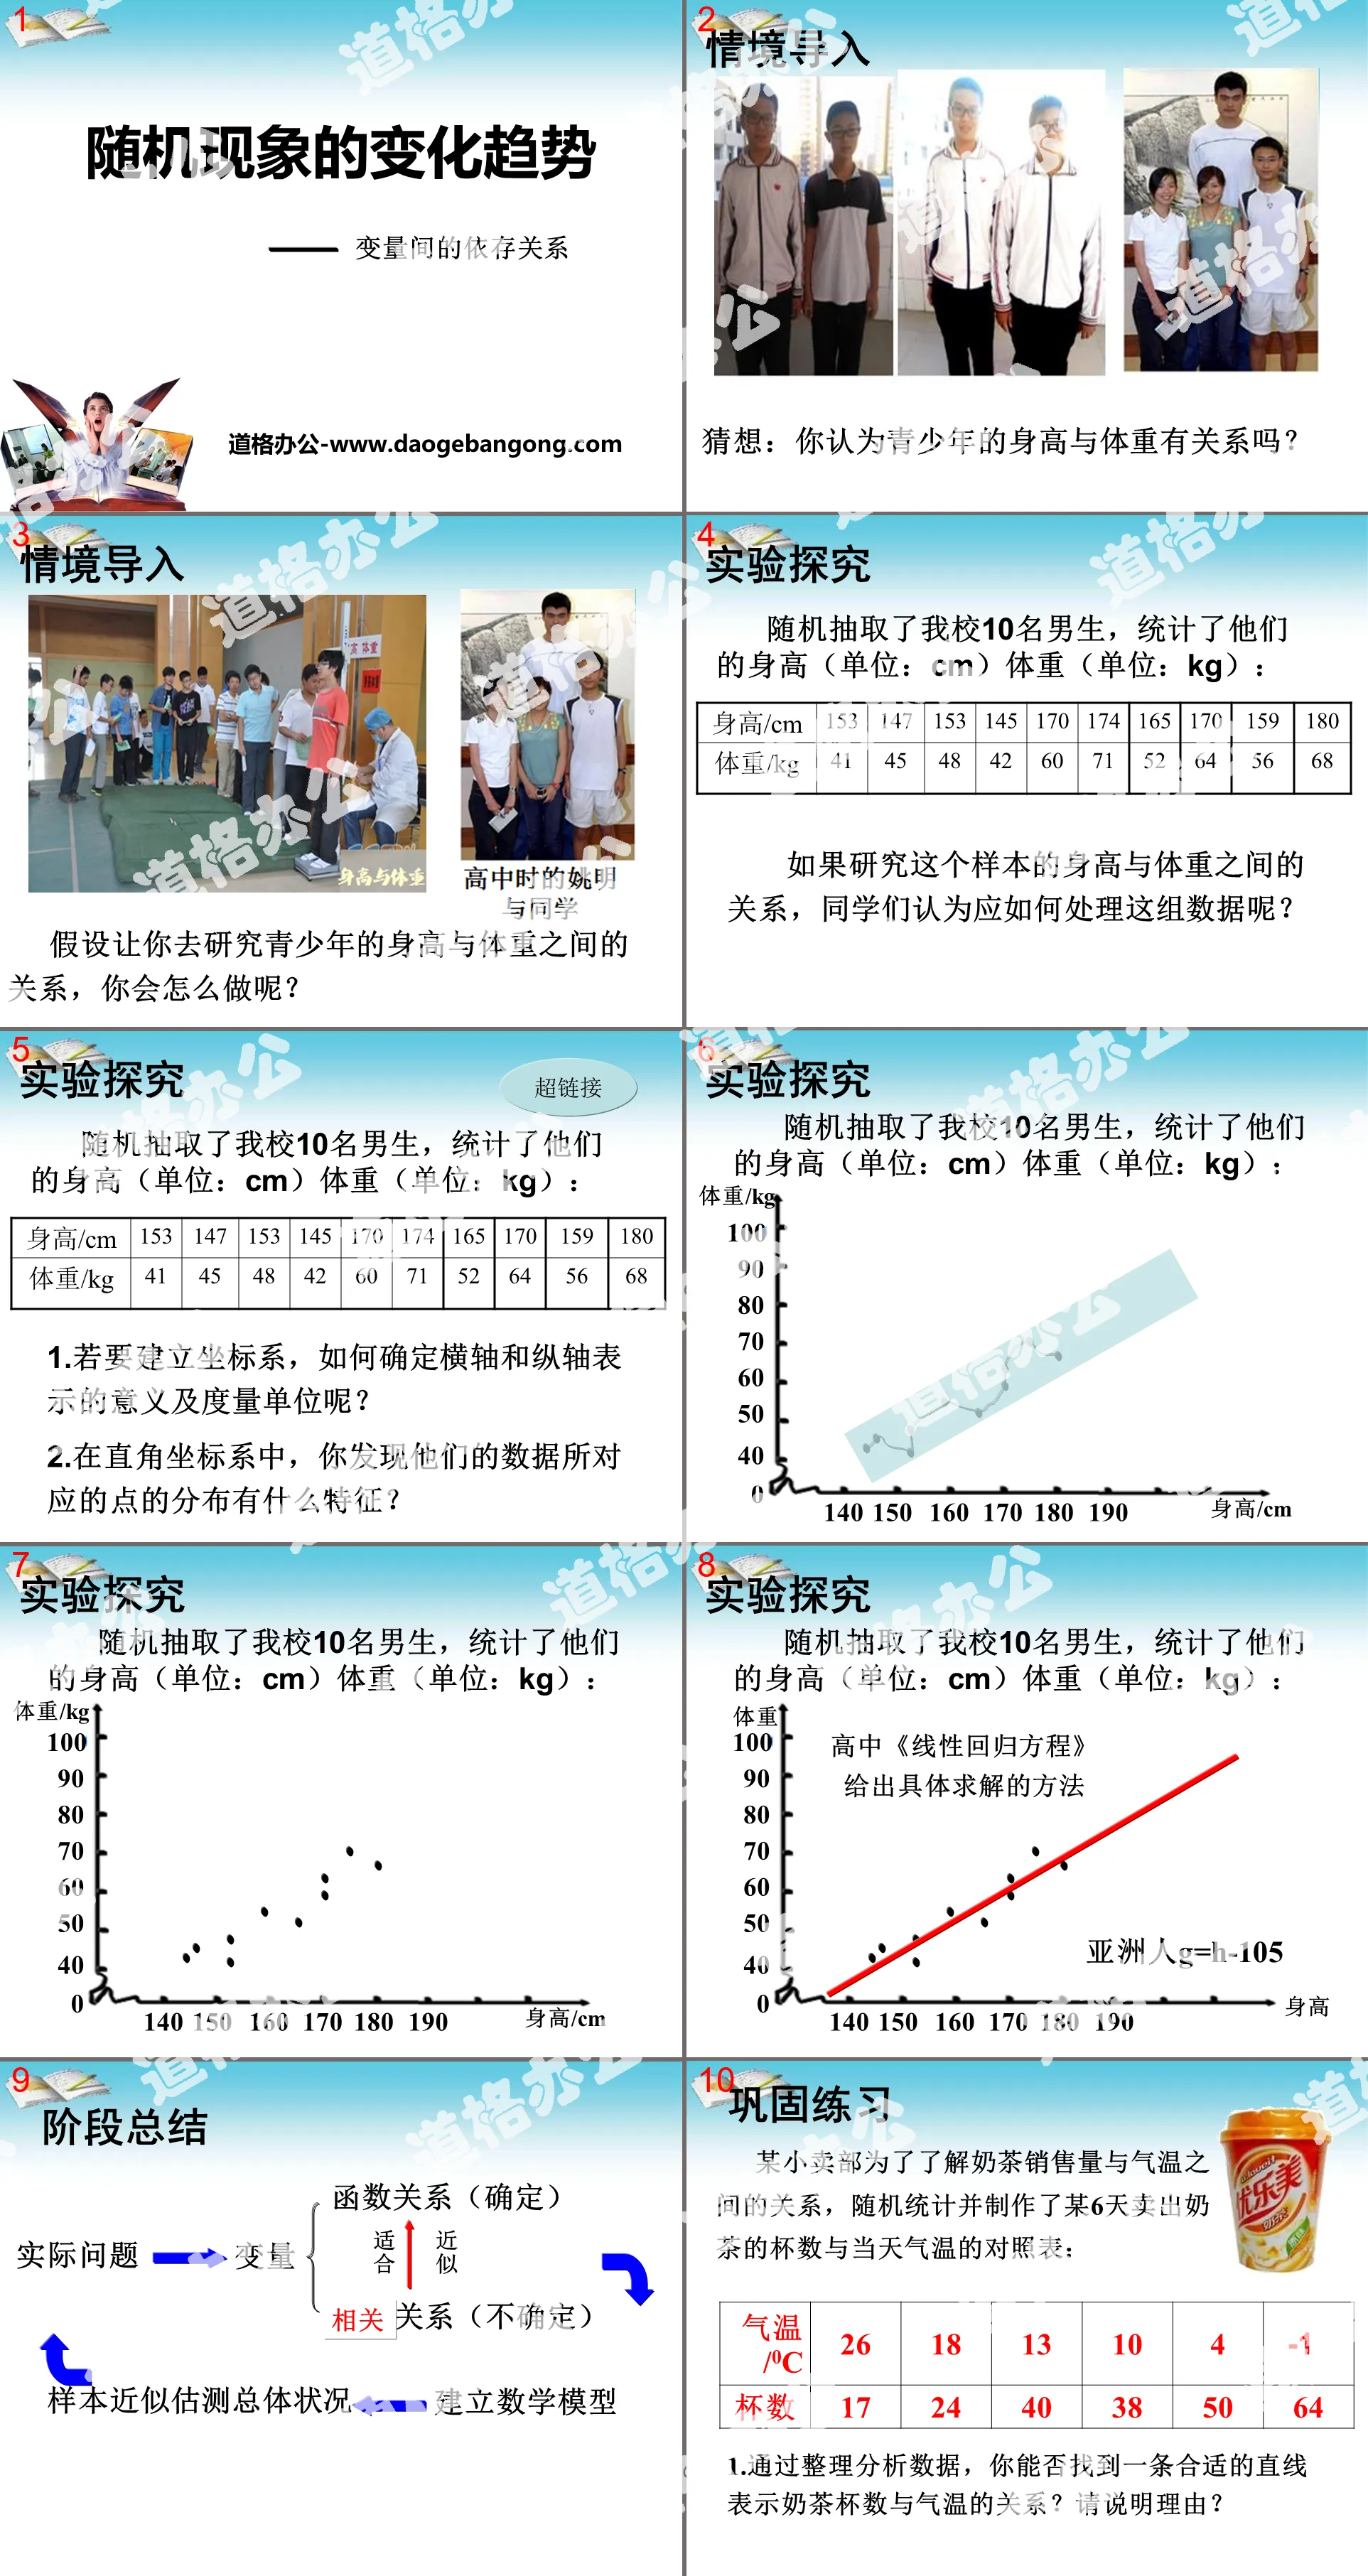
Situation import
Guess: Do you think there is a relationship between the height and weight of teenagers?
Suppose you were asked to study the relationship between height and weight in adolescents. What would you do?
Experimental exploration
Ten boys from our school were randomly selected and their height (unit: cm) and weight (unit: kg) were calculated:
If we study the relationship between the height and weight of this sample, what do students think should be done with this set of data?
1. If you want to establish a coordinate system, how to determine the meaning and measurement unit of the horizontal and vertical axes?
2. In the Cartesian coordinate system, what characteristics did you find in the distribution of points corresponding to their data?
Consolidation exercises
In order to understand the relationship between milk tea sales and temperature, a small store randomly counted and produced a comparison table between the number of cups of milk tea sold in a certain 6 days and the temperature on that day:
1. By sorting and analyzing the data, can you find a suitable straight line representing the relationship between the number of cups of milk tea and the temperature? Please explain why?
2. If the temperature on a certain day is -50C, can you predict the number of cups of milk tea sold in the canteen on that day based on these data?
Classroom extension
Linear analysis of stocks (the fluctuations of stocks are sometimes within a band-shaped area, and an approximate straight line is found to describe the change trend)
There are some random phenomena that cannot be described by linear function models (you can check them online by yourself).
Keywords: teaching courseware on changing trends of random phenomena, Qingdao edition ninth grade mathematics volume 2 PPT courseware download, ninth grade mathematics slide courseware download, changing trend of random phenomena PPT courseware download, .PPT format;
For more information about the "Changing Trends of Random Phenomena" PPT courseware, please click the "Changing Trends of Random Phenomena" PPT courseware.
"Changing Trends of Random Phenomenon" PPT courseware:
"The Changing Trend of Random Phenomenon" PPT courseware learning objective is to use the coordinate system to study the changing trend of certain random phenomena and the correlation between random phenomena. The new lesson introduces the correlation between variables in the interconnected random phenomena in the objective world. Some can...
File Info
Update Time: 2024-11-22
This template belongs to Mathematics courseware Qingdao Edition Ninth Grade Mathematics Volume 2 industry PPT template
"Changing Trends of Random Phenomenon" PPT Courseware 2 Simple campus recruitment activity planning plan summary enterprise and institution recruitment publicity lecture PPT template is a general PPT template for business post competition provided by the manuscript PPT, simple campus recruitment activity planning plan summary enterprise and institution recruitment promotion Lecture PPT template, you can edit and modify the text and pictures in the source file by downloading the source file. If you want more exquisite business PPT templates, you can come to grid resource. Doug resource PPT, massive PPT template slide material download, we only make high-quality PPT templates!
Tips: If you open the template and feel that it is not suitable for all your needs, you can search for related content "Changing Trends of Random Phenomenon" PPT Courseware 2 is enough.
How to use the Windows system template
Directly decompress the file and use it with office or wps
How to use the Mac system template
Directly decompress the file and use it Office or wps can be used
Related reading
For more detailed PPT-related tutorials and font tutorials, you can view: Click to see
How to create a high-quality technological sense PPT? 4 ways to share the bottom of the box
Notice
Do not download in WeChat, Zhihu, QQ, built-in browsers, please use mobile browsers to download! If you are a mobile phone user, please download it on your computer!
1. The manuscript PPT is only for study and reference, please delete it 24 hours after downloading.
2. If the resource involves your legitimate rights and interests, delete it immediately.
3. Contact information: service@daogebangong.com
"Changing Trends of Random Phenomenon" PPT Courseware 2, due to usage restrictions, it is only for personal study and reference use. For commercial use, please go to the relevant official website for authorization.
(Personal non-commercial use refers to the use of this font to complete the display of personal works, including but not limited to the design of personal papers, resumes, etc.)
Preview


