Western Normal University Edition First Grade Mathematics Volume 1
Beijing Normal University Edition Seventh Grade Mathematics Volume 1
People's Education Press First Grade Mathematics Volume 1
People's Education Press Third Grade Mathematics Volume 1
People's Education Press Second Grade Mathematics Volume 1
Hebei Education Edition Third Grade Mathematics Volume 1
Beijing Normal University Edition Seventh Grade Mathematics Volume 2
Beijing Normal University Edition Fifth Grade Mathematics Volume 1
Qingdao Edition Seventh Grade Mathematics Volume 1
Beijing Normal University Edition Eighth Grade Mathematics Volume 1
Hebei Education Edition Seventh Grade Mathematics Volume 2
People's Education High School Mathematics Edition B Compulsory Course 2
Qingdao Edition Seventh Grade Mathematics Volume 2
Jiangsu Education Edition Fourth Grade Mathematics Volume 1
People's Education Press First Grade Mathematics Volume 2
Beijing Normal University Edition Fifth Grade Mathematics Volume 2

| Category | Format | Size |
|---|---|---|
| Qingdao Edition Eighth Grade Mathematics Volume 1 | pptx | 6 MB |

"The Dispersion Degree of Data" PPT courseware
2024-10-03
Copyright statement: This material is compiled and released by the user of Daoge Resources. The copyright belongs to the author. For commercial use, please contact the copyright owner. If there is any infringement, please contact the webmaster to remove the resource.
Download Points: 0.00
Free Download
Upgrade VIP
Favorite
Views: 2246 / Downloads: 131
Description
"The Dispersion Degree of Data" PPT courseware
Review the past and learn the new
1. Average
x=1/n(x1+x2+x3+····+xn)
2. Mode
In a set of data, the data that appears most often is called the mode of the set of data.
3. Median
Arrange a set of data from small to large, and the middle number (or the average of the two middle numbers) is called the median of the set of data.
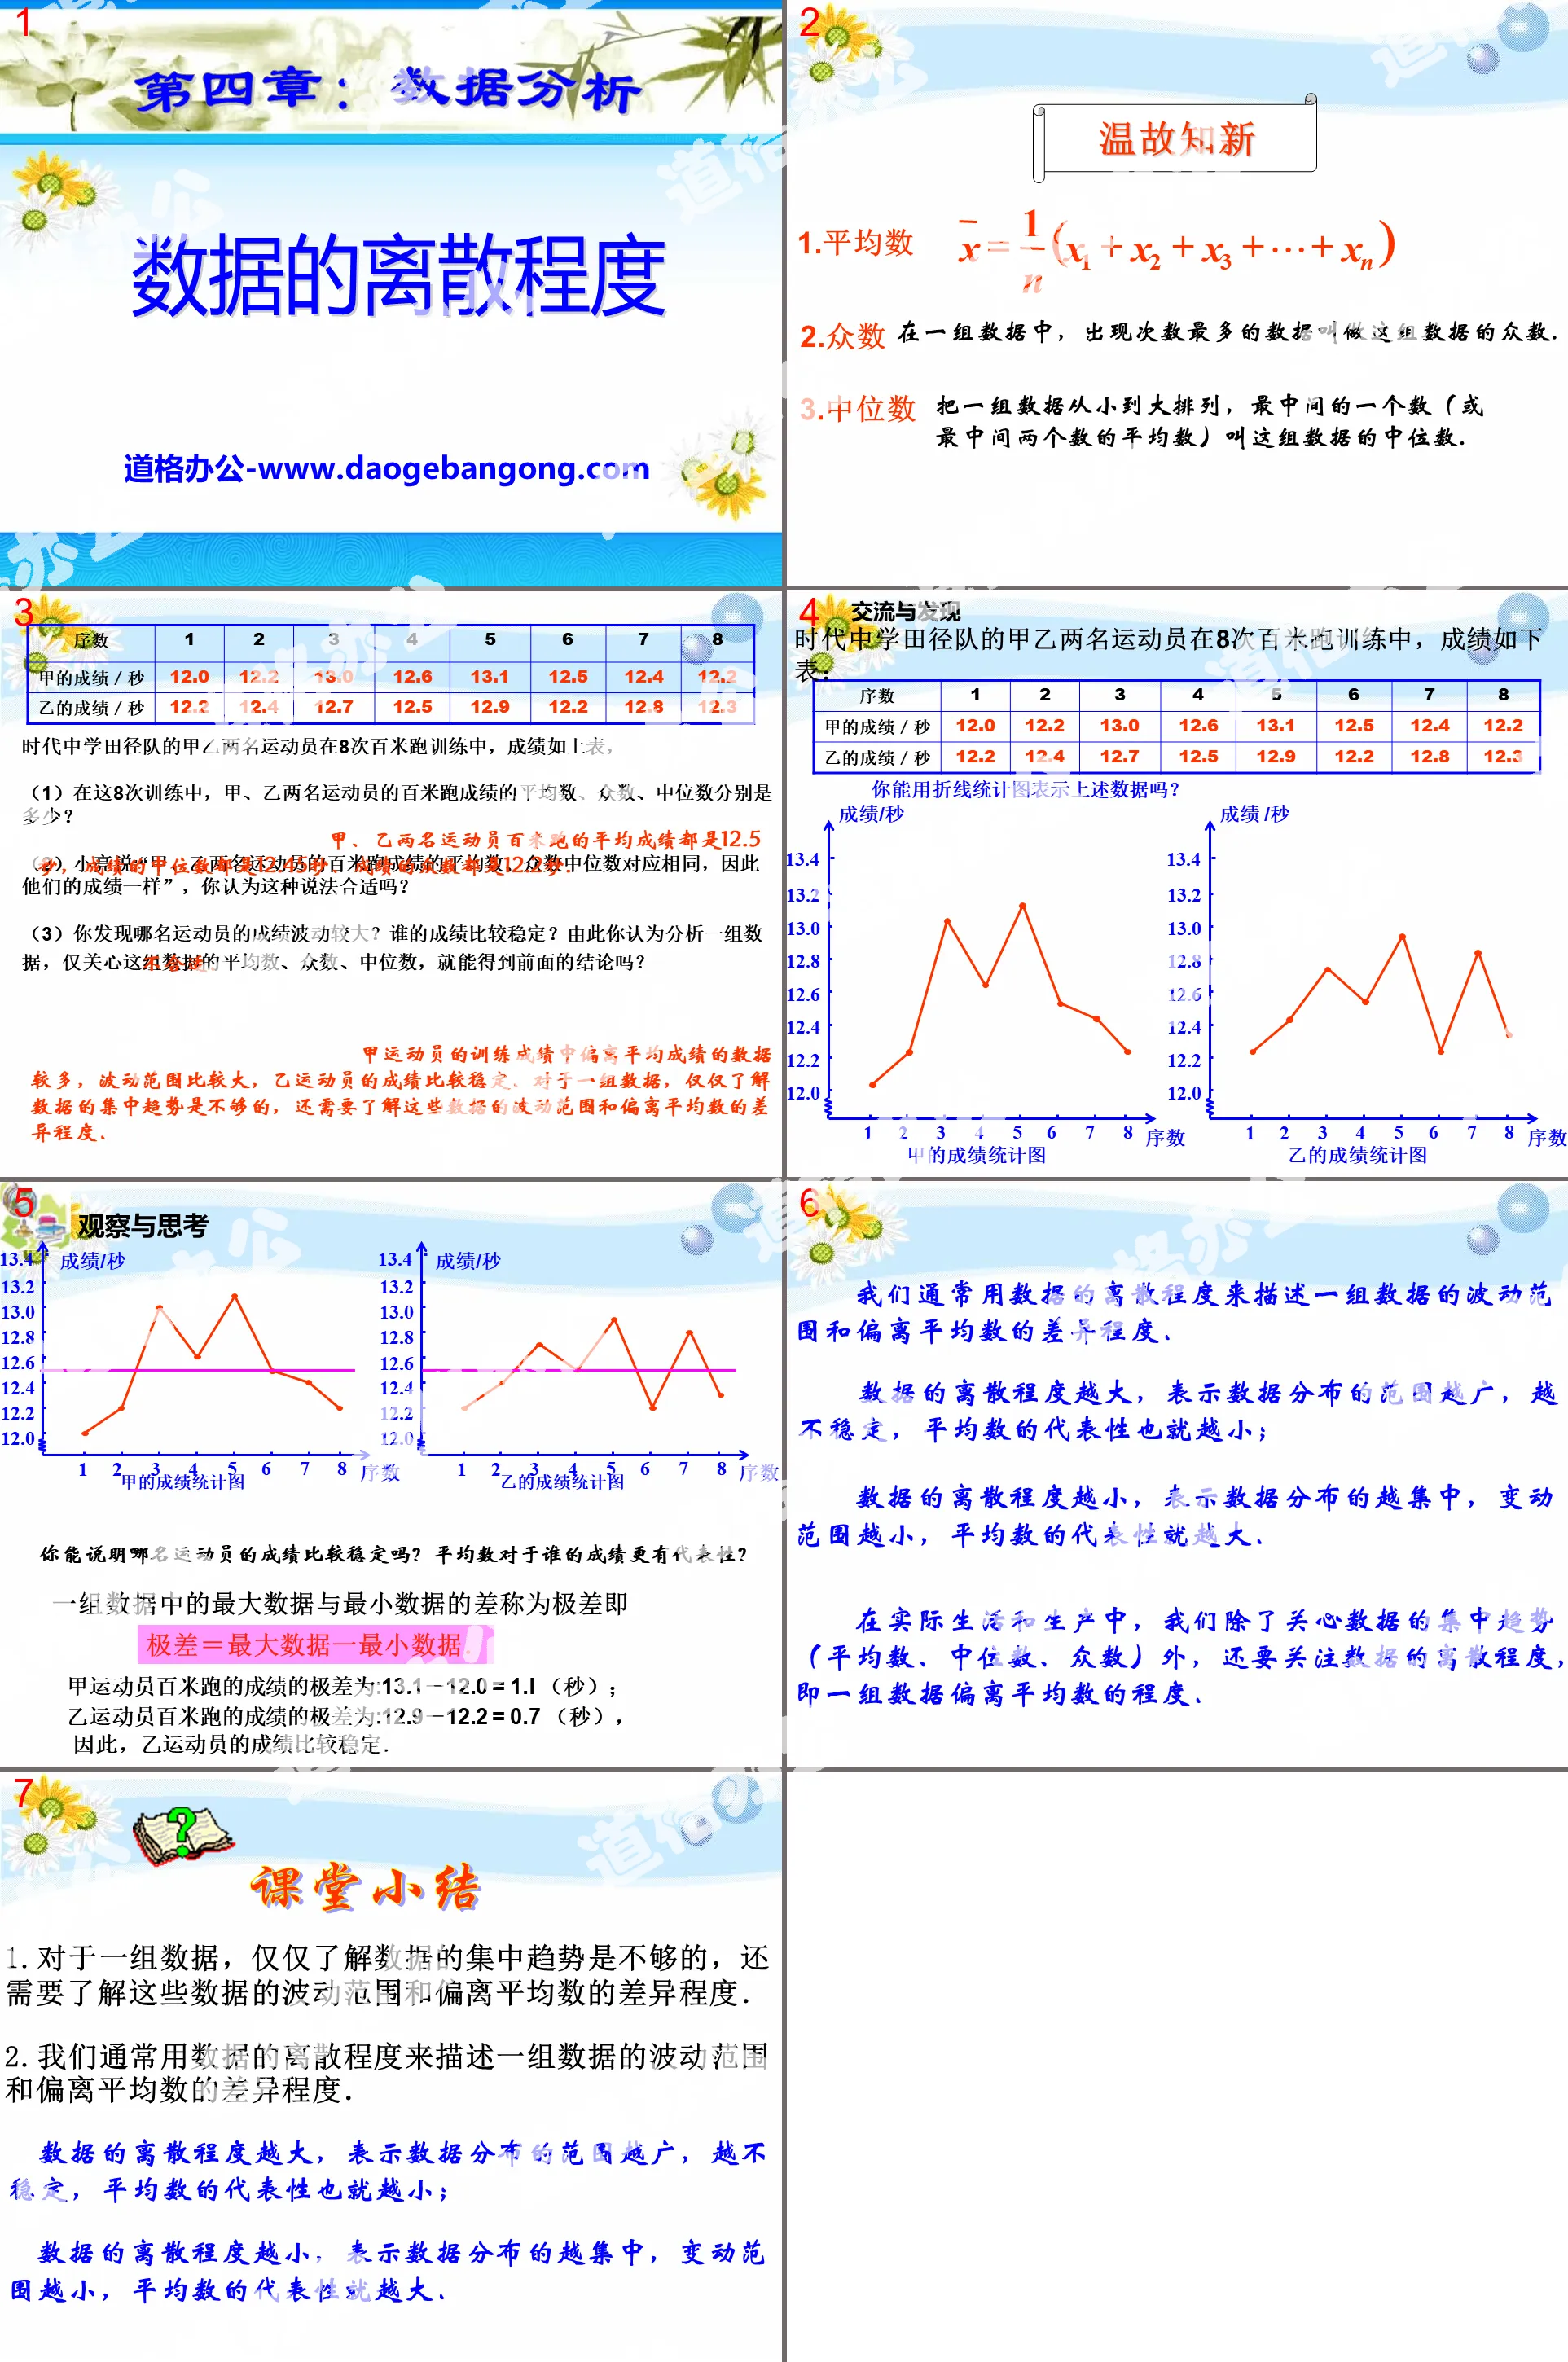
The results of the two athletes A and B of the Times Middle School track and field team in 8 100-meter run training are as shown in the table above.
(1) In these 8 training sessions, what are the average, mode, and median of the 100-meter running results of athletes A and B?
The average time of athletes A and B in the 100-meter run is both 12.5 seconds, the median time is 12.45 seconds, and the mode mode is 12.2 seconds.
(2) Xiao Liang said: "The average and mode median of the 100-meter running results of two athletes A and B are the same, so their results are the same." Do you think this statement is appropriate?
Not suitable.
(3) Which athlete's performance do you find has greater fluctuations? Whose results are more stable? From this, do you think that by analyzing a set of data and only caring about the mean, mode, and median of this set of data, you can get the previous conclusion?
Athlete A's training performance has more data that deviates from the average performance, and the fluctuation range is relatively large, while athlete B's performance is relatively stable. For a set of data, it is not enough to just understand the central tendency of the data. You also need to understand the fluctuation range of these data and the degree of deviation from the average.
The difference between the maximum data and the minimum data in a set of data is called the range, that is,
Range = maximum data - minimum data.
The range of athlete A’s 100-meter run is: 13.1-12.0 = 1.l (second);
The range of athlete B's 100-meter run is: 12.9-12.2 = 0.7 (seconds),
Therefore, athlete B's performance is relatively stable.
We usually use the degree of data dispersion to describe the fluctuation range of a set of data and the degree of difference from the average.
The greater the degree of dispersion of the data, the wider the range of the data distribution, the more unstable it is, and the less representative the average is;
The smaller the degree of discreteness of the data, the more concentrated the distribution of the data, the smaller the range of variation, and the greater the representativeness of the average.
In actual life and production, in addition to caring about the central tendency of the data (mean, median, mode), we also pay attention to the degree of dispersion of the data, that is, the degree to which a set of data deviates from the mean.
Class summary
1. For a set of data, it is not enough to only understand the central tendency of the data. You also need to understand the fluctuation range of these data and the degree of deviation from the average.
2. We usually use the degree of data dispersion to describe the fluctuation range of a set of data and the degree of difference from the average.
The greater the degree of dispersion of the data, the wider the range of the data distribution, the more unstable it is, and the less representative the average is;
The smaller the degree of discreteness of the data, the more concentrated the distribution of the data, the smaller the range of variation, and the greater the representativeness of the average.
Keywords: teaching courseware on the degree of dispersion of data, Qingdao edition eighth grade mathematics volume PPT courseware download, eighth grade mathematics slide courseware download, download of the dispersion degree of data PPT courseware, .PPT format;
For more information about the "Dispersion Degree of Data" PPT courseware, please click the Dispersion Degree of Data PPT tab.
"The Dispersion Degree of Data" Data Analysis PPT Teaching Courseware:
"The Dispersion Degree of Data" data analysis PPT teaching courseware, 14 pages in total. Part One: Knowledge Points Basic Knowledge Point 1 Range and Variance 1. The range of a set of data 15-20-1 is (C) A.5 B.6 C.7 D.8 2. A, B, C The four players, Ding and Ding each...
"Dispersion Degree of Data" Data Analysis PPT Download (Lesson 2):
"The Dispersion Degree of Data" Data Analysis PPT Download (Lesson 2), 12 pages in total. Part One: Type Analysis, Type, Comprehensive Application of Variance and Average 1. [2016 Inner Mongolia] A shooting team selects one person from two athletes A and B to participate in the national...
"The Dispersion Degree of Data" Data Analysis PPT Download (Lesson 1):
"The Dispersion Degree of Data" Data Analysis PPT Download (Lesson 1), 32 pages in total. Part One: Understanding New Knowledge Knowledge Points Very Poor In real life, in addition to caring about the central tendency of data, people often also pay attention to the degree of dispersion of data, that is, their relative...
File Info
Update Time: 2024-10-03
This template belongs to Mathematics courseware Qingdao Edition Eighth Grade Mathematics Volume 1 industry PPT template
"The Dispersion Degree of Data" PPT courseware Simple campus recruitment activity planning plan summary enterprise and institution recruitment publicity lecture PPT template is a general PPT template for business post competition provided by the manuscript PPT, simple campus recruitment activity planning plan summary enterprise and institution recruitment promotion Lecture PPT template, you can edit and modify the text and pictures in the source file by downloading the source file. If you want more exquisite business PPT templates, you can come to grid resource. Doug resource PPT, massive PPT template slide material download, we only make high-quality PPT templates!
Tips: If you open the template and feel that it is not suitable for all your needs, you can search for related content "The Dispersion Degree of Data" PPT courseware is enough.
How to use the Windows system template
Directly decompress the file and use it with office or wps
How to use the Mac system template
Directly decompress the file and use it Office or wps can be used
Related reading
For more detailed PPT-related tutorials and font tutorials, you can view: Click to see
How to create a high-quality technological sense PPT? 4 ways to share the bottom of the box
Notice
Do not download in WeChat, Zhihu, QQ, built-in browsers, please use mobile browsers to download! If you are a mobile phone user, please download it on your computer!
1. The manuscript PPT is only for study and reference, please delete it 24 hours after downloading.
2. If the resource involves your legitimate rights and interests, delete it immediately.
3. Contact information: service@daogebangong.com
"The Dispersion Degree of Data" PPT courseware, due to usage restrictions, it is only for personal study and reference use. For commercial use, please go to the relevant official website for authorization.
(Personal non-commercial use refers to the use of this font to complete the display of personal works, including but not limited to the design of personal papers, resumes, etc.)
Preview
Related Search:
"The Dispersion Degree of Data" PPT courseware
2024-10-03
Copyright statement: This material is compiled and released by the user of Daoge Resources. The copyright belongs to the author. For commercial use, please contact the copyright owner. If there is any infringement, please contact the webmaster to remove the resource.
Download Points: 0.00
Free Download
Upgrade VIP
Favorite
Views: 2246 / Downloads: 131


