| Category | Format | Size |
|---|---|---|
| People's Education High School Mathematics Edition A Compulsory Course 2 | pptx | 6 MB |

"Using Samples to Estimate the Population" Statistics PPT Courseware (Estimation of Population Percentiles)
Description
"Using Samples to Estimate the Population" Statistics PPT Courseware (Estimation of Population Percentiles)
Part One: Content Standards
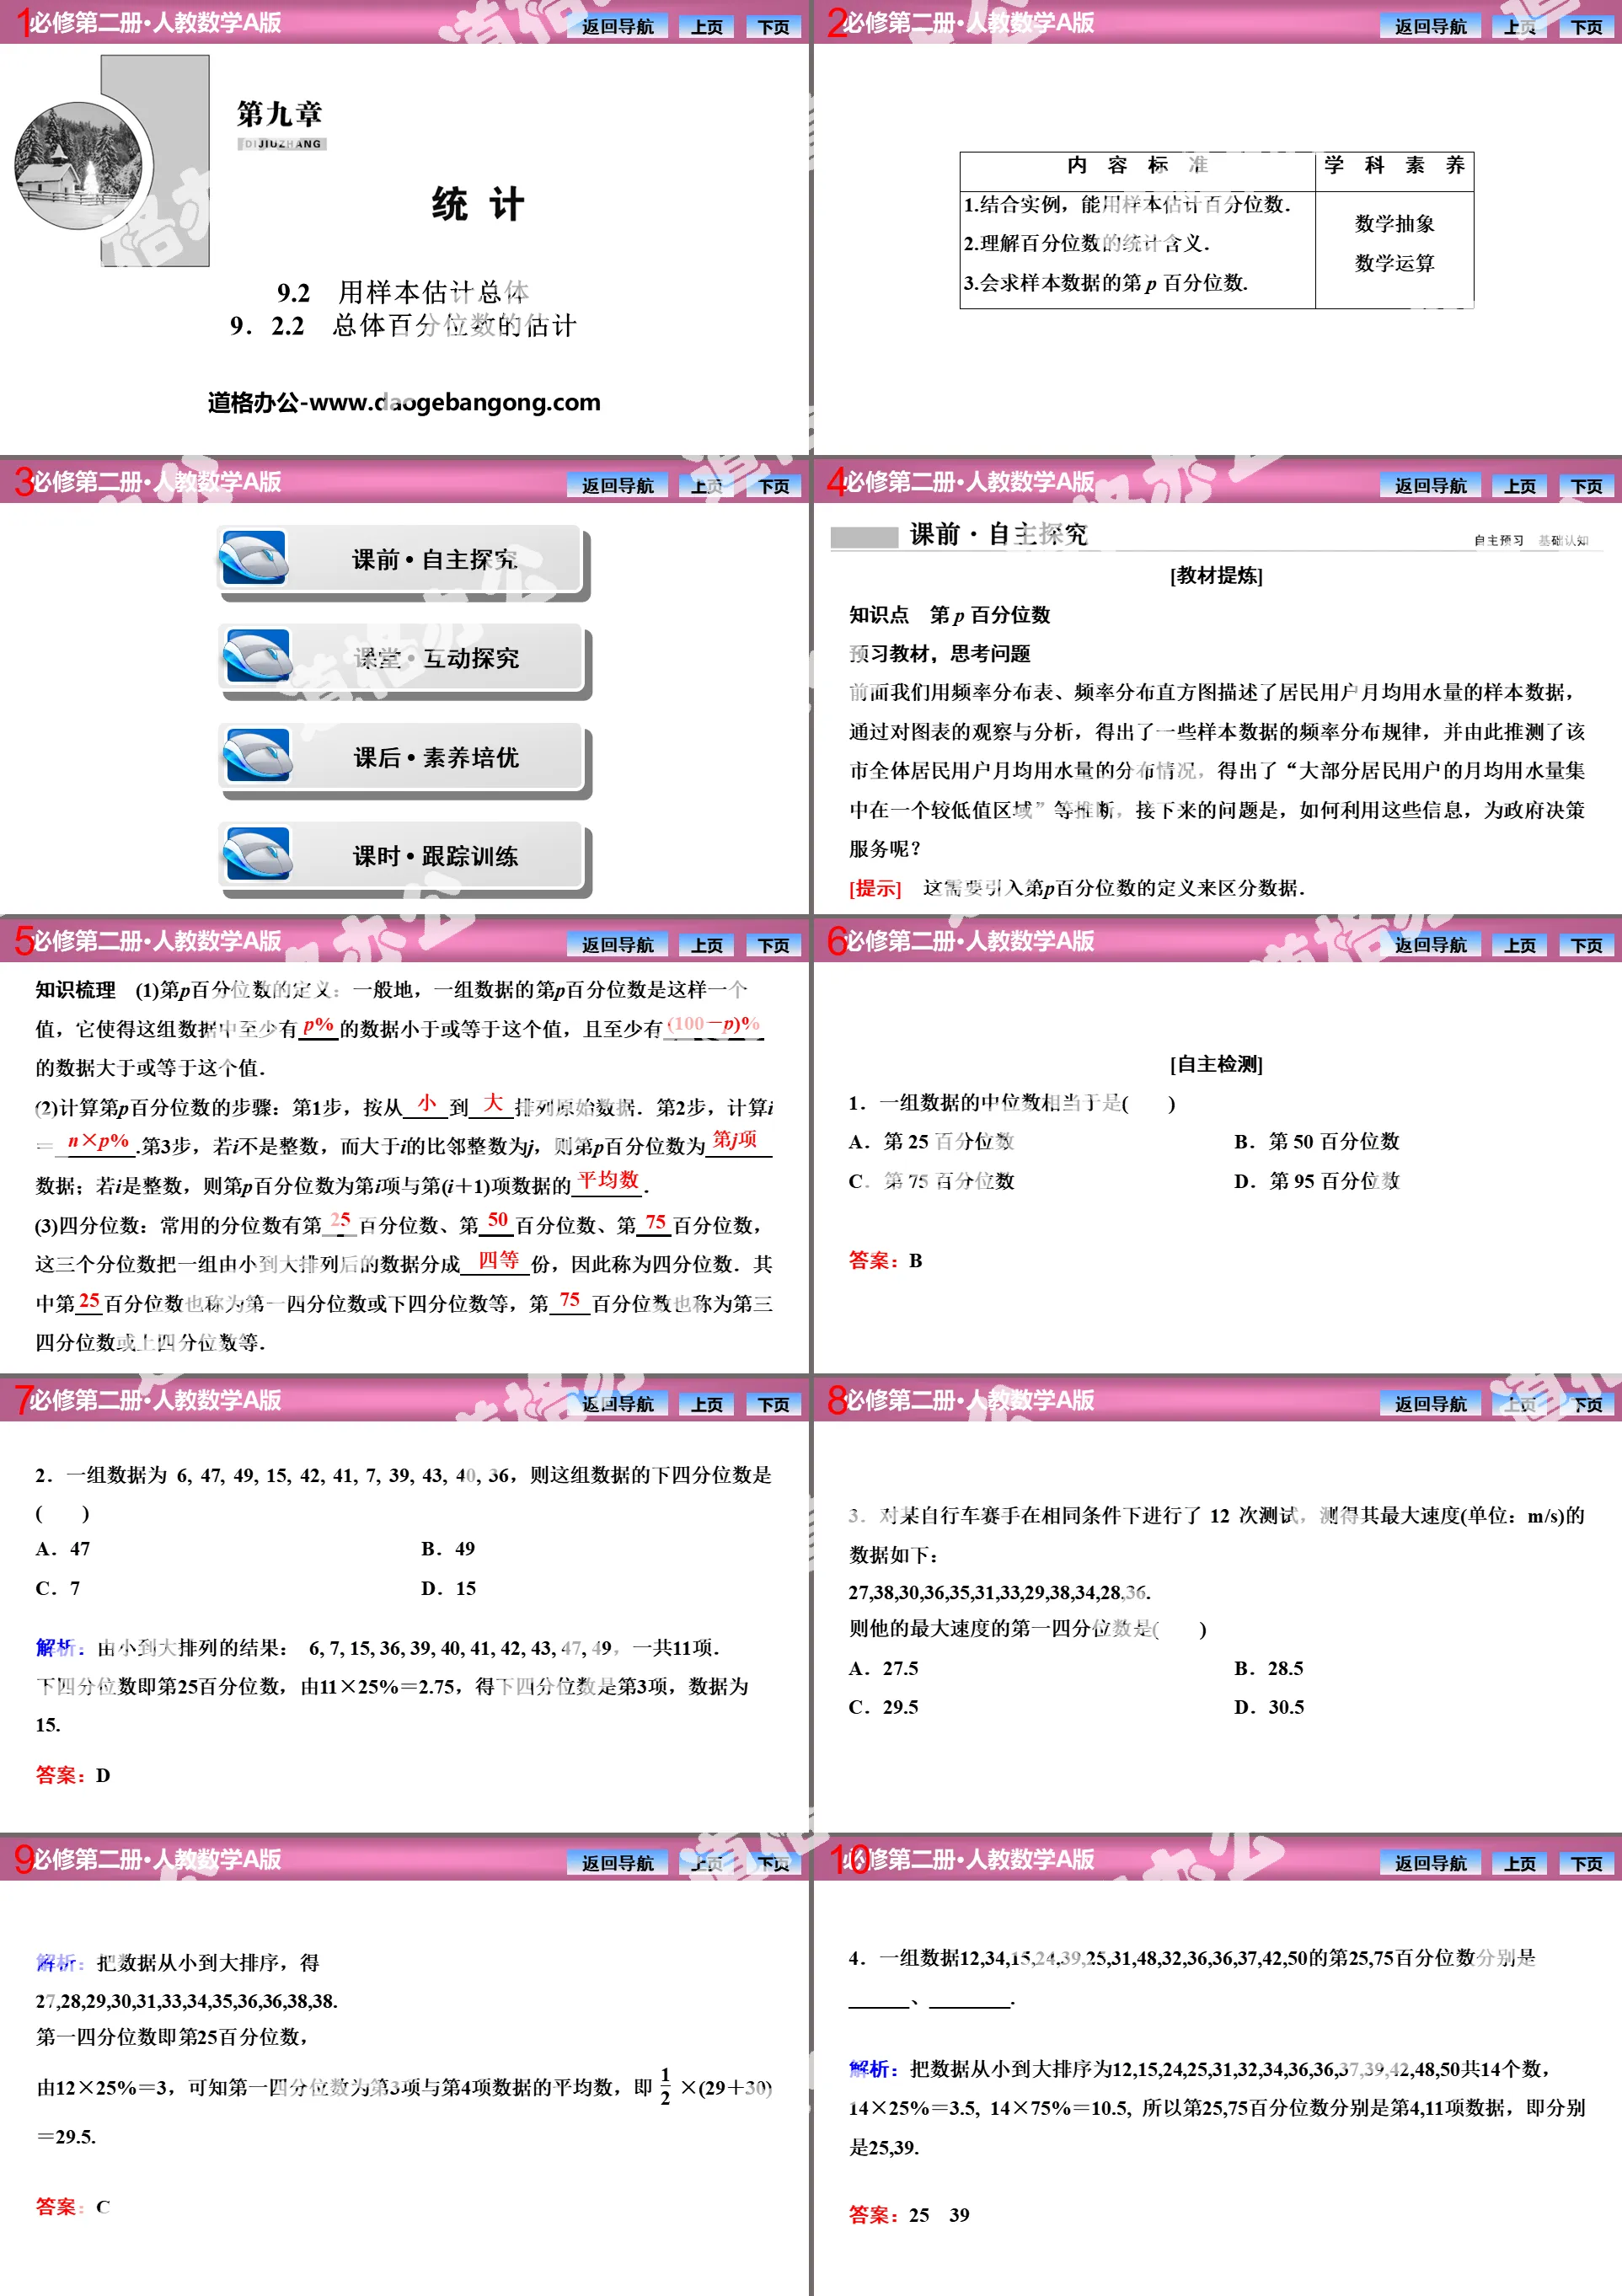
1. Combined with examples, the percentile can be estimated using samples.
2. Understand the statistical meaning of percentiles.
3. Can find the p-th percentile of sample data.
Estimating the population using samples PPT, Part 2 content: Before class • Independent exploration
[Textbook Extraction]
Knowledge point p-th percentile
Preview the teaching materials and think about the questions
Earlier, we used frequency distribution tables and frequency distribution histograms to describe the sample data of monthly average water consumption of residential users. Through observation and analysis of the charts, we obtained the frequency distribution patterns of some sample data, and from this we speculated on the overall water consumption of the city. The distribution of average monthly water consumption of residential users has led to inferences such as "the average monthly water consumption of most residential users is concentrated in a lower value area". The next question is, how to use this information to serve government decision-making? ?
[Autonomous detection]
1. The median of a set of data is equivalent to ()
A. 25th percentile B. 50th percentile
C. 75th percentile D. 95th percentile
2. A set of data is 6, 47, 49, 15, 42, 41, 7, 39, 43, 40, 36, then the lower quartile of this set of data is ()
A. 47 B. 49
C. 7D. 15
3. A bicycle racer was tested 12 times under the same conditions, and the measured maximum speed (unit: m/s) was as follows:
27,38,30,36,35,31,33,29,38,34,28,36.
Then the first quartile of his maximum speed is ()
A. 27.5 B. 28.5
C. 29.5 D. 30.5
Estimating the population using samples PPT, Part 3: Classroom • Interactive exploration
Explore the application of percentiles in specific data
[Example 1] A middle school selected 30 boys from the first grade of high school and measured their weight. The data are as follows (unit: kilogram):
62 60 59 59 59 58 58 57 57 57
56 56 56 56 56 56 55 55 55 54
54 54 53 53 52 52 51 50 49 48
(1) Find the 25% and 75% percentiles of the weight of these 30 boys;
(2) Estimate the 80th percentile weight of first-year high school boys in our school.
method promotion
Steps to calculate the p percentile: (1) Arrange the original data from small to large. (2) Calculate i = n×p%. (3) If i is not an integer, and the adjacent integer greater than i is j, then the p-th percentile is the j-th data; if i is an integer, then the p-th percentile The quantile is the average of the i-th item and (i+1)-th item data.
Explore the application of second percentiles in statistical tables or charts
[Example 2] A middle school held a computer knowledge competition. The scores of the participating students in the first grade of high school were sorted and divided into five groups and drawn into a frequency distribution histogram as shown in the figure.
Estimated 25% and 90% percentiles of participating students’ scores.
Using samples to estimate the overall PPT, Part 4: After-school • Quality development
The geometric significance of percentiles in frequency distribution histograms
Intuitive imagination, data analysis, mathematical operations
[Typical Example] Our country is a country with serious water shortage in the world. In order to encourage residents to save water, a certain municipal government plans to adjust the residential water charging plan and formulate a reasonable monthly water consumption standard x (tons). A resident's monthly water consumption does not exceed x and is charged at the flat price, while the portion exceeding x is charged at the negotiated price. In order to understand the water consumption situation of residents, through sampling, the average monthly water consumption (unit: tons) of 100 residents in a certain year was obtained. The data were divided into ..., [4,4.5) were divided into 9 groups, and the frequency distribution histogram as shown in the figure was made.
(1) Find the value of a in the histogram.
(2) Assume that the city has 300,000 residents. Estimate the number of residents in the city who consume no less than 3 tons of water per month on average, and explain the reasons.
(3) If the municipal government hopes that the monthly water consumption of 85% of residents will not exceed the standard x (tons), estimate the value of x and explain the reasons.
Keywords: Free download of PPT courseware for high school People's Education A version of Mathematics compulsory course II, using samples to estimate the population PPT download, statistics PPT download, population percentile estimation PPT download, .PPT format;
For more information about the PPT courseware "Statistics Estimating Population Percentiles Using Samples", please click the Statistics PPT Estimating Populations Using Samples PPT Estimation of Population Percentiles PPT tag.
"Using Samples to Estimate the Population" Statistics PPT Courseware (Estimation of the Dispersion Degree of a Population):
"Using Samples to Estimate the Population" Statistics PPT Courseware (Estimation of the Dispersion Degree of the Population) Part One: Content Standards 1. Combined with examples, be able to use samples to estimate the dispersion parameters (standard deviation, variance, range) of the population. 2. Be able to find the variance, standard deviation, and extreme of sample data..
"Using Samples to Estimate the Population" Statistics PPT Courseware (Estimation of Population Central Tendency):
"Using Samples to Estimate the Population" Statistics PPT Courseware (Estimation of the Central Tendency of the Population) Part One Content: Content Standards 1. Combined with examples, be able to use samples to estimate the central tendency parameters (mean, median, mode) of the population. 2. Able to find the mean and median of sample data..
"Using Samples to Estimate the Population" Statistics PPT Courseware (Estimation of Population Value Rules):
"Using Samples to Estimate the Population" Statistics PPT Courseware (Estimation of the Population Value Regularity) Part One: Content Standards 1. Combined with examples, be able to use samples to estimate the population value regularity. 2. Be able to make frequency distribution tables and draw frequency distribution histograms. 3. Can be based on frequency distribution table..
File Info
Update Time: 2024-07-04
This template belongs to Mathematics courseware People's Education High School Mathematics Edition A Compulsory Course 2 industry PPT template
"Using Samples to Estimate the Population" Statistics PPT Courseware (Estimation of Population Percentiles) Simple campus recruitment activity planning plan summary enterprise and institution recruitment publicity lecture PPT template is a general PPT template for business post competition provided by the manuscript PPT, simple campus recruitment activity planning plan summary enterprise and institution recruitment promotion Lecture PPT template, you can edit and modify the text and pictures in the source file by downloading the source file. If you want more exquisite business PPT templates, you can come to grid resource. Doug resource PPT, massive PPT template slide material download, we only make high-quality PPT templates!
Tips: If you open the template and feel that it is not suitable for all your needs, you can search for related content "Using Samples to Estimate the Population" Statistics PPT Courseware (Estimation of Population Percentiles) is enough.
How to use the Windows system template
Directly decompress the file and use it with office or wps
How to use the Mac system template
Directly decompress the file and use it Office or wps can be used
Related reading
For more detailed PPT-related tutorials and font tutorials, you can view: Click to see
How to create a high-quality technological sense PPT? 4 ways to share the bottom of the box
Notice
Do not download in WeChat, Zhihu, QQ, built-in browsers, please use mobile browsers to download! If you are a mobile phone user, please download it on your computer!
1. The manuscript PPT is only for study and reference, please delete it 24 hours after downloading.
2. If the resource involves your legitimate rights and interests, delete it immediately.
3. Contact information: service@daogebangong.com
"Using Samples to Estimate the Population" Statistics PPT Courseware (Estimation of Population Percentiles), due to usage restrictions, it is only for personal study and reference use. For commercial use, please go to the relevant official website for authorization.
(Personal non-commercial use refers to the use of this font to complete the display of personal works, including but not limited to the design of personal papers, resumes, etc.)
Preview
Related Search: