Some time ago, a reader asked how to optimize pages with cyclic relationships:

Live broadcast, because Time is limited, so,I simply drew a sketch and shared some loop shapes Drawing skills:
But I always feel that, Didn't make it very clear.
So , this article will specifically talk about how to optimize pages with circular relationships?
Let’s talk about it first , when it comes to cycle diagrams, I believe that many people can do it. It is nothing more than drawing a circle. Well. Like this:


It is indeed true It's very simple, but if you want to do it well, you need to master some creative ideas:

OK Now, how to make a creative PPT loop graphic?
We can start from here Think in three aspects:

What does it mean? Let me explain it to you one by one.
First Let’s talk about loop styles
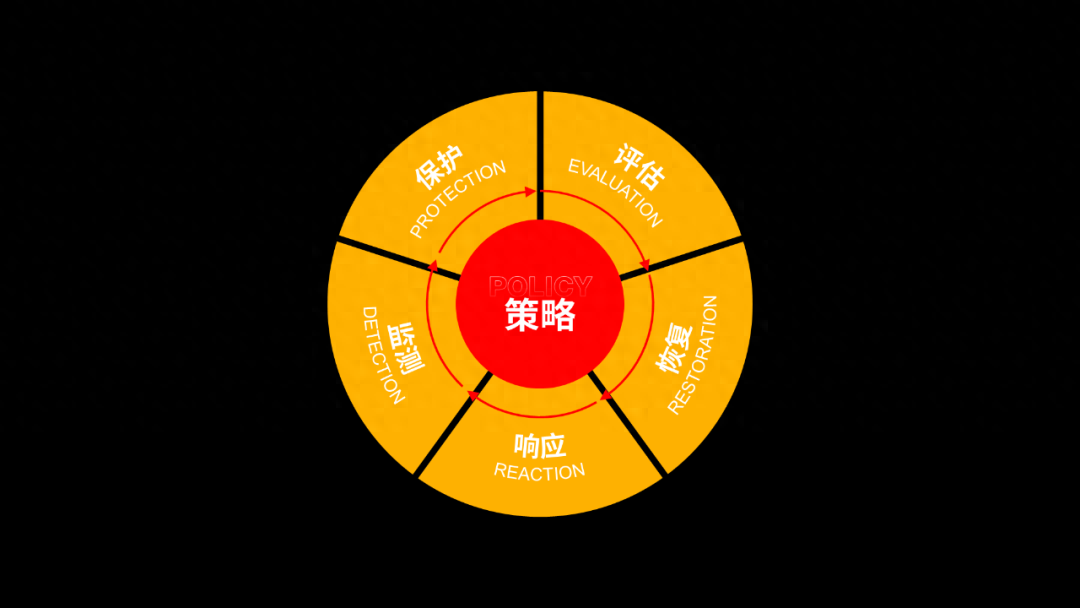
In other words, What does the logical diagram of the entire circular relationship look like? Generally speaking, it can be divided into three types:
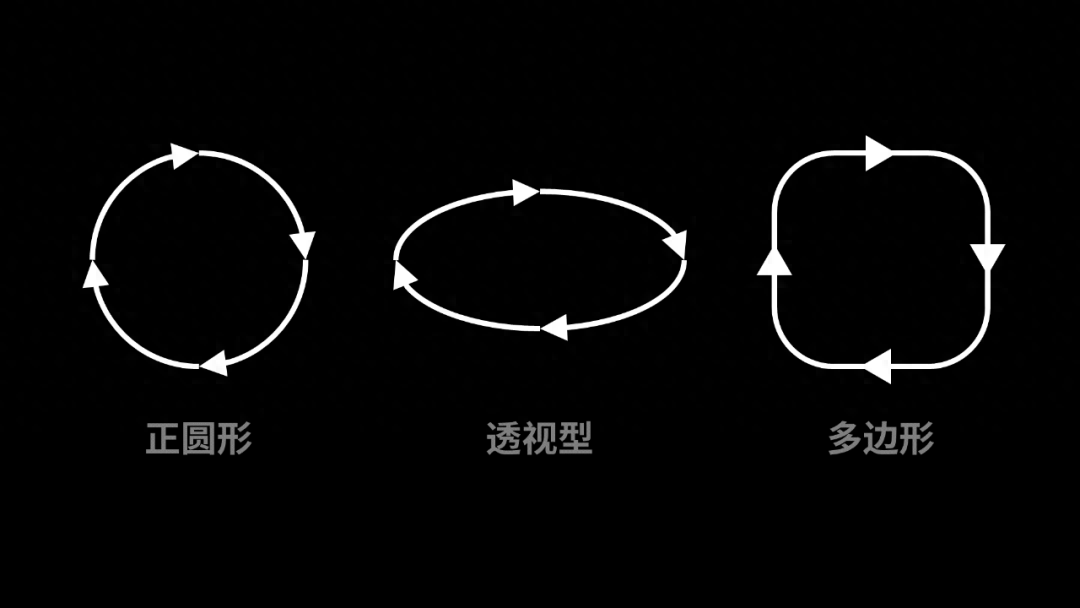
The most commonly used is Perfect circle:

But if you insert a loop After the picture, both sides of the PPT page are very empty. We can also change it to perspective:

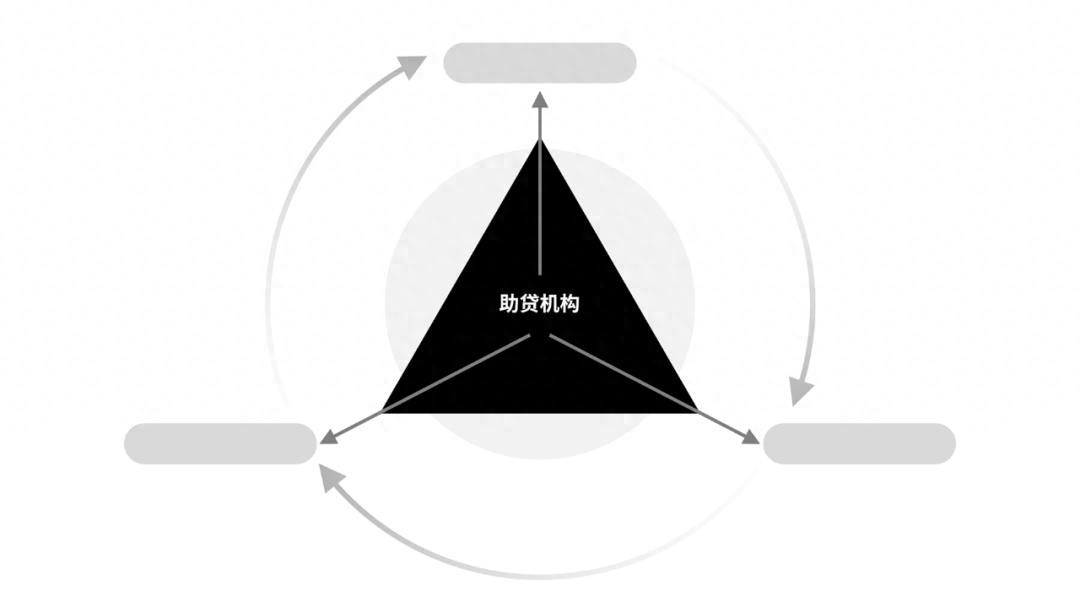
Of course, it’s okay Use this polygonal loop style as long as it shows the loop flow:
Come again Talk about line styles
For circular relationships, We generally use some arrows to express a sense of progression.
Generally speaking, You can use these 3 types:
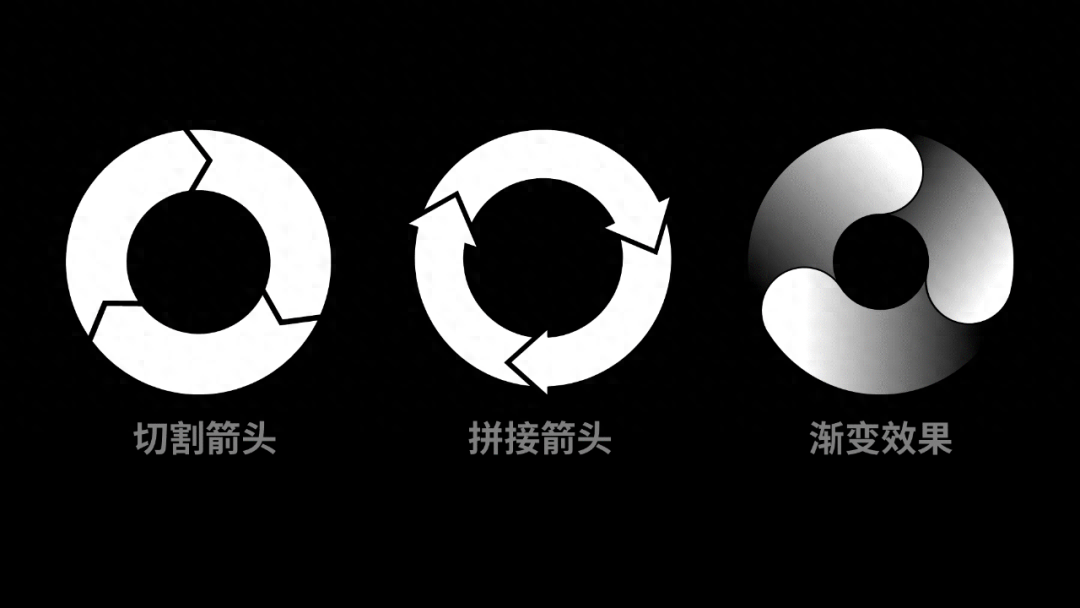
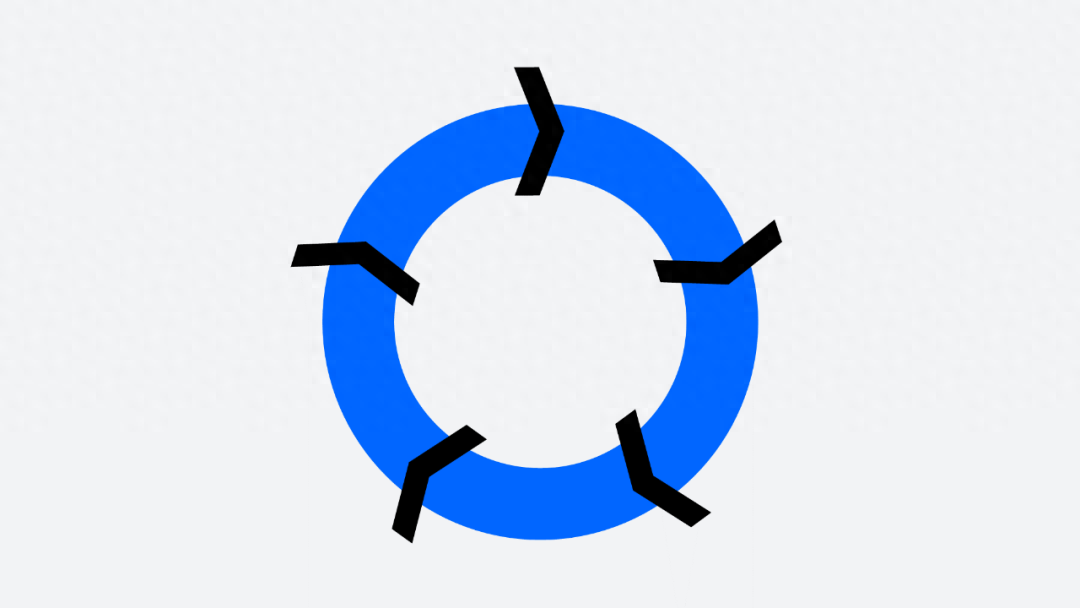
For example, like this Page is a typical cutting arrow:

And this kind of arrow The style is obtained by cutting out rings and V-shaped arrows:
Finally Is the visual level
For the first two Many people can think of this, but the cyclic relationship is still very monotonous. The main reason is stuck at this step.
How What about enhancing the visual hierarchy of loop graphics?
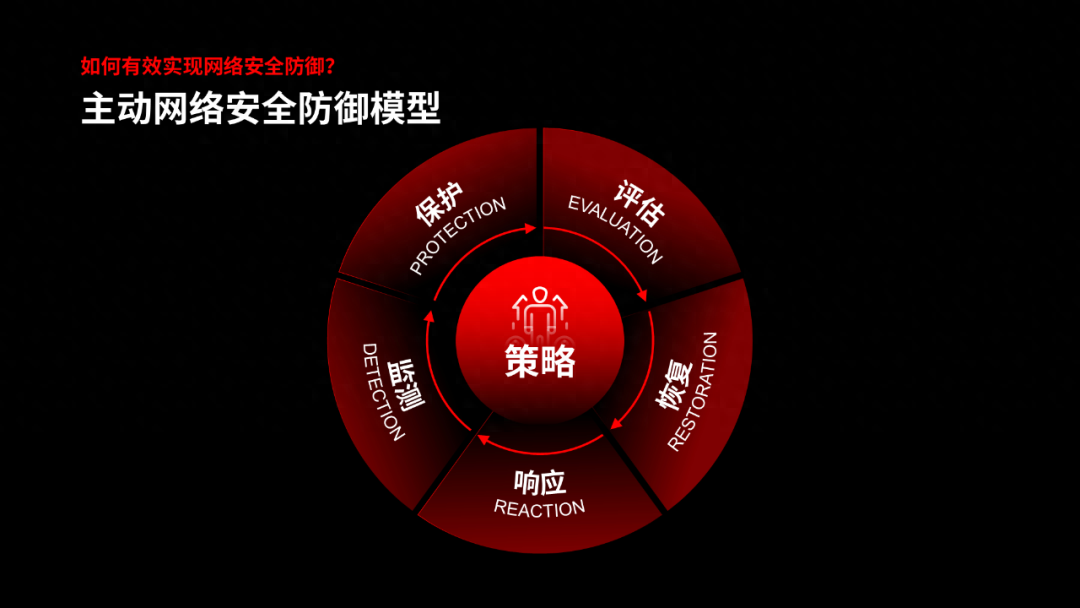
We can put different The lines and color blocks of the style can be superimposed:
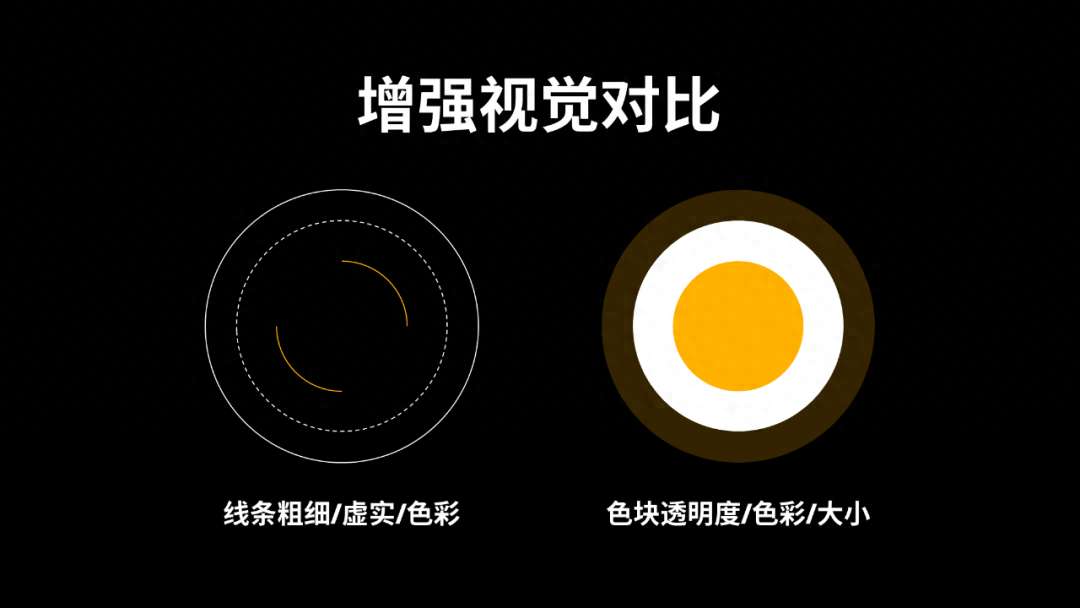
For example, like these two The graphics are all cyclic relationships. Obviously, the visual layering on the right is stronger:
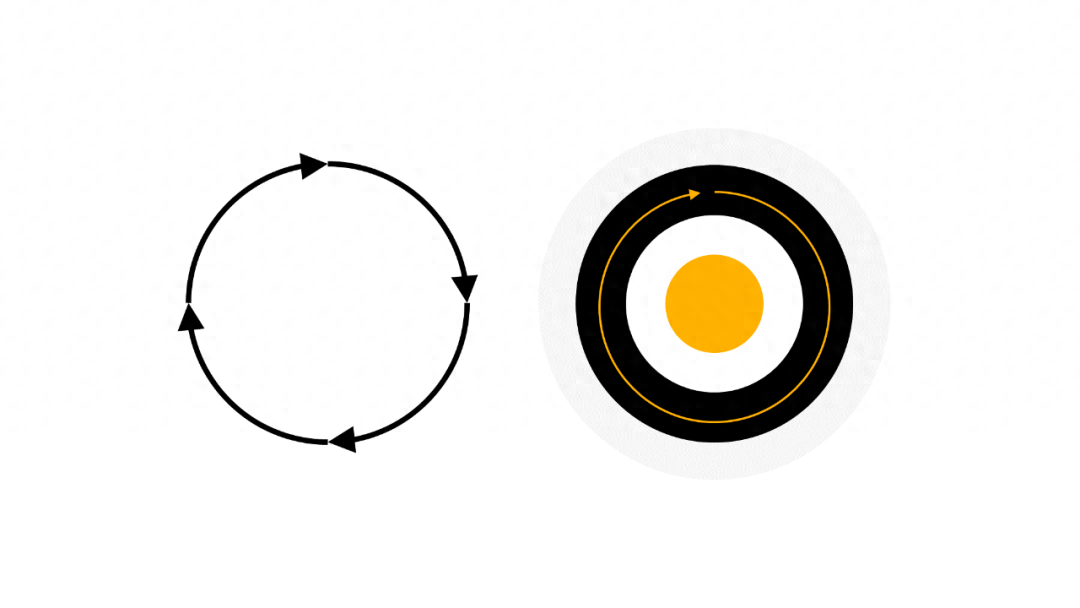
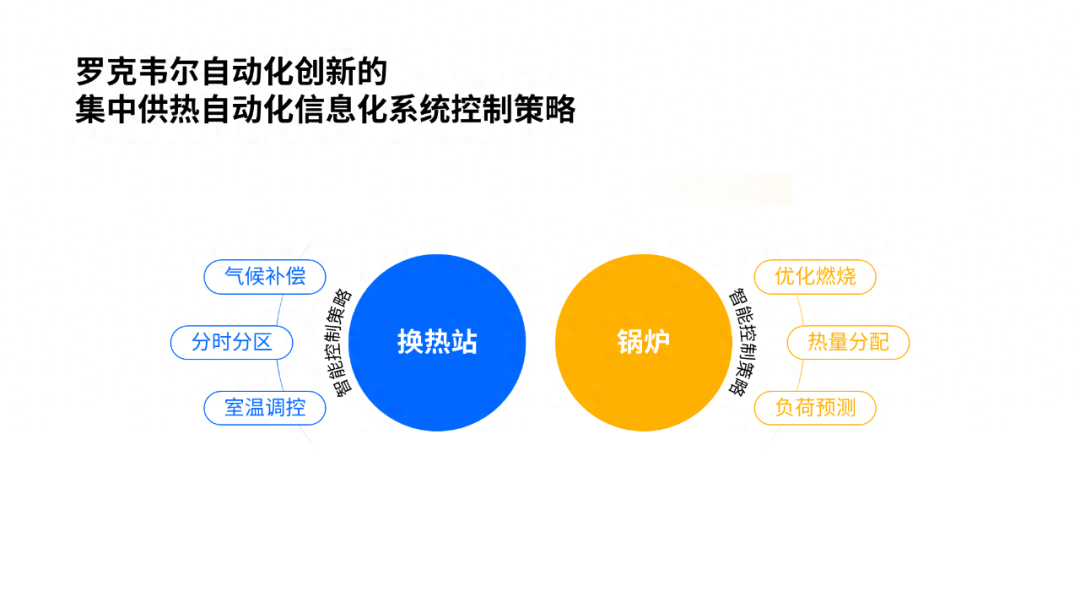
To help everyone understand For these three points, let’s first look at a simple case:

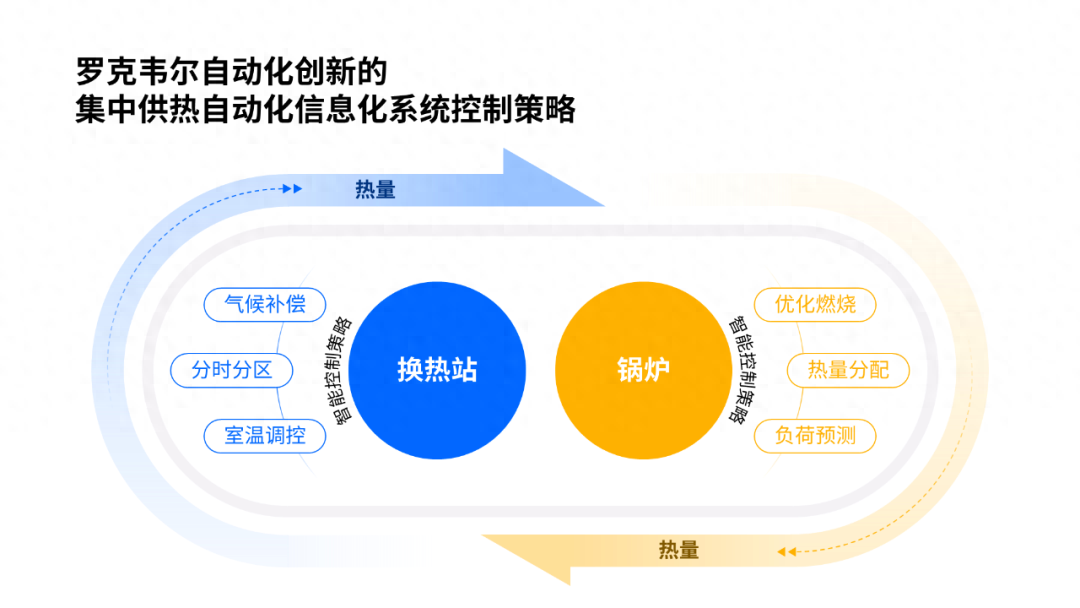
How to optimize ? Using what we said earlier, we can usethe circular style of the perfect circle, and add some to the lines. Gradient, shows a sense of flow:
Other than that ,We can also use a perfect circle, the lines adopt the style of cutting arrows, and add a gradient effect :
here here We can be very creative with the combination of methods.
Wait until this is completed After logical graphics and simple typesetting, you can easily create a page like this:

Connect Next, in order to let everyone master this method more skillfully, let's look at two more examples.
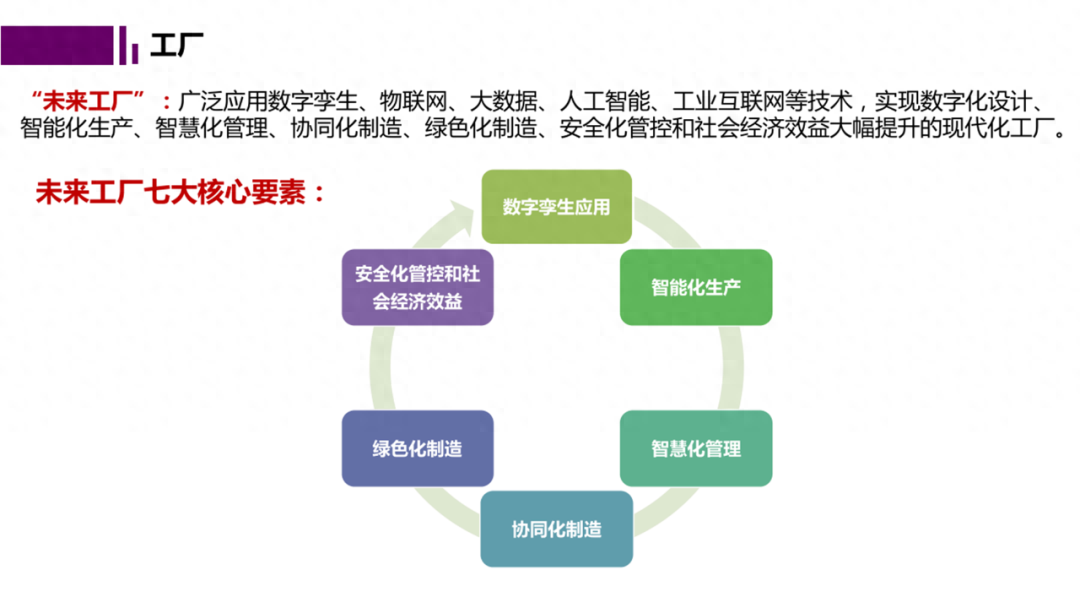
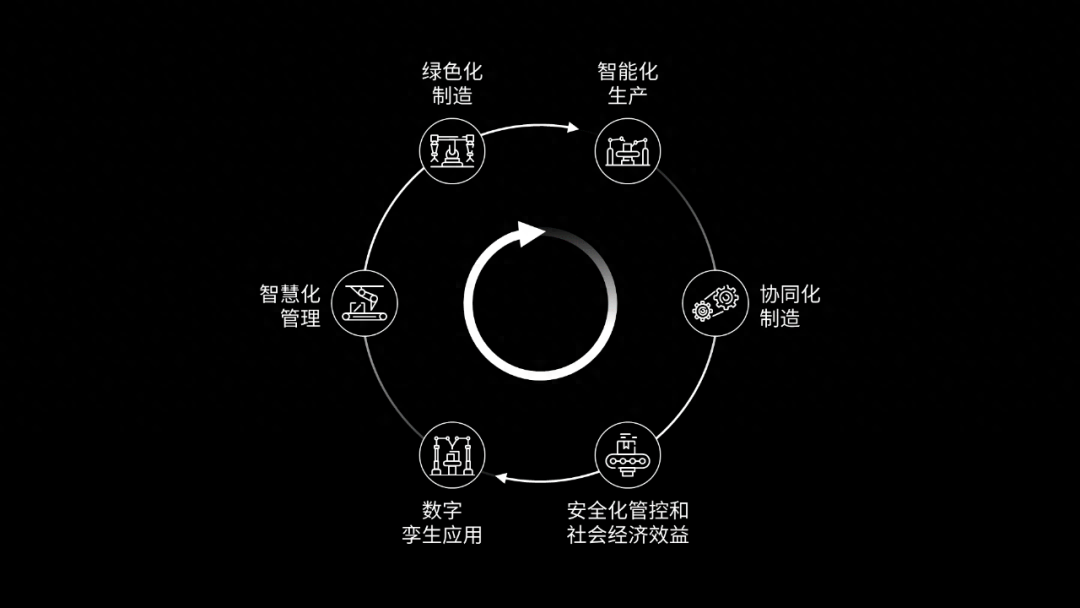
Let’s take a look at one first Simple page:
This It is a very typical page that is monotonous and lacks a sense of hierarchy. How to optimize?
We use perfect circles First, let’s simply present the logical relationship:
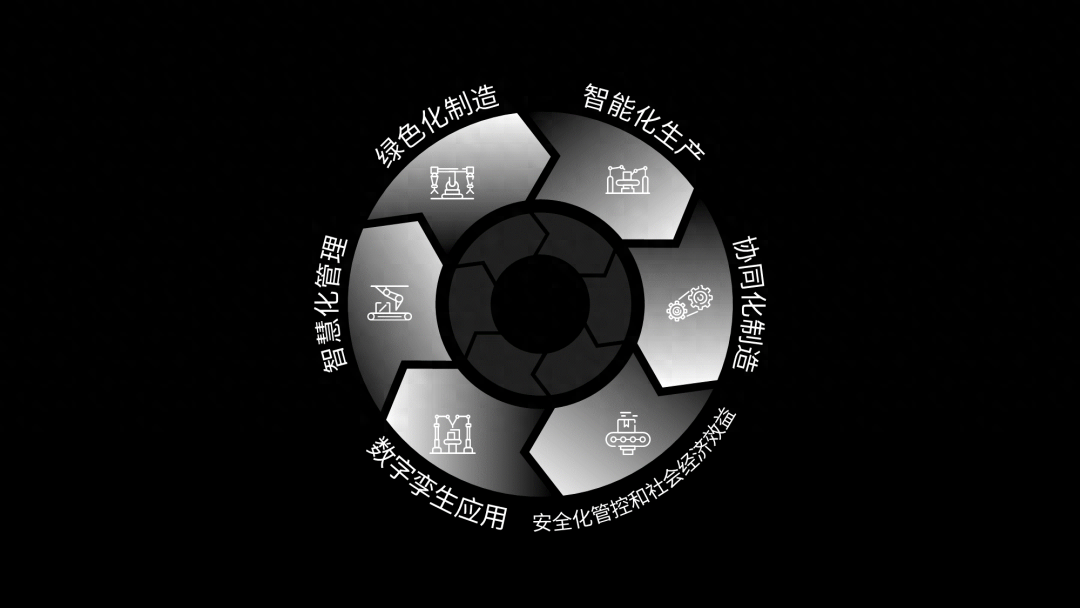
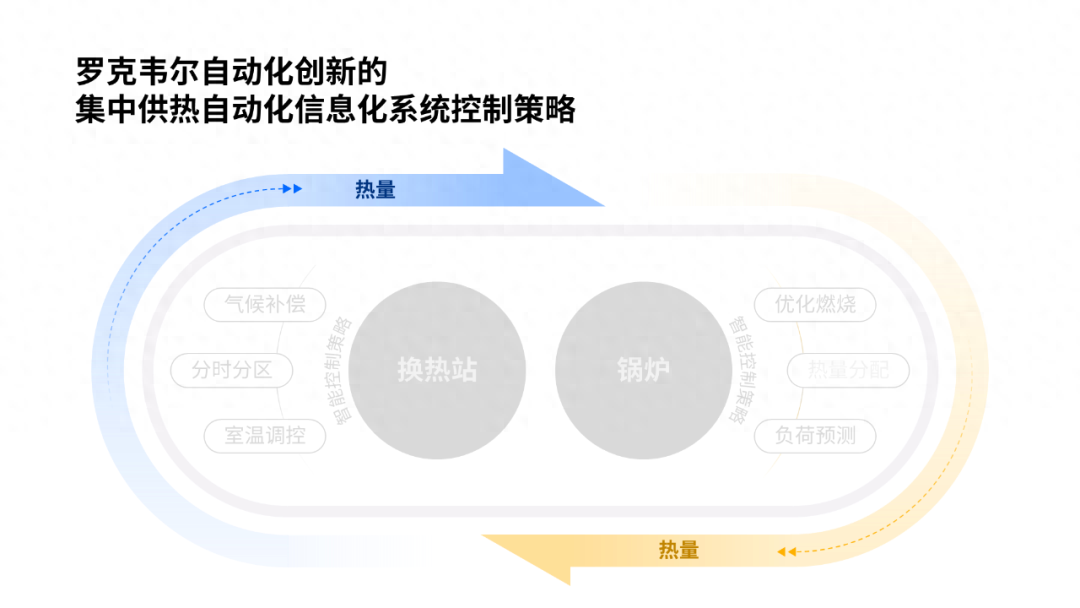
Next, for To enrich the visual hierarchy of the page, we can add color blocks at the bottom of the text:
Adjust another gradient Color to make it more consistent with the style of the theme:
Still a bit monotonous ,We can add some radar-type fan blades, which can not only enrich the visual effect, but also integrate with the page Content association:

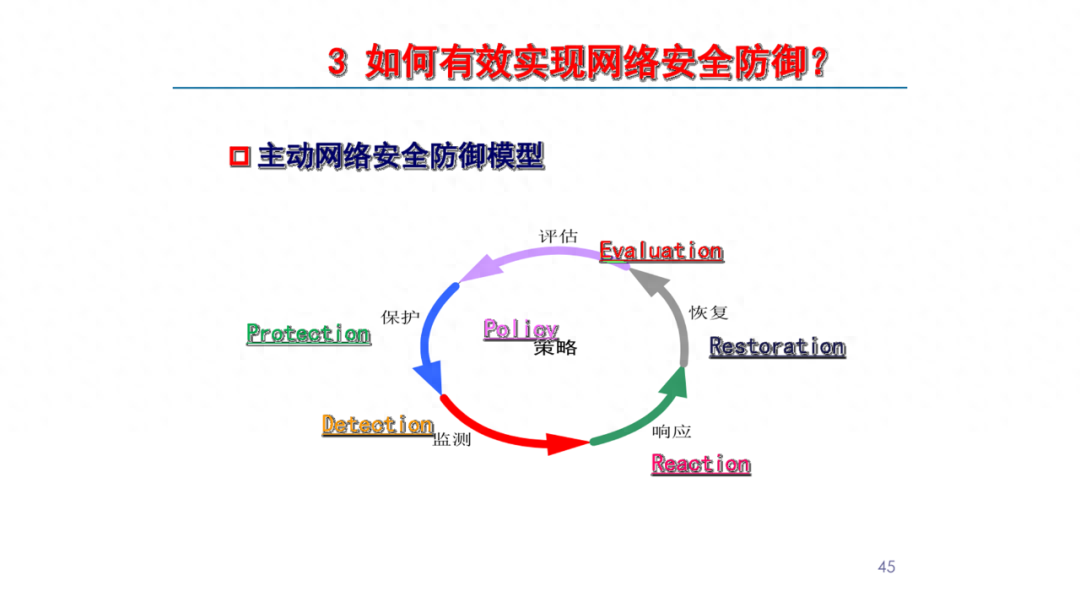
Let’s look at the second one Pages:
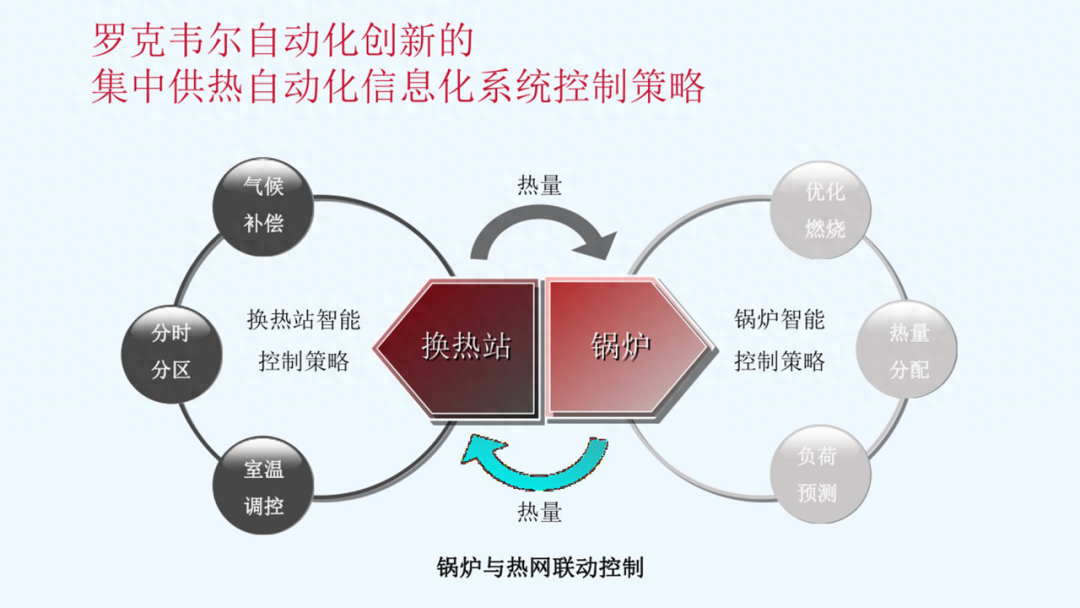
The logic of this page The relationship seems a bit complicated. It doesn't matter, just do it bit by bit.
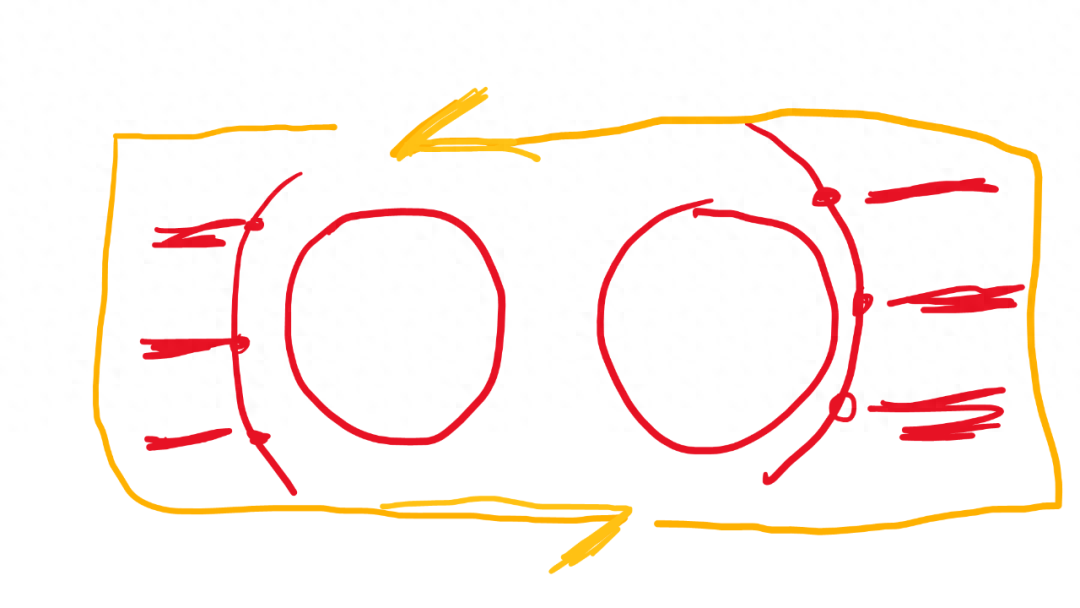
Page The information above is divided into two large blocks, which is a cyclic relationship, and each block is divided into three small dots.
I simply drew it A sketch showing this logical relationship:
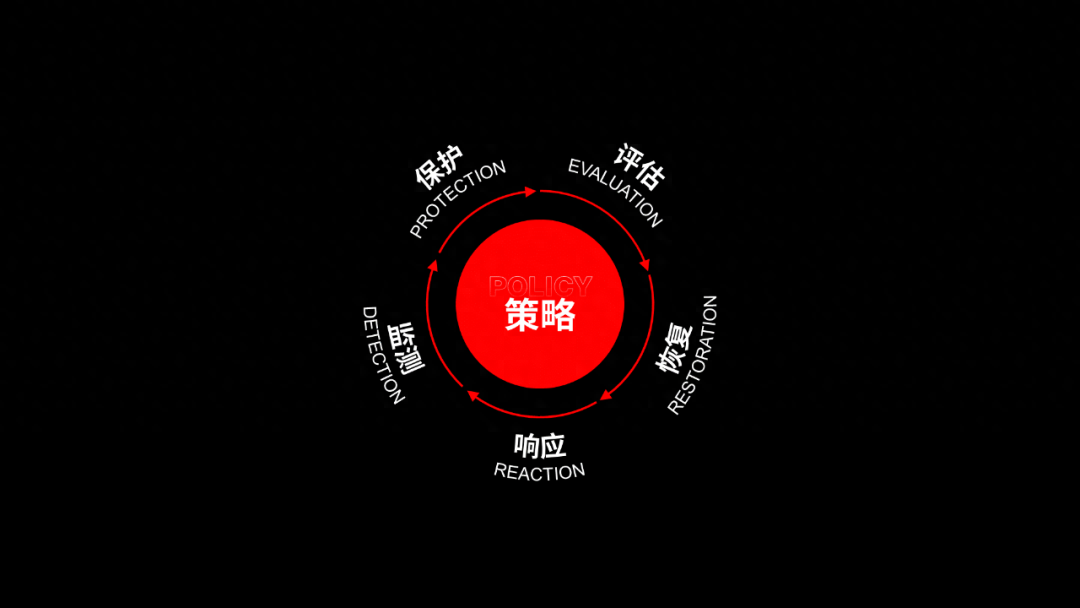
Next, we First, draw the hierarchical relationship between the content:
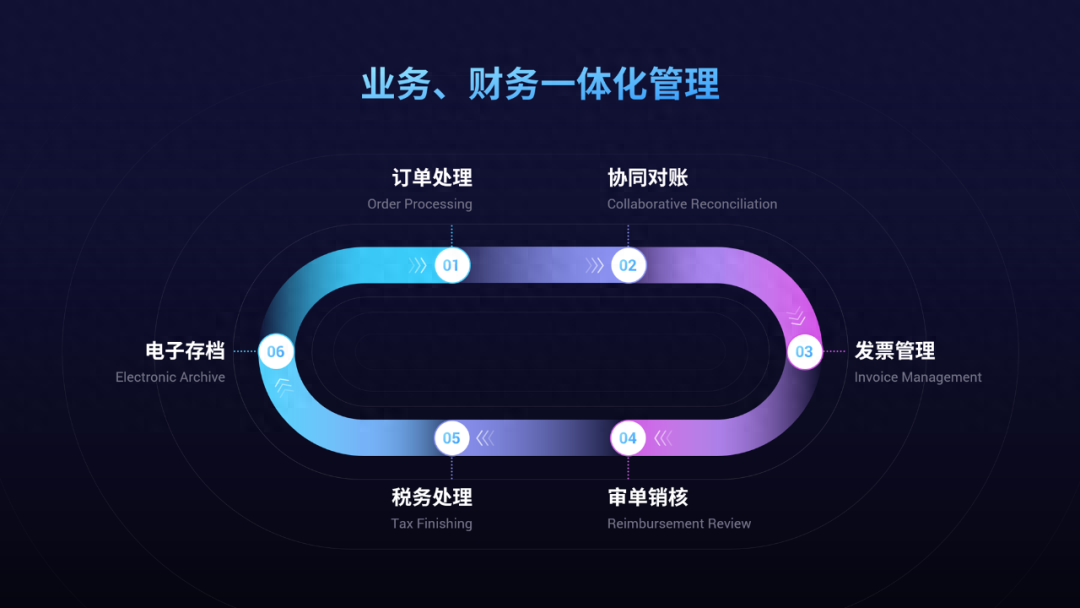
And the two plates It is a cyclic relationship, so,We can make a rounded rectangle cyclic style, and Lines using gradient effects:
Here is a brief introduction , how is this arrow drawn?
Very simple, a few Just stitch the graphics together:

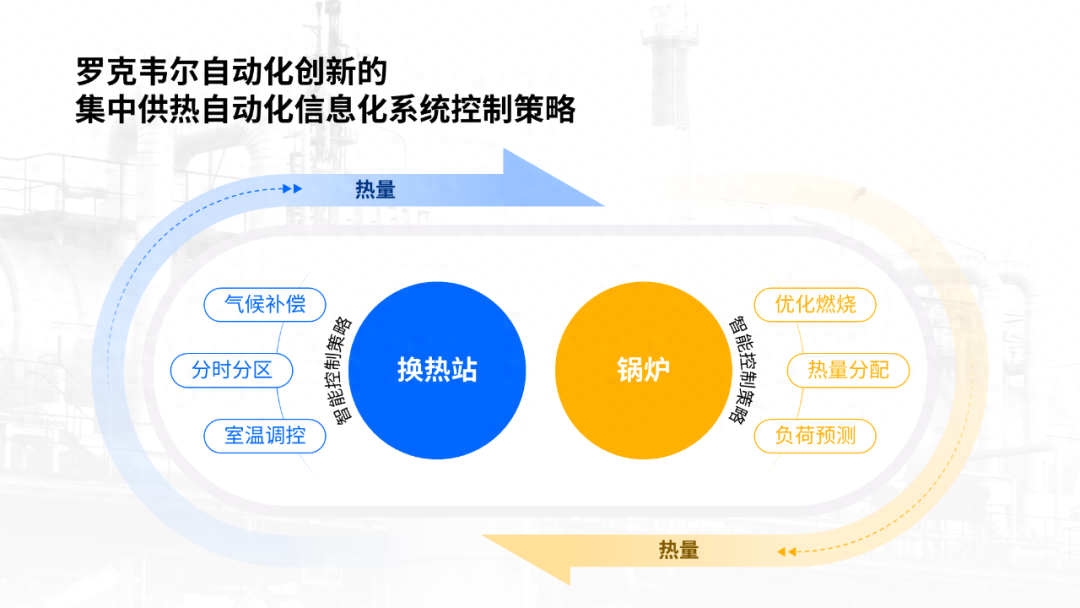
Finally, on the page At the bottom, just add a picture related to the information:
Above, that’s it The entire content of this article.
Of course Regarding the logical graphic styles of circular relationships, everyone still needs to accumulate more. After all, no one is born to do these, right?
Articles are uploaded by users and are for non-commercial browsing only. Posted by: Lomu, please indicate the source: https://www.daogebangong.com/en/articles/detail/zhe-jia-gong-chang-de-PPT-xun-huan-tu-hao-diao-jia-wo-zhi-yong-8-ge-yuan-rang-ta-zhi-jie-gui-le-3-bei.html
 支付宝扫一扫
评论列表(196条)
测试