- Image and text skills
I often encounter long data reports at work.
Group display of table data allows us to observe and organize data more intuitively.
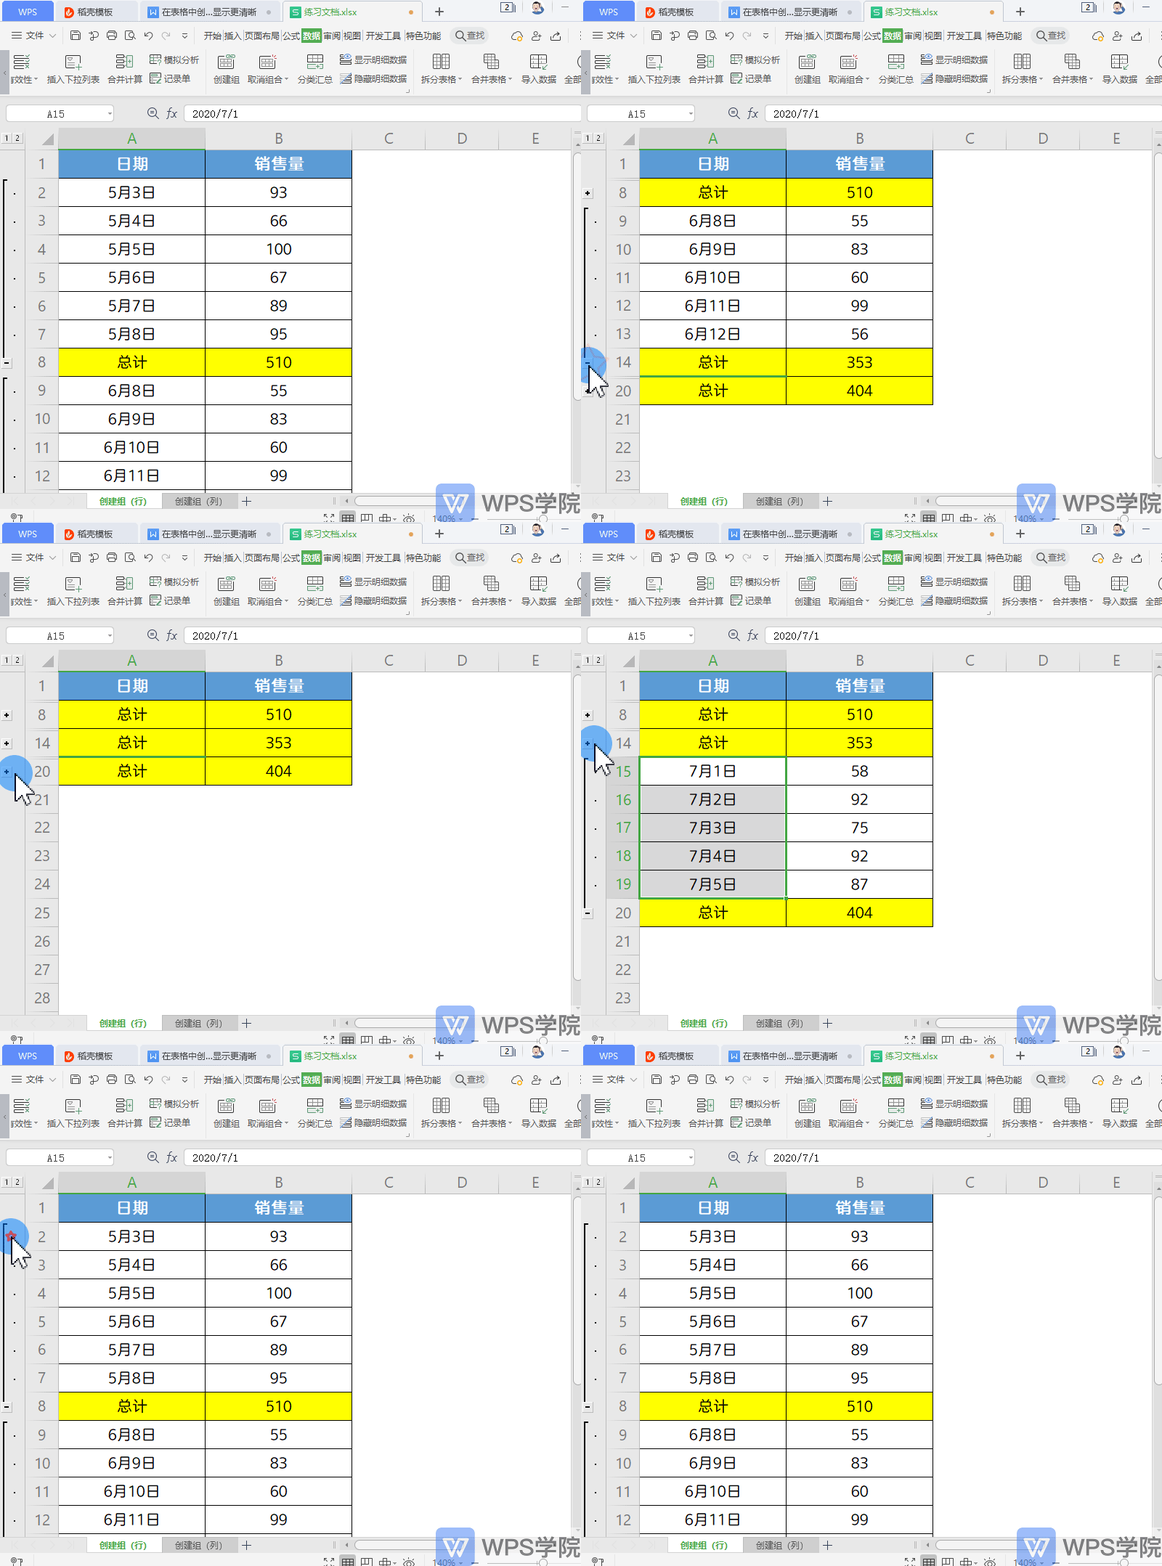

▪The table contains sales volume and totals for three months, which is very inconvenient to view.
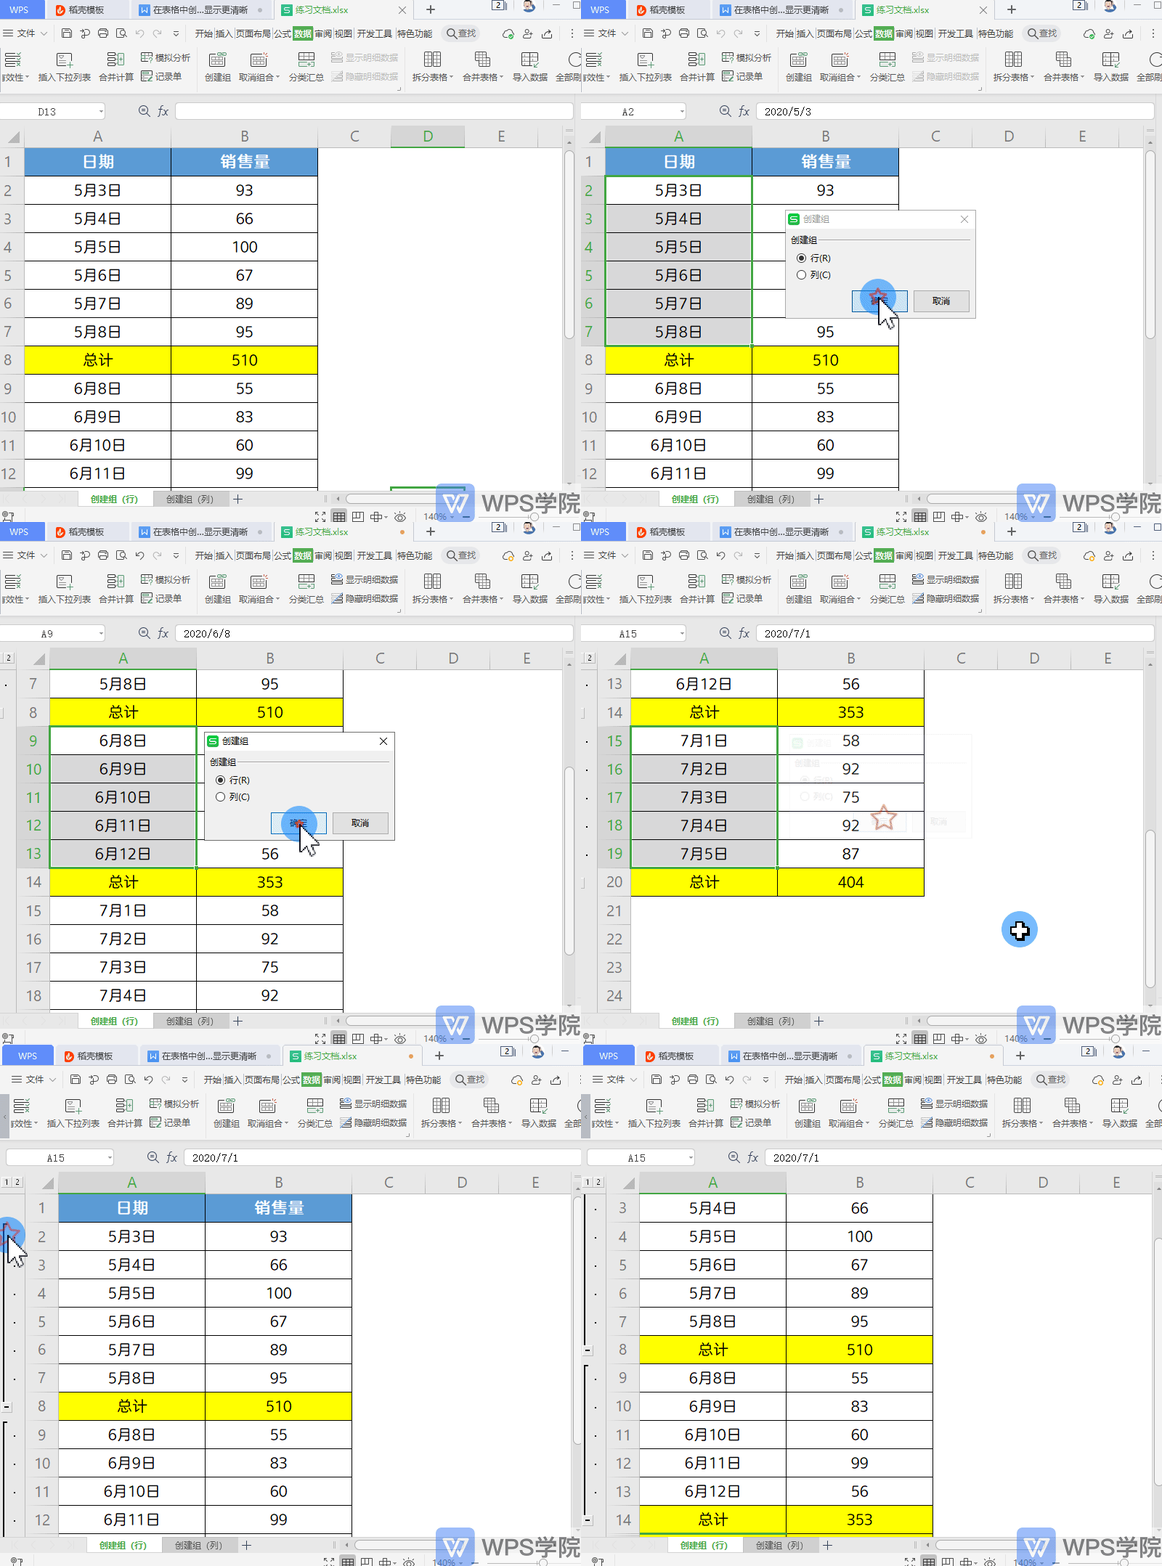
Select the May date range, click the data tab above - Create Group, its shortcut key is Shift+Alt+Right.
The "Create Group" dialog box will pop up, select "OK". It should be noted that needs to be between "group" and "group" separated areas.
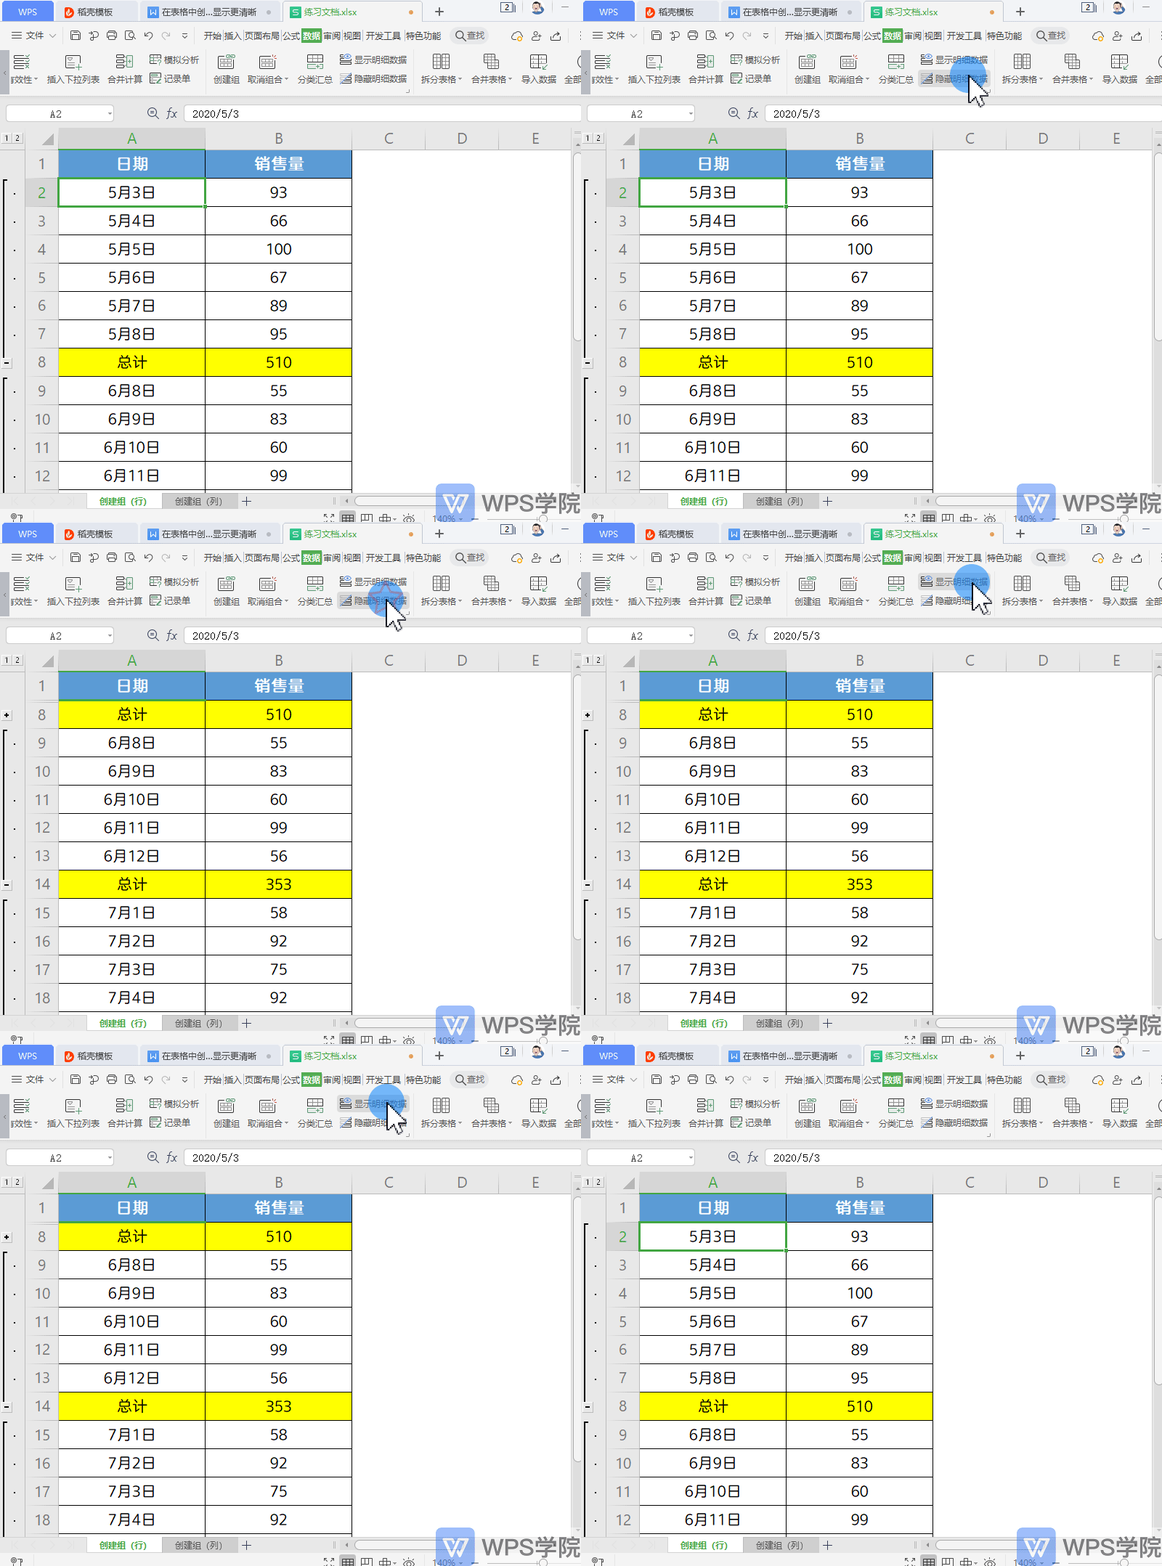
▪Click "Hide detailed data" to hide it;Click"Show detailed data" can display it.
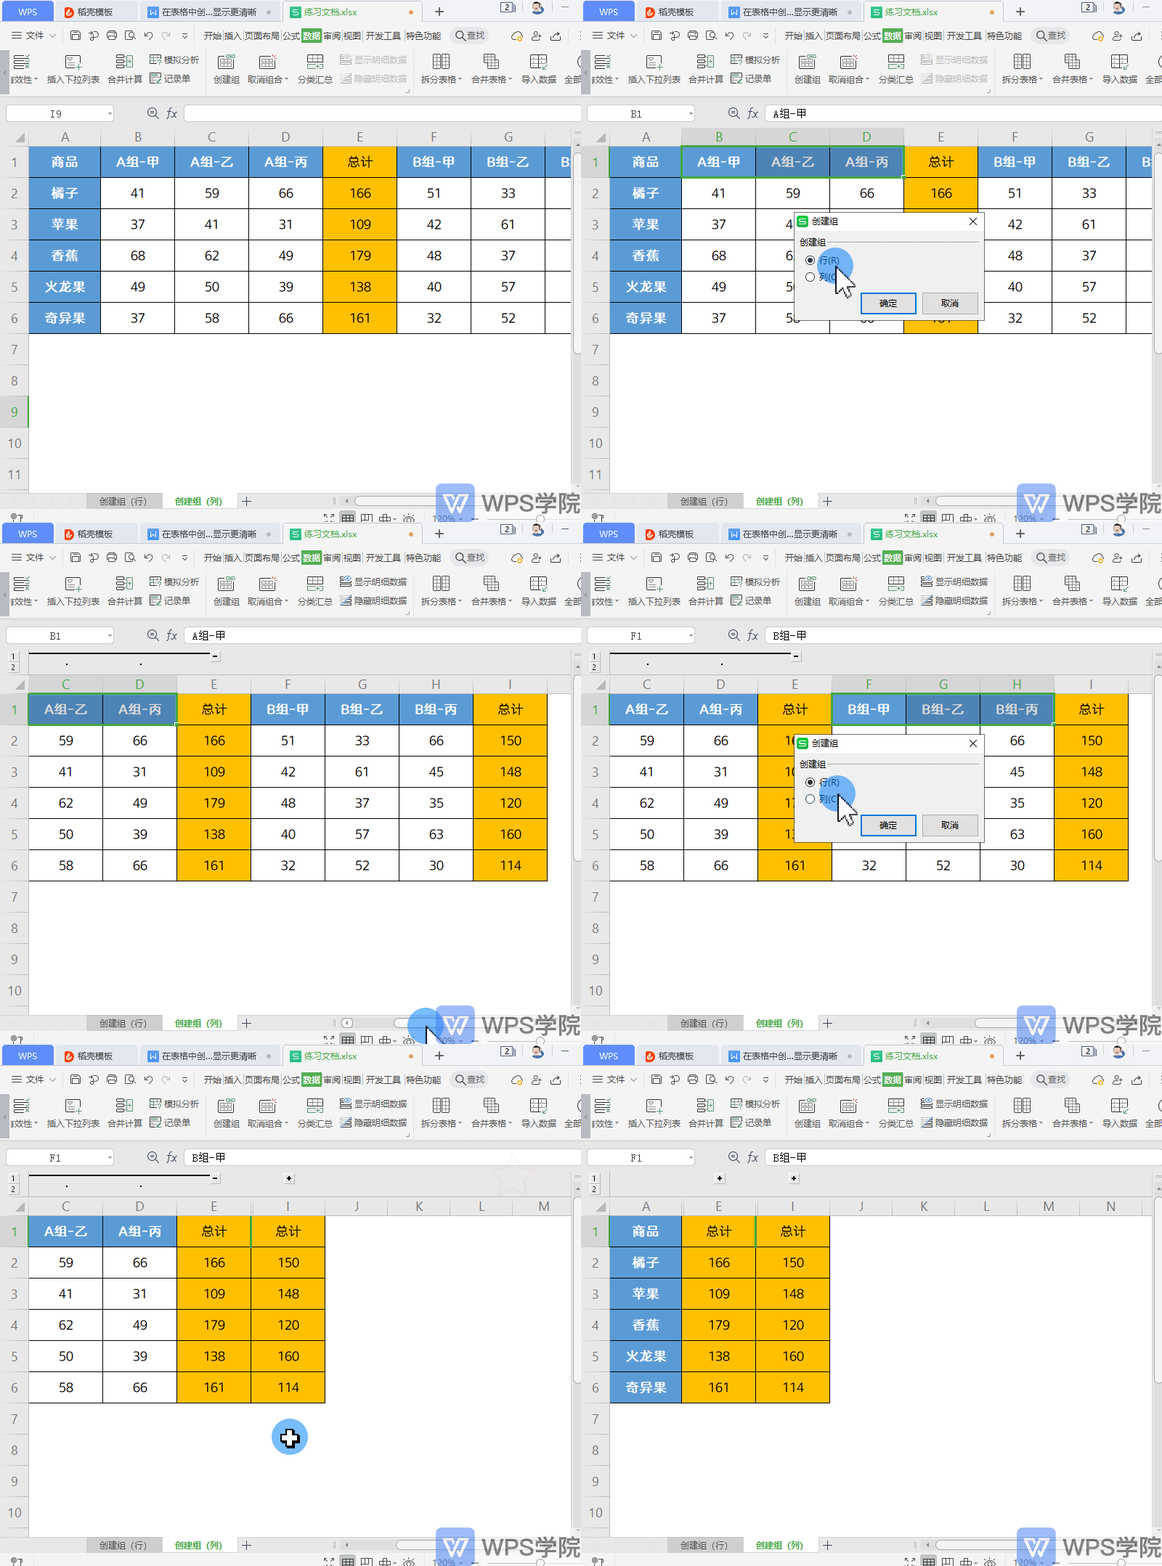
▪Similarly, we can also create groups based on column data of the table.
Click the Data tab - Create Group, and select "Column" in the dialog box, so that you can create data groups by columns.
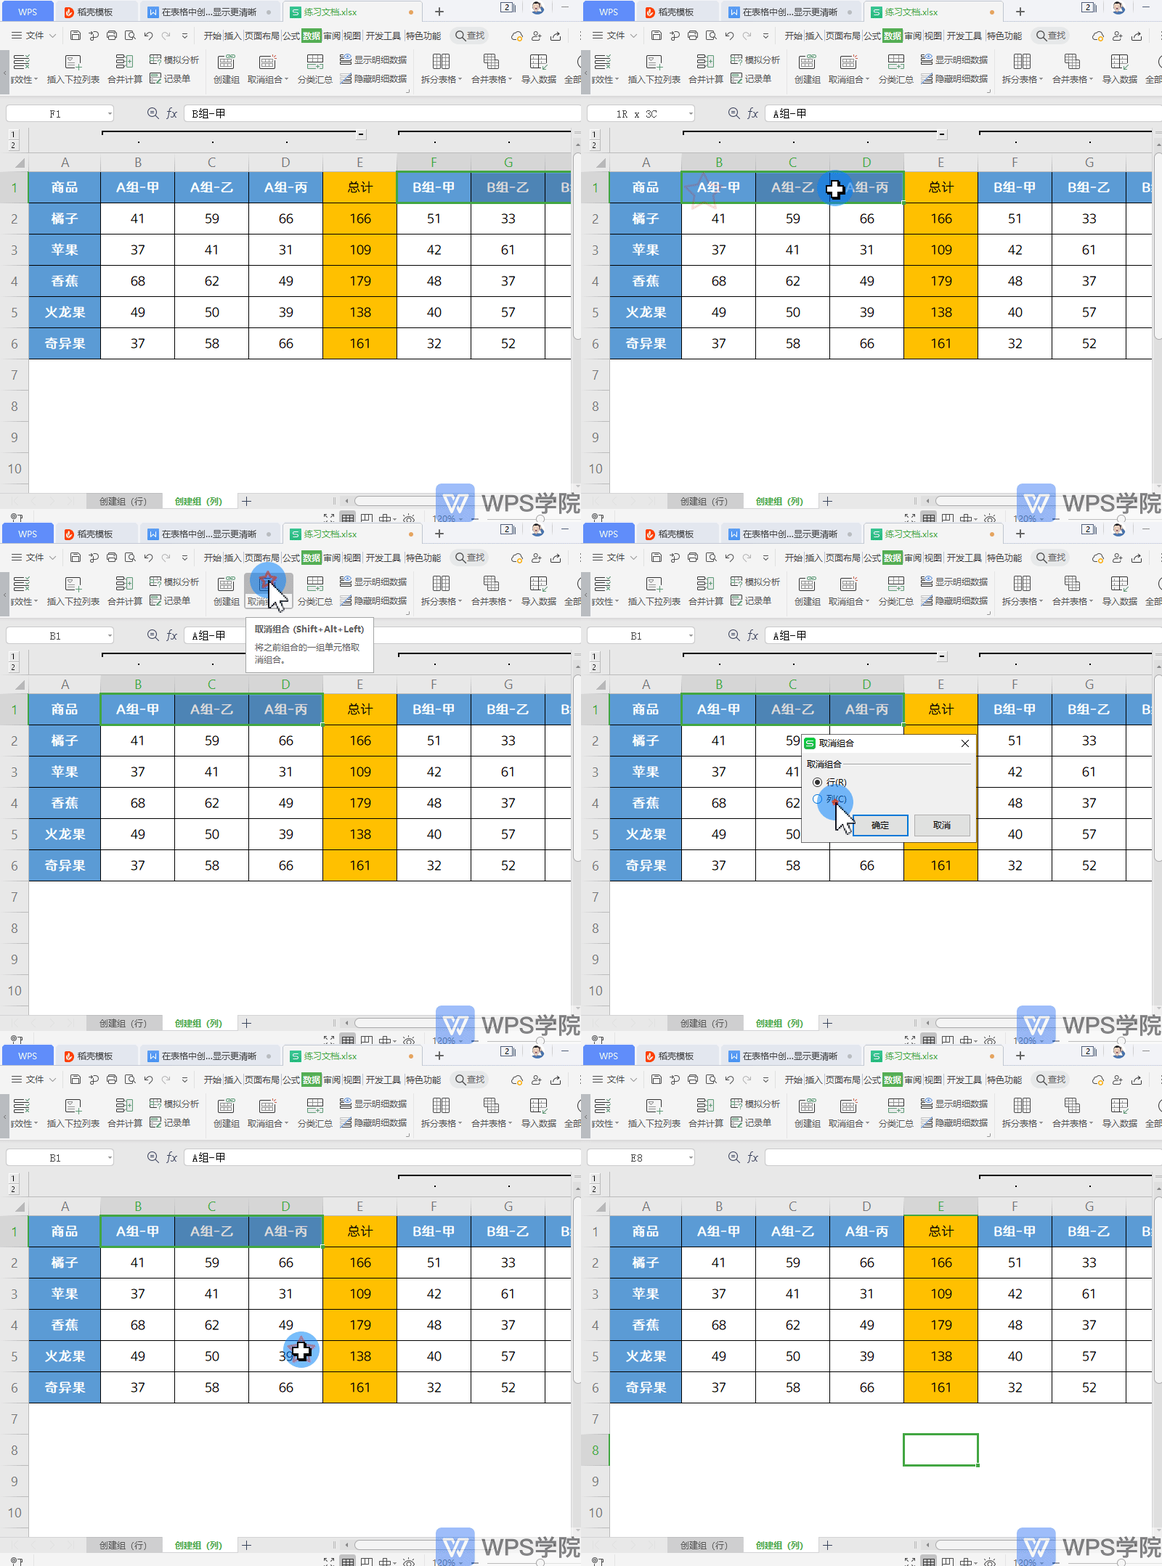
▪How to cancel the grouping of tables?
Position the cursor in the data area where you want to clear the grouping, click the data tab - Ungroup, its shortcut key is Shift+Alt+Left.
This way you can cancel the data grouping of the table.
Articles are uploaded by users and are for non-commercial browsing only. Posted by: Lomu, please indicate the source: https://www.daogebangong.com/en/articles/detail/zai-biao-ge-zhong-chuang-jian-zu-shu-ju-fen-zu-xian-shi-geng-qing-xi.html

 支付宝扫一扫
评论列表(196条)
测试