Editor's introduction: With the continuous development of the Internet, the data volume of each product has become very large, and the data analysis system has played a huge role. Building a complete and effective data analysis system can improve your work efficiency and accuracy. So, what does a complete data analysis system look like? In this article, the author launches a series of narrations on this, let’s take a look.

Many students complain: They do a little bit of this and a little bit of this, but they have never seen what a complete data analysis system looks like.
In fact, as early as 10 years ago, many large banks had already established complete data analysis systems. However, due to the particularity of the industry, not much was known to outsiders.
Let me introduce it to you in detail today.
1. Starting point of construction
Meeting business needs is the starting point for building a data analysis system, as well as the ultimate goal and highest requirement.
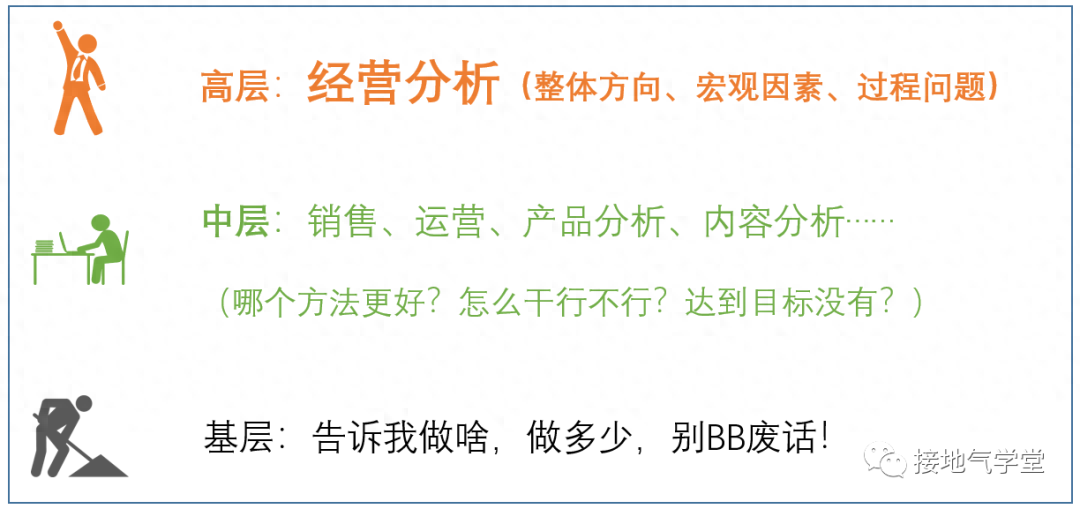
It should be noted that there is no unified standard for "business requirements". Different departments and people with different identities have different needs. From a broad perspective, it can be divided into three levels:
- Strategic level: senior management who can decide the overall direction of the company
- Tactical level: management who decides on a specific function (sales, operations, products, after-sales...)
- Combat level: front-line departments with no decision-making power but only execution power (salesperson/customer service/auditor/warehouse manager...)
These three types of people require completely different types of data, data timeliness, and data application directions.
Therefore, the requirements need to be met separately (as shown below).
2. Data analysis serving strategy
In the entire system, business analysis directly serves strategic-level decision-making.
When the top management makes decisions, they focus more on macro issues, such as the achievement of overall goals, changes in the external environment, and the effectiveness of internal initiatives. Instead of getting bogged down in trivial business details.
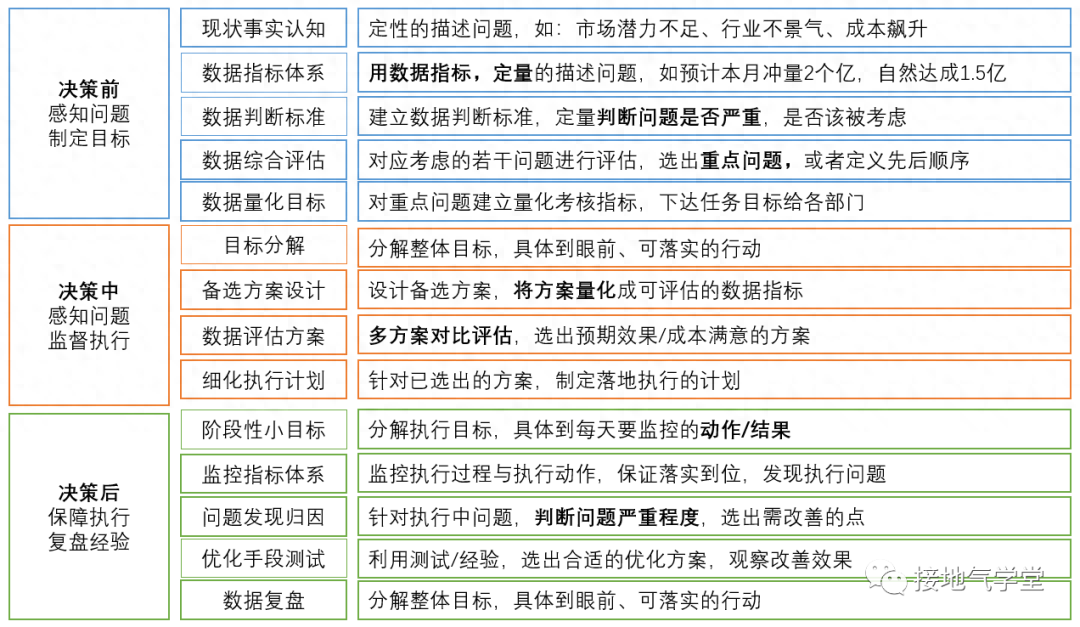
Therefore, when doing business analysis, you should:
- Convert business goals into quantifiable indicators
- Monitor the progress of goal achievement and discover problems in the process
- Perceive changes in the external environment and provide early warning of potential macro problems< /li>
- Quantitatively evaluate the impact of various business activities on the goals
- Assess the effectiveness of various business activities and provide directional guidance
Note: Accounting for operating results is very complex and troublesome. Many business initiatives span weeks and months and involve numerous departments and tasks. Some basic research and development, production line updates, and infrastructure investments span several years.
Therefore, the frequency of business analysis is generally not very high and is generally conducted on a monthly basis. Decisions made at the business analysis level are often directional, such as:
- Stick to the original plan or make adjustments?
- Sales/operations/products/marketing...who is the main force and who is the auxiliary?
- Additional investment or changing methods?
These decisions directly impact tactical-level design. As for the specific design, it must be supported by tactical-level analysis.
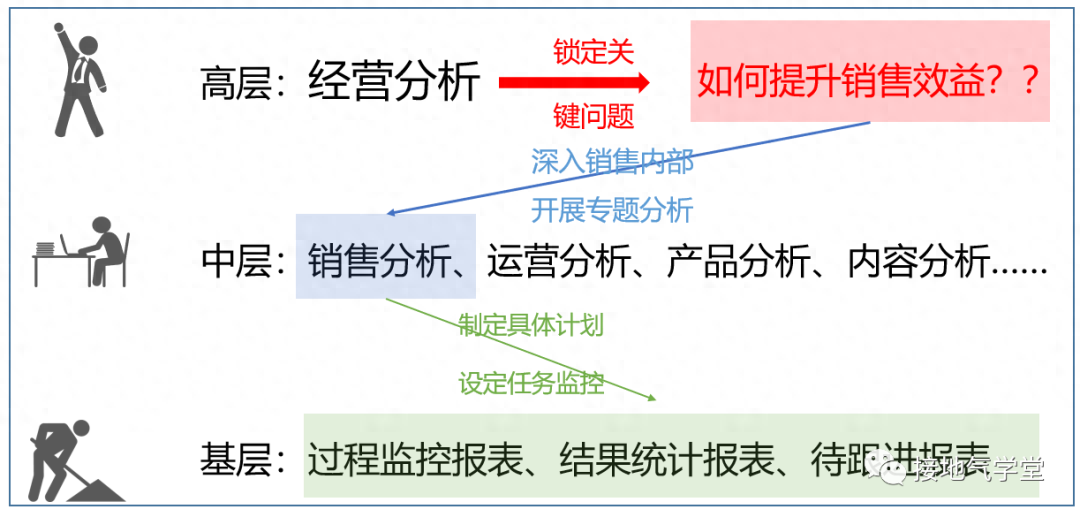
3. Data analysis serving tactics
Tactical-level analysis is specific to each functional department.
for example:
- Sales department: sales performance analysis, sales channels, sales methods, sales team analysis
- Operations department: activity method analysis , promotion method analysis, platform operation analysis
- Product Department: product usage analysis, new version functions, new version analysis
The specific content of these tactical-level analyzes often varies, but the core idea is the same:
- Strategy formulation: Choose one from many tactics that can achieve the goal
- Monitor progress: Monitor the progress of the tactics. Discover problems and adjust tactical design
- Review effect: Review whether the goal is achieved, accumulate experience, and solve problems
There are too many specific details, so I won’t give examples one by one. Interested students can look at the operations and product analysis methods shared previously.
In fact, most students who do data analysis are most often exposed to this level of analysis. The final output is also a daily monitoring report + a special analysis report.
4. Data analysis serving the battle
Strictly speaking, what the combat level requires is not data analysis, but data.
The frontline work is so busy that no one has time to sit down and listen carefully to the report. If you can see the data, it is enough to take action. for example:
- Front-line sales: See today’s performance targets, today’s completed results, and the list of customers to be followed up
- Front-line customer service: See the call volume to be allocated, the number of calls queued, the number of complaints, Complaint results
- First-line warehouse management: see the number of goods in the warehouse, the number of goods in transit, the estimated number of goods arriving, and the expected number of goods leaving the warehouse
With data, the frontline can already take action. Work quickly and finish the unfinished tasks. It would be better if you could add some auxiliary tools to the basic list.
For example, for sales, not only has a list of customers to be followed up, but also an estimated natural consumption (labeled through the prediction model), which can help sales focus on the people who should actively follow up.
For example, if you give one more: customers can participate in activities/customers can forward posters, sales will have one more tool to impress customers.
These tools are much more useful than long-winded analysis reports (as shown below).
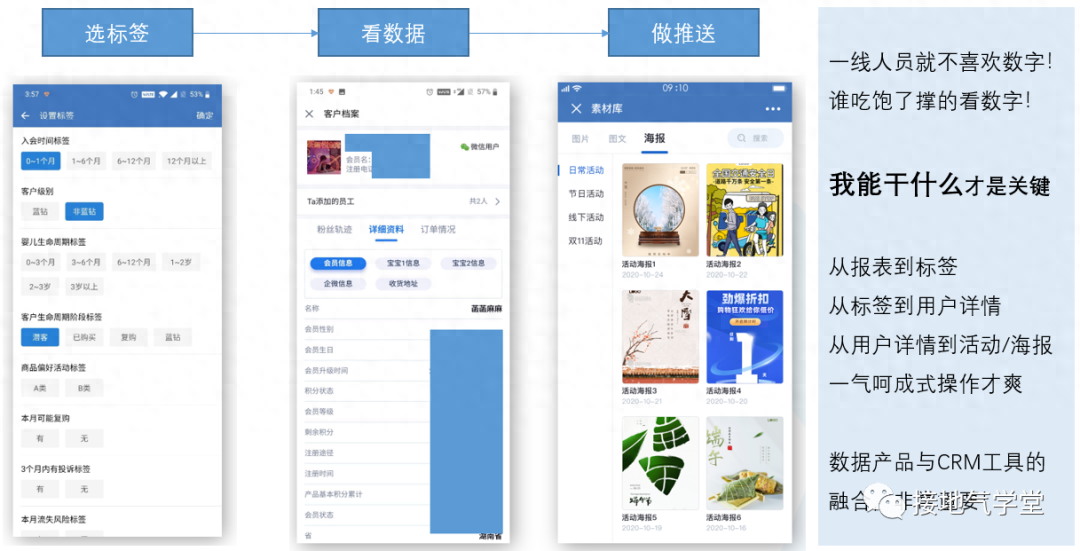
The combat-level data analysis of quite a few companies only stays at the excel daily and ppt stage. The lack of tool design and development has led to problems such as data analysis not being implemented and being unable to assist the front line.
Seeing this, some students must be curious: Teacher, my company is not that big and there is not that much data. How can I make it more systematic? There is a method here.
5. How do small and medium-sized enterprises go from 0 to 1
Start-up companies definitely don’t have the energy to develop such a large data system.
For start-up companies, the key is to find a profitable MVP as soon as possible, and then continue to expand investment and enhance revenue capabilities. Therefore, for start-up companies, they generally focus on sales data/promotion data/channel data and do a good job of tactical-level analysis.
For enterprises of a certain scale, the most important thing is not to produce various analysis reports (usually all that should be available are available), nor to produce complex analysis reports. Instead, we should strengthen infrastructure construction and make up for the shortcomings left by the rapid progress in the initial stage. for example:
- Commodity coding system, product classification labels
- Activity coding system, activity material coding system, coupon system
- Financial system and business system are connected, financial data and Business data correspondence
These may not only be database designs, but also the old trading systems, logistics systems, and cost control systems may need to be upgraded, and the business processes must also be standardized, so it is a very large project.
However, if you do not overcome this hurdle and continue to muddle along on the old basis, you will find that the larger the scale, the more chaotic the internal system will be, the more complex the data will be, the more inconsistent the old and new data will be, and the further it will become more difficult.
In 2021, Mr. Chen has experienced several digitalization proposals for medium-sized enterprises with a turnover of 3 billion to 10 billion. Without exception, there was the problem of weak infrastructure + great achievements.
Often, the most basic product data, activity data, and channel data are not well constructed. Instead, they are eager to join CDP, rush to develop algorithms in APP/H5, and rush to bury the entire link.
The natural result is: building skyscrapers in mud... all kinds of entanglements, not to mention.
6. Behind the problem
All the above problems will be obvious to anyone who is involved in them. But why has no one solved it?
- It may be that the business department is arrogant and powerful, and does not want to allow data to participate, and only allows excel tables
- It may be that the boss of the technical department wants to be promoted, and the infrastructure construction is not conspicuous enough, so new things must be introduced< /li>
- It may be that the company boss has no knowledge at all and is making a fortune from the industry dividends, lacking basic knowledge
These may cause the data to stop at the original stage.
Then they hope that a powerful data analyst can solve all the problems. They will hold your hand eagerly and say: "Our company's data is huge, it's all there, we just need a master to analyze it." ..." So if students doing analysis encounter:
- Do one thing in the past and another in the west
- Only write sql and organize excel
- Be rejected by the business and have no depth
You are not alone, you are suffering like many classmates. After all, there are only a few companies that do well. At this time, you just need to work hard to accumulate skills and switch to a better company.
Then some students will definitely ask: What abilities do you need to be considered a senior data analyst? We will share it in the next issue, so stay tuned.
#Columnist#
Mr. Chen, a down-to-earth teacher, has a WeChat public account: Down-to-earth School, where everyone is a product manager columnist. A senior consultant with rich data-related experience in 15 industries including the Internet, finance, FMCG, retail, durables, and beauty.
This article was originally published on Everyone is a Product Manager. Reprinting without permission is prohibited
The title picture comes from Unsplash and is based on the CC0 license.
Articles are uploaded by users and are for non-commercial browsing only. Posted by: Lomu, please indicate the source: https://www.daogebangong.com/en/articles/detail/yi-ge-wan-zheng-de-shu-ju-fen-xi-ti-xi-gai-zhang-sha-yang.html
 支付宝扫一扫
评论列表(196条)
测试