- Picture and text skills
When making slides, you may encounter situations where you need to use charts to display data.
How to choose a suitable chart? Let’s talk about several basic charts and how to make them.

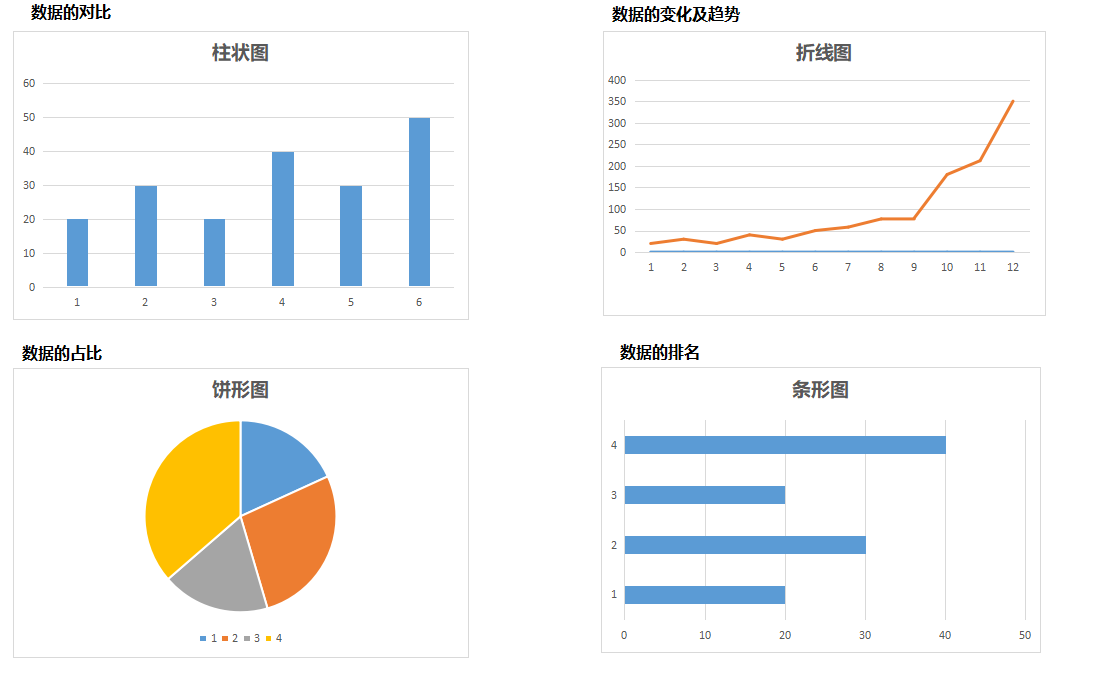
Histograms are used to represent comparisons of data
Line charts are used to represent changes and trends in data
Pie chart is used to represent the proportion of data
Bar charts are used to represent the ranking of data

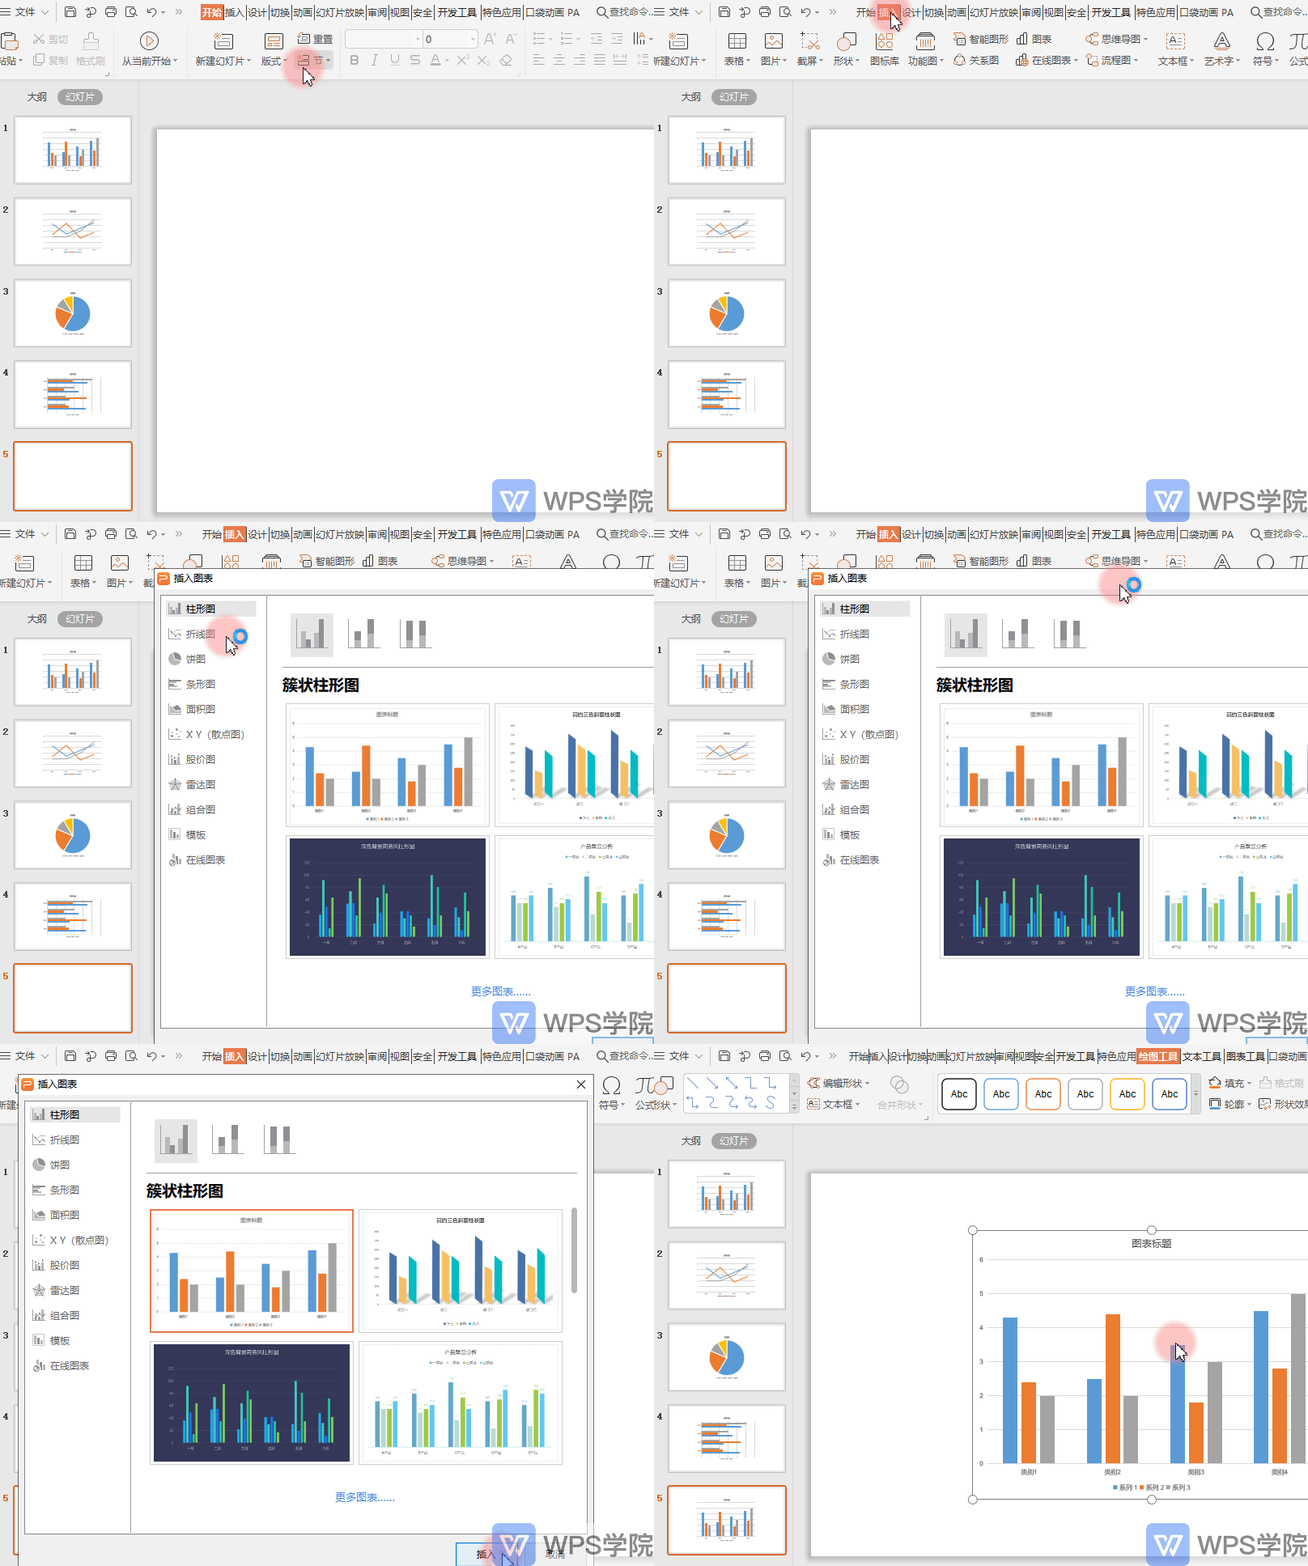
■ In the WPS demo, you can insert data charts with one click. Click "Insert" - "Chart" and select a chart type.

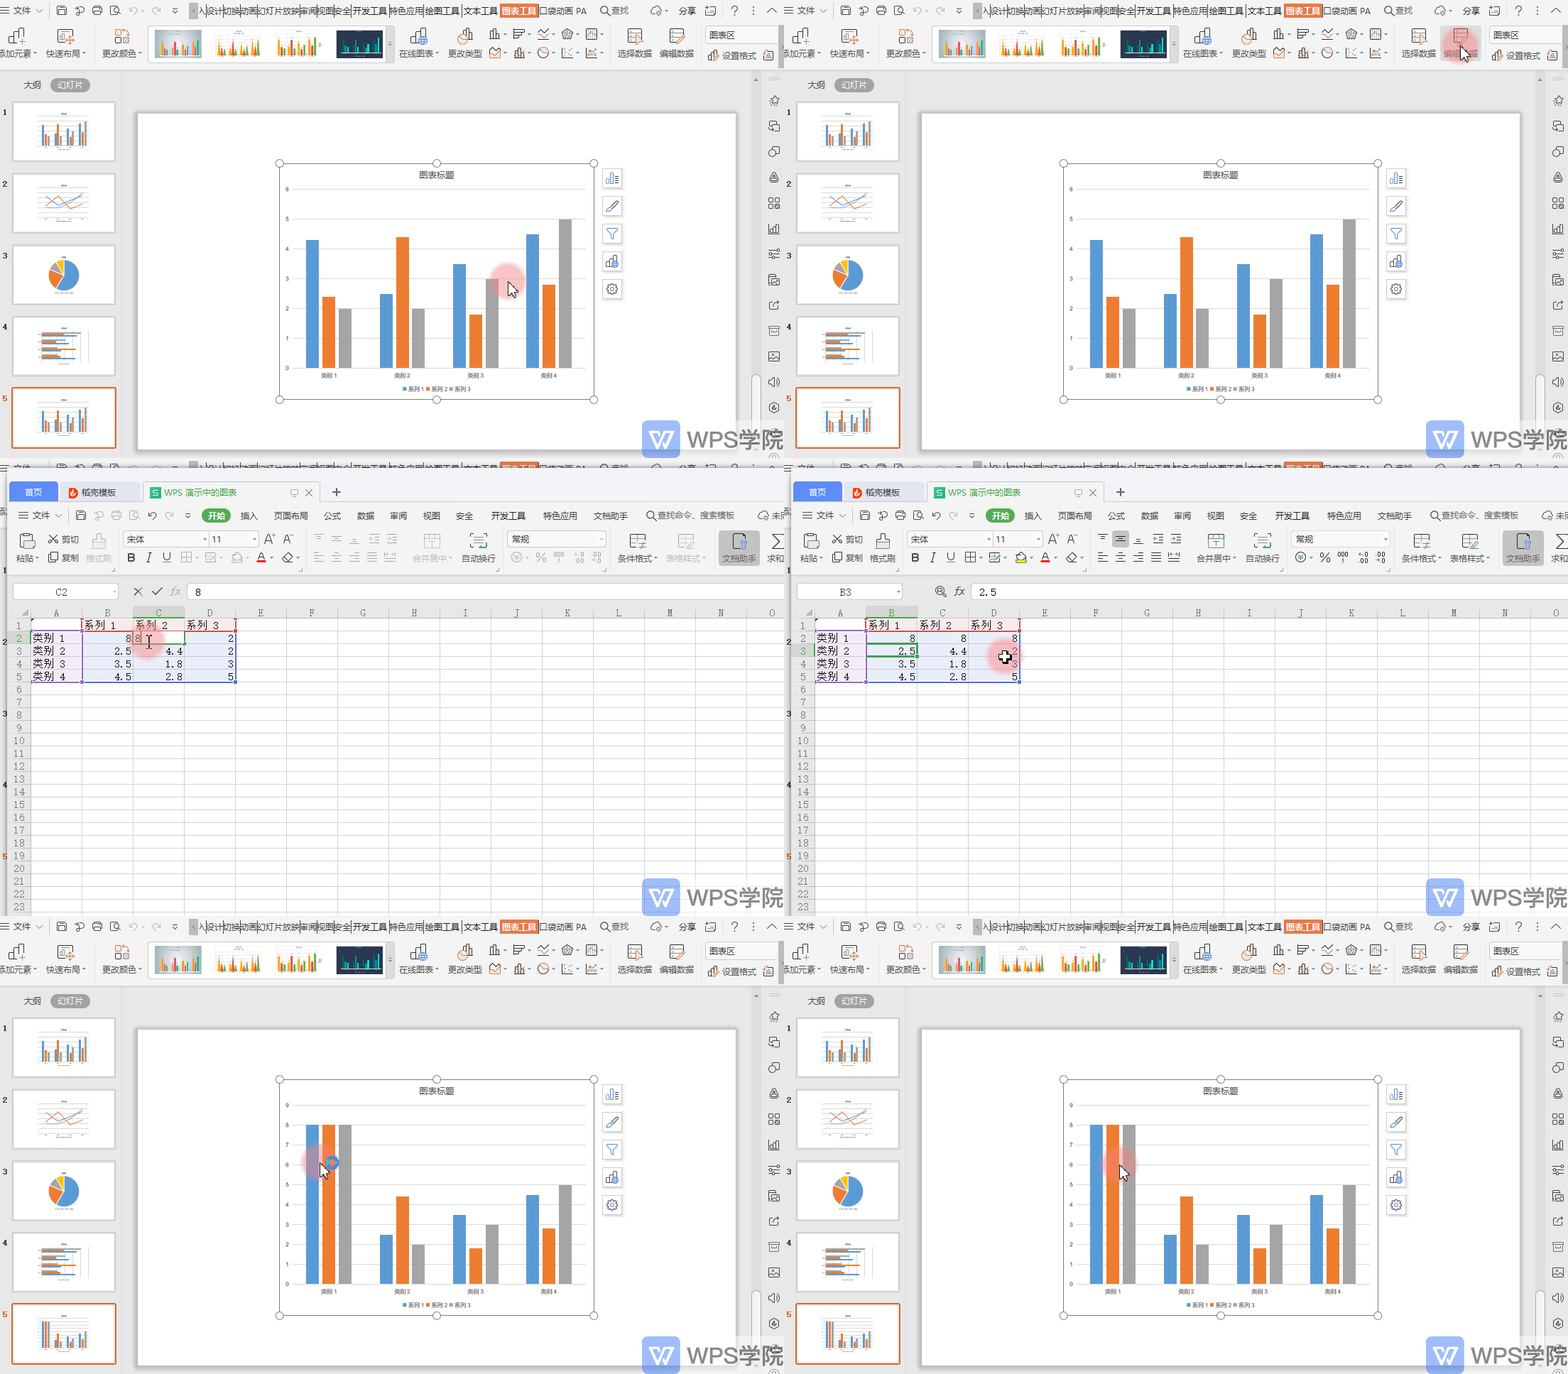
■ After inserting the chart, click "Edit Data", WPS will open the WPS table, modify the data here, and the chart content will be synchronized.
It is very easy to create an image chart.

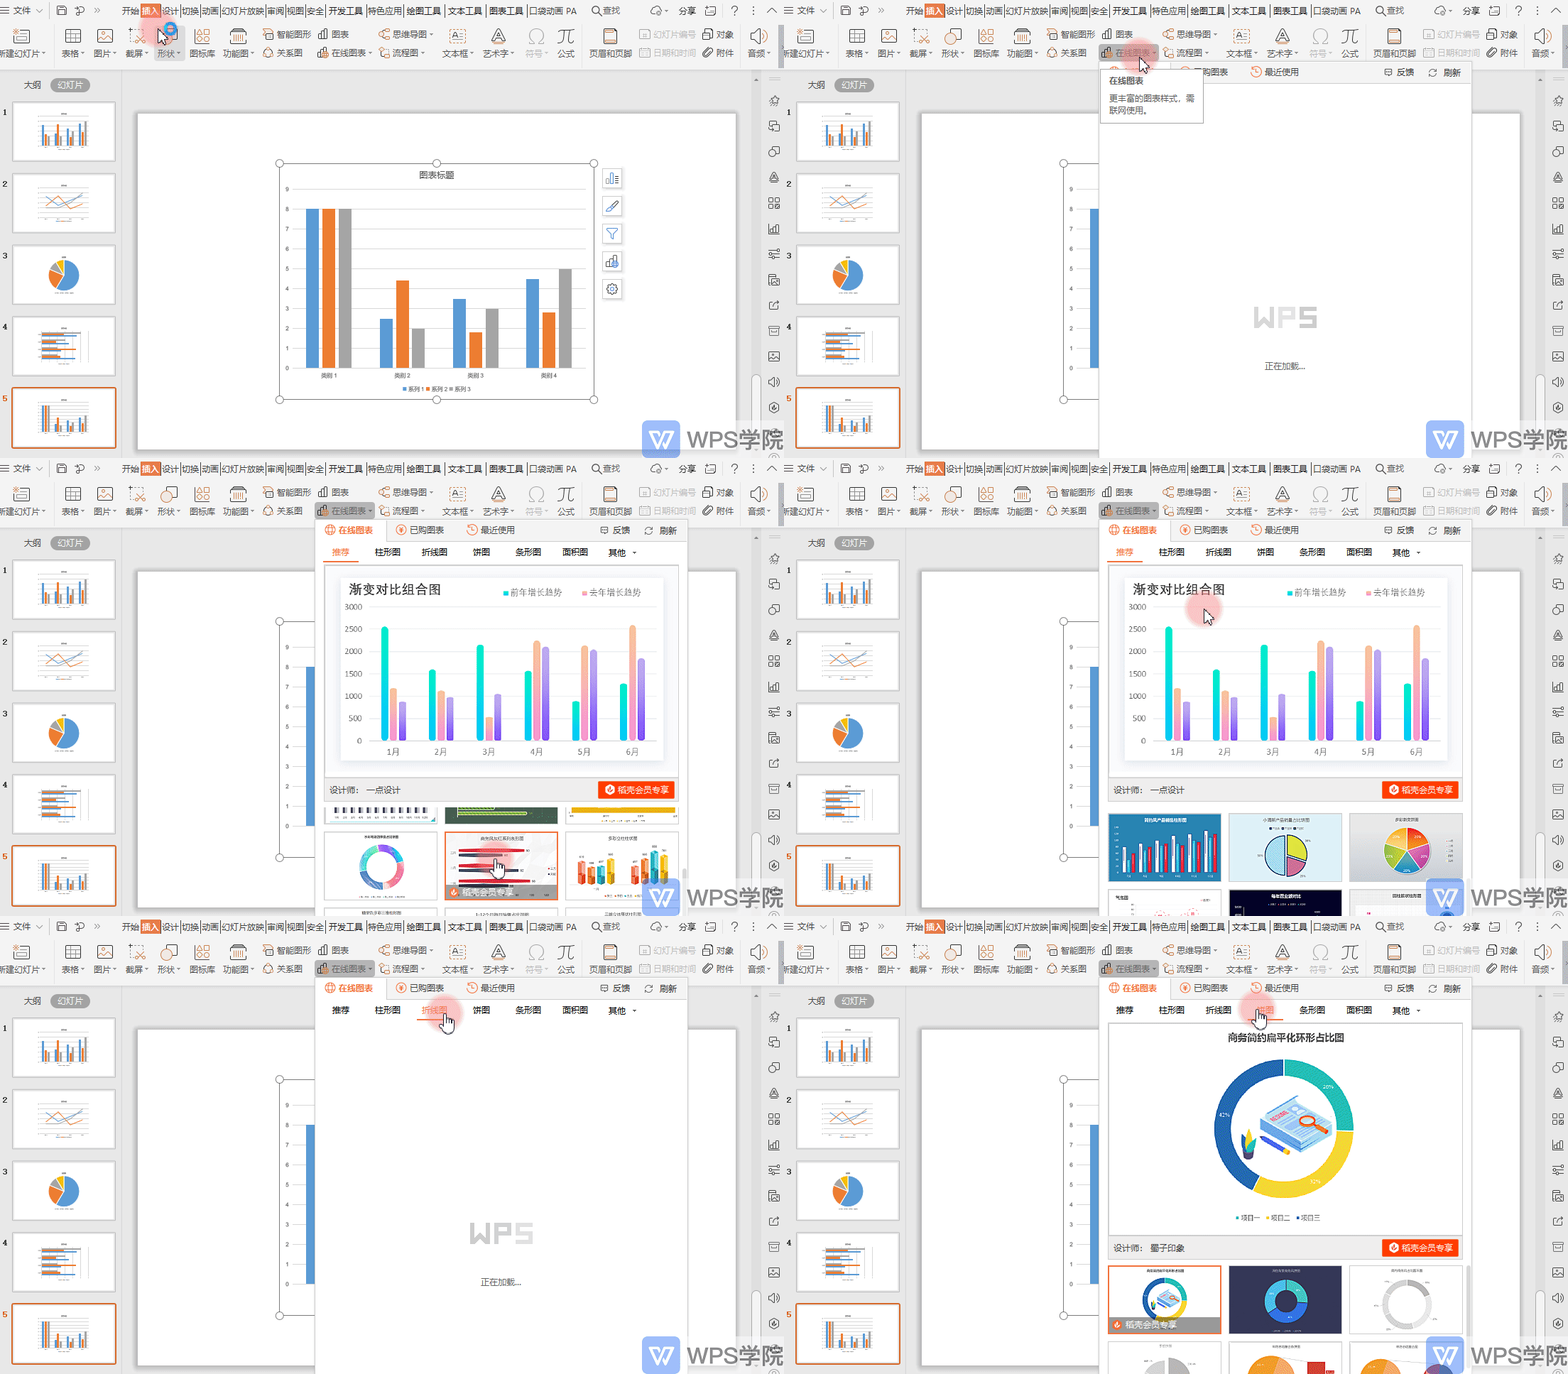
■ If you are a WPS member, you can also go to "Insert" - "Online Chart".
Use the chart templates carefully designed by designers to make your PPT production more time-saving and labor-saving.

Articles are uploaded by users and are for non-commercial browsing only. Posted by: Lomu, please indicate the source: https://www.daogebangong.com/en/articles/detail/yan-shi-xin-shou-jiao-cheng-zen-yang-xuan-ze-he-shi-de-PPT-shu-ju-tu-biao.html

 支付宝扫一扫
评论列表(196条)
测试